| Param | Original file | Final file |
|---|---|---|
| Filename | modeM0/AS1G07_072T01_9000001452cztM0_level2.fits | modeM0/AS1G07_072T01_9000001452cztM0_level2_quad_clean.evt |
| Size (bytes) | 393,065,280 | 275,215,680 |
| Size | 374.9 MB | 262.5 MB |
| Events in quadrant A | 2,425,384 | 1,451,150 |
| Events in quadrant B | 2,313,676 | 1,453,384 |
| Events in quadrant C | 2,363,334 | 1,404,332 |
| Events in quadrant D | 1,998,110 | 1,223,921 |
| Mode SS | |||
|---|---|---|---|
| Quadrant | BADHDUFLAG | Total packets | Discarded packets |
| A | 0 | 851 | 0 |
| B | 0 | 855 | 0 |
| C | 0 | 832 | 0 |
| D | 0 | 854 | 0 |
| Mode M0 | |||
|---|---|---|---|
| Quadrant | BADHDUFLAG | Total packets | Discarded packets |
| A | 0 | 85079 | 0 |
| B | 0 | 88243 | 0 |
| C | 0 | 85281 | 0 |
| D | 0 | 101968 | 0 |
| Mode M9 | |||
|---|---|---|---|
| Quadrant | BADHDUFLAG | Total packets | Discarded packets |
| A | 0 | 101 | 0 |
| B | 0 | 98 | 0 |
| C | 0 | 96 | 0 |
| D | 0 | 102 | 0 |
| Quadrant | Total seconds | Saturated seconds | Saturation percentage |
|---|---|---|---|
| A | 40966 | 476 | 1.161939% |
| B | 40884 | 593 | 1.450445% |
| C | 40933 | 401 | 0.979650% |
| D | 40099 | 869 | 2.167136% |
Noise dominated data is calculated using 1-second bins in cleaned event files. If a bin has >2000 counts, and if more than 50% of those come from <1% of pixels, then it is considered to be noise-dominated and hence unusable.
| Quadrant | # 1 sec bins | Bins with >0 counts | Bins with >2000 counts | High rate bins dominated by noise | Noise dominated (total time) | Noise dominated (detector-on time) | Marked lightcurve |
|---|---|---|---|---|---|---|---|
| A | 86562 | 43522 | 0 | 0 | 0.00% | 0.00% | 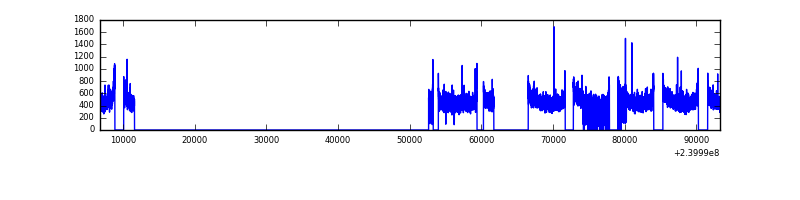 |
| B | 86562 | 43342 | 0 | 0 | 0.00% | 0.00% | 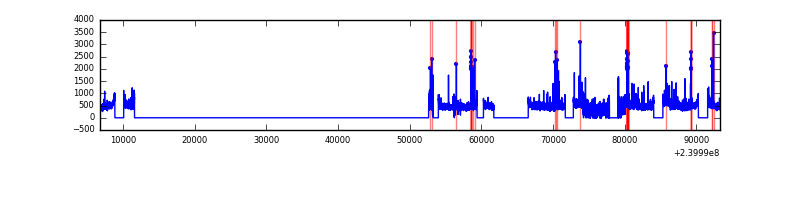 |
| C | 86562 | 43440 | 0 | 0 | 0.00% | 0.00% |  |
| D | 86562 | 42429 | 0 | 0 | 0.00% | 0.00% |  |
Top three noisy pixels from each quadrant. If the there are fewer than three noisy pixels in the level2.evt file, extra rows are filled as -1
| Pixel properties | Quadrant properties | ||||||
|---|---|---|---|---|---|---|---|
| Quadrant | DetID | PixID | Counts | Sigma | Mean | Median | Sigma |
| A | 0 | 29 | 2365 | 11.21 | 631 | 592 | 158.2 |
| A | 7 | 110 | 1972 | 8.72 | 631 | 592 | 158.2 |
| A | 0 | 30 | 1876 | 8.11 | 631 | 592 | 158.2 |
| B | 2 | 9 | 1971 | 11.23 | 613 | 587 | 123.3 |
| B | 12 | 226 | 1574 | 8.01 | 613 | 587 | 123.3 |
| B | 5 | 128 | 1562 | 7.91 | 613 | 587 | 123.3 |
| C | 1 | 81 | 1719 | 7.01 | 624 | 580 | 162.6 |
| C | 1 | 80 | 1707 | 6.93 | 624 | 580 | 162.6 |
| C | 9 | 233 | 1630 | 6.46 | 624 | 580 | 162.6 |
| D | 3 | 14 | 1566 | 6.84 | 569 | 517 | 153.4 |
| D | 6 | 231 | 1432 | 5.96 | 569 | 517 | 153.4 |
| D | 6 | 83 | 1414 | 5.85 | 569 | 517 | 153.4 |
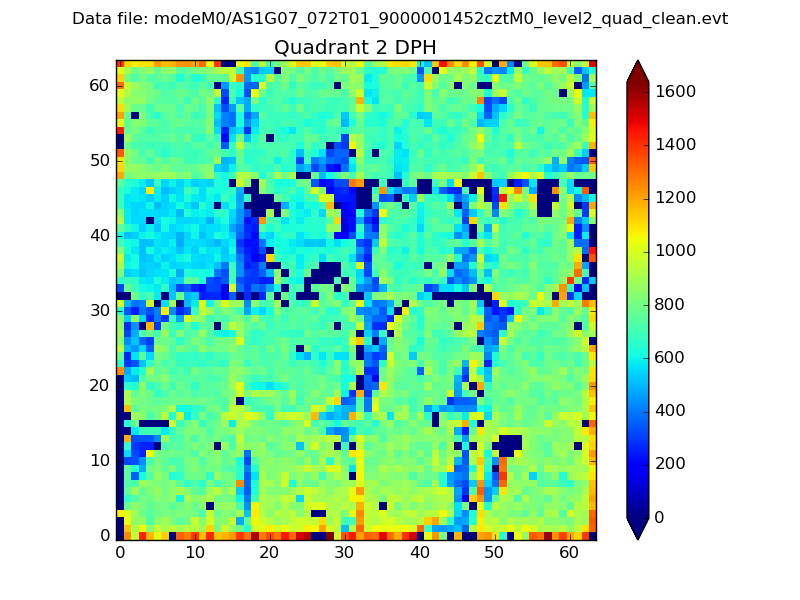
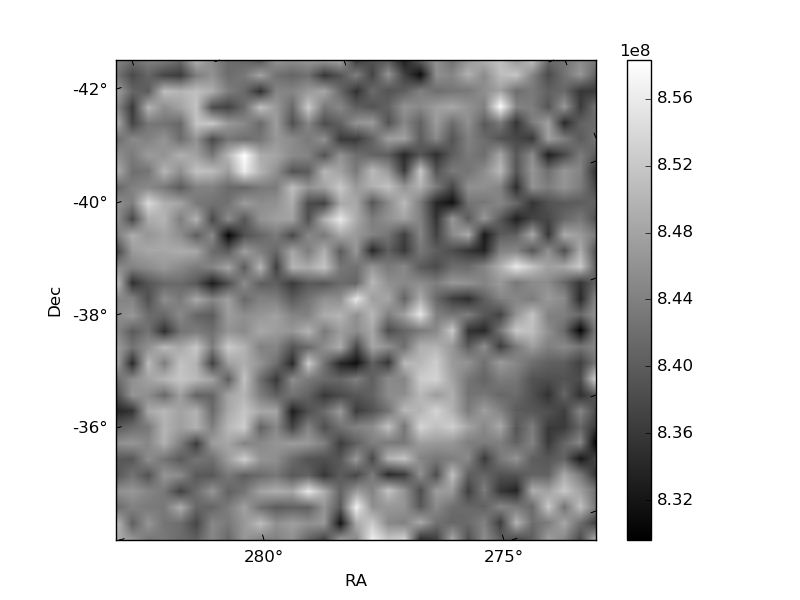
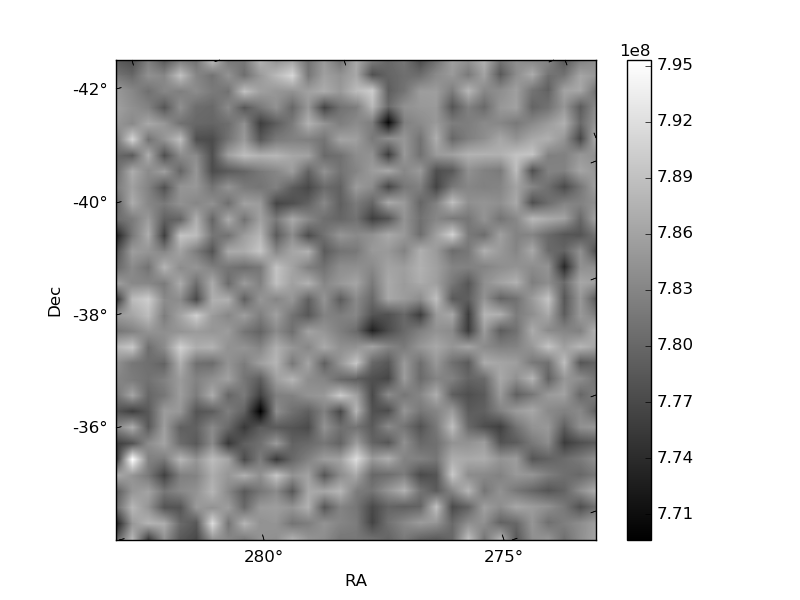
Histogram calculated using DETX and DETY for each event in the final _common_clean file
| Quadrant A | 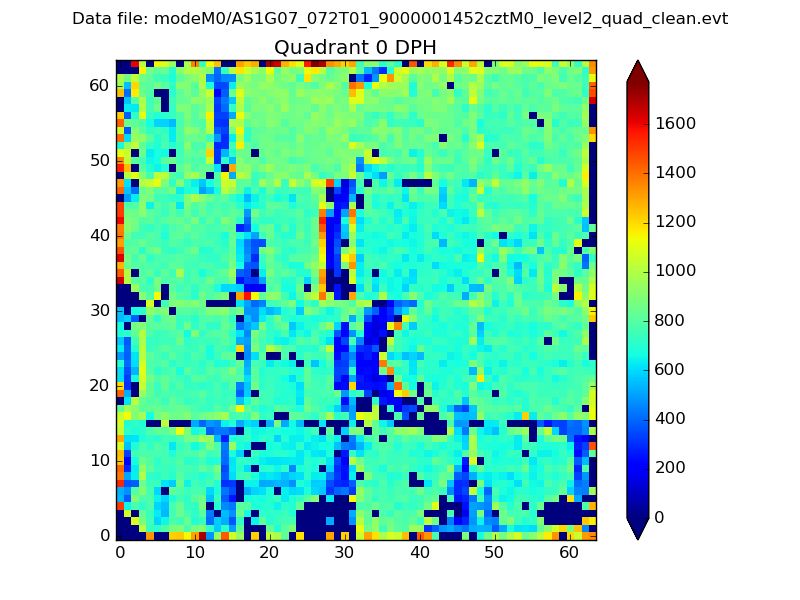 |
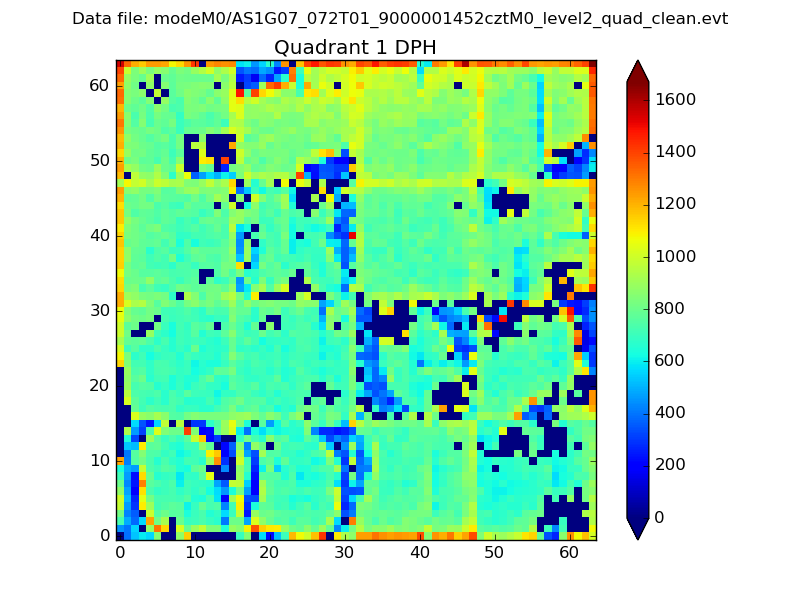 |
Quadrant B |
|---|---|---|---|
| Quadrant D |  |
 |
Quadrant C |
| Plot type | Count rate plots | Images |
|---|---|---|
| Comparison with Poisson distribution Blue bars denote a histogram of data divided into 1 sec bins. Red curve is a Poisson curve with rate = median count rate of data. |
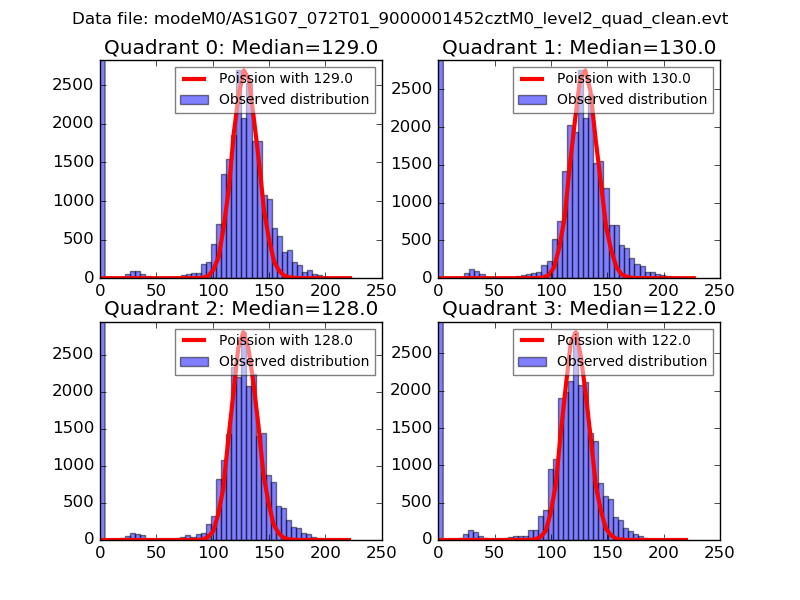 |
 |
| Quadrant-wise count rates Data is divided into 100 sec bins |
 |
|
| Module-wise count rates for Quadrant A Data is divided into 100 sec bins |
 |
 |
| Module-wise count rates for Quadrant B Data is divided into 100 sec bins |
 |
 |
| Module-wise count rates for Quadrant C Data is divided into 100 sec bins |
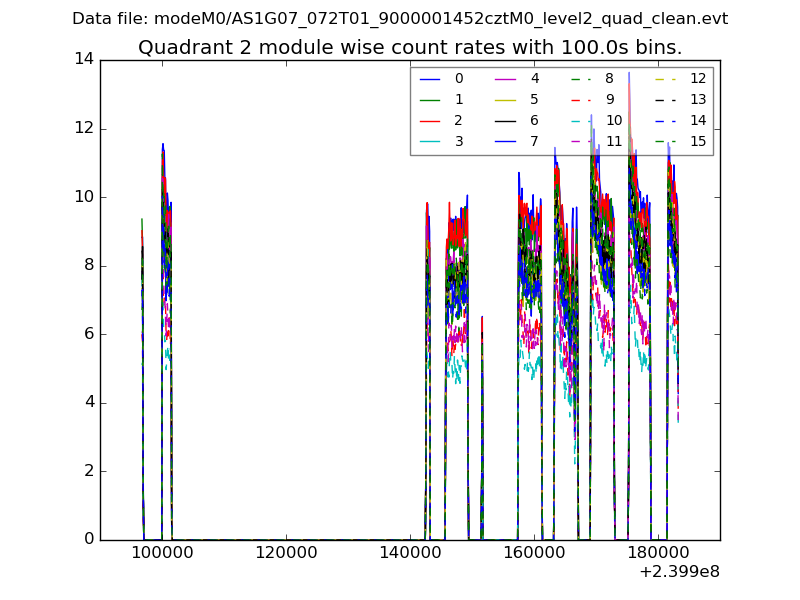 |
 |
| Module-wise count rates for Quadrant D Data is divided into 100 sec bins |
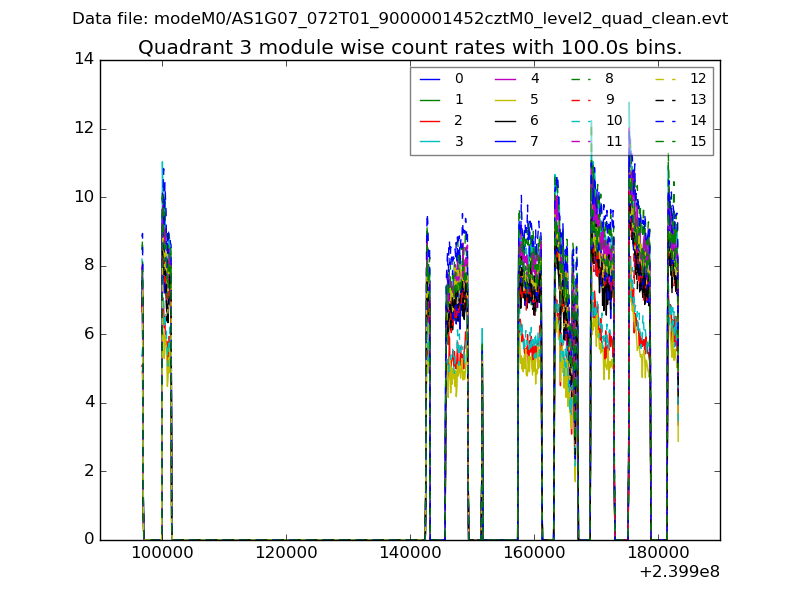 |
 |
| Parameter | Plot |
|---|---|
| CZT HV Monitor |  |
| D_VDD |  |
| Temperature 1 |  |
| Veto HV Monitor | 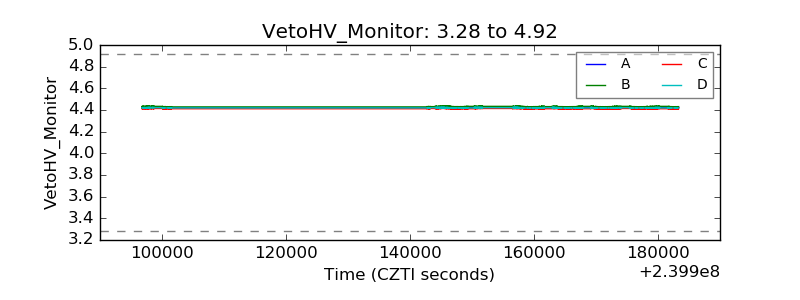 |
| Veto LLD | 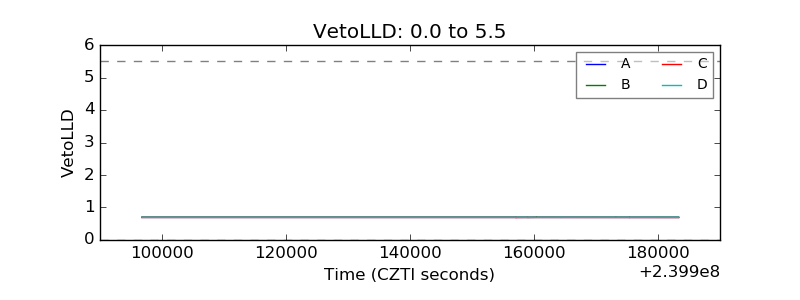 |
| Alpha Counter |  |
| _CPM_Rate | 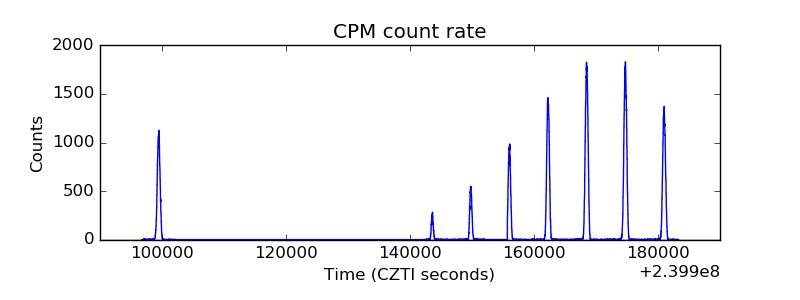 |
| CZT Counter | 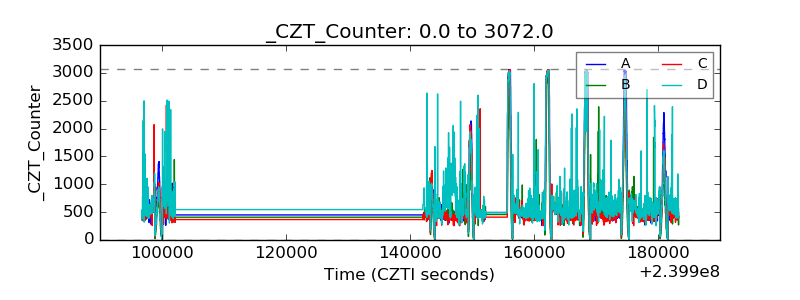 |
| +2.5 Volts monitor | 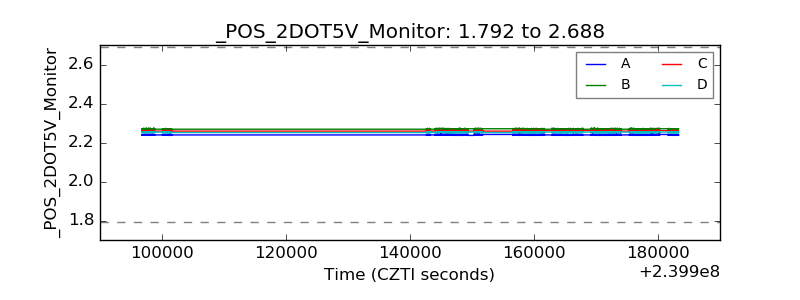 |
| +5 Volts monitor |  |
| _ROLL_ROT | 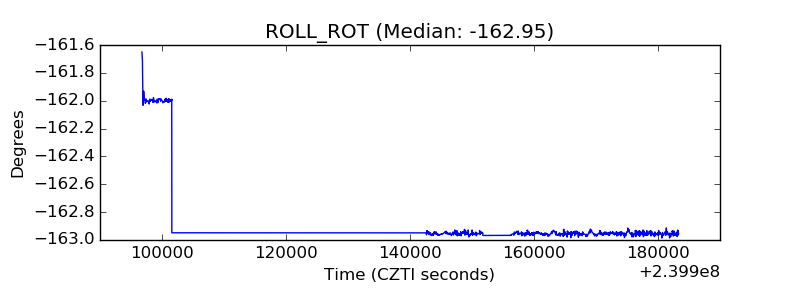 |
| _Roll_DEC | 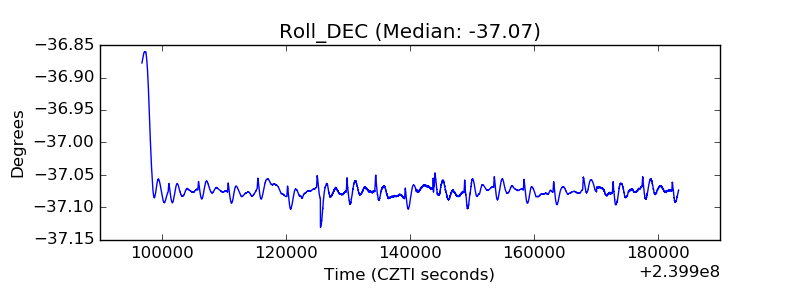 |
| _Roll_RA |  |
| Veto Counter |  |