| Param | Original file | Final file |
|---|---|---|
| Filename | modeM0/AS1G07_072T01_9000001452_10091cztM0_level2.evt | modeM0/AS1G07_072T01_9000001452_10091cztM0_level2_quad_clean.evt |
| Size (bytes) | 598,083,840 | 100,684,800 |
| Size | 570.4 MB | 96.0 MB |
| Events in quadrant A | 3,925,850 | 637,909 |
| Events in quadrant B | 4,216,556 | 633,339 |
| Events in quadrant C | 4,066,607 | 628,049 |
| Events in quadrant D | 5,324,563 | 557,283 |
| Mode SS | |||
|---|---|---|---|
| Quadrant | BADHDUFLAG | Total packets | Discarded packets |
| A | 0 | 241 | 69 |
| B | 0 | 238 | 67 |
| C | 0 | 242 | 71 |
| D | 0 | 245 | 77 |
| Mode M0 | |||
|---|---|---|---|
| Quadrant | BADHDUFLAG | Total packets | Discarded packets |
| A | 0 | 24257 | 6523 |
| B | 0 | 25355 | 7198 |
| C | 0 | 24753 | 6479 |
| D | 0 | 31389 | 10147 |
| Mode M9 | |||
|---|---|---|---|
| Quadrant | BADHDUFLAG | Total packets | Discarded packets |
| A | 0 | 20 | 7 |
| B | 0 | 21 | 7 |
| C | 0 | 20 | 7 |
| D | 0 | 24 | 11 |
| Quadrant | Total seconds | Saturated seconds | Saturation percentage |
|---|---|---|---|
| A | 8627 | 48 | 0.556393% |
| B | 8536 | 86 | 1.007498% |
| C | 8632 | 83 | 0.961538% |
| D | 8268 | 182 | 2.201258% |
Noise dominated data is calculated using 1-second bins in cleaned event files. If a bin has >2000 counts, and if more than 50% of those come from <1% of pixels, then it is considered to be noise-dominated and hence unusable.
| Quadrant | # 1 sec bins | Bins with >0 counts | Bins with >2000 counts | High rate bins dominated by noise | Noise dominated (total time) | Noise dominated (detector-on time) | Marked lightcurve |
|---|---|---|---|---|---|---|---|
| A | 13709 | 9940 | 1 | 1 | 0.01% | 0.01% | 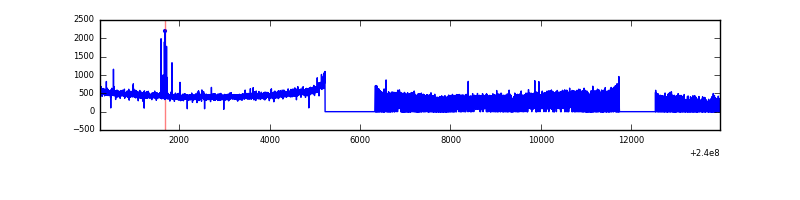 |
| B | 13716 | 9785 | 12 | 12 | 0.09% | 0.12% | 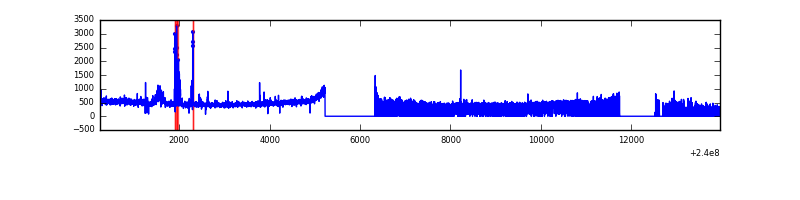 |
| C | 13715 | 9931 | 66 | 66 | 0.48% | 0.66% | 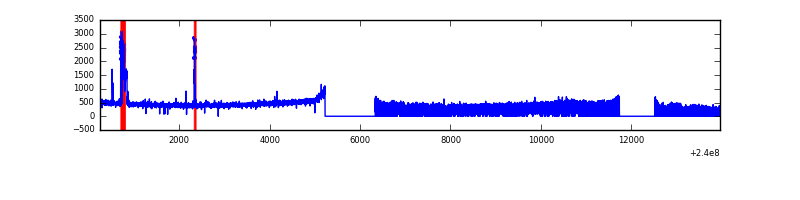 |
| D | 13707 | 9459 | 142 | 142 | 1.04% | 1.50% | 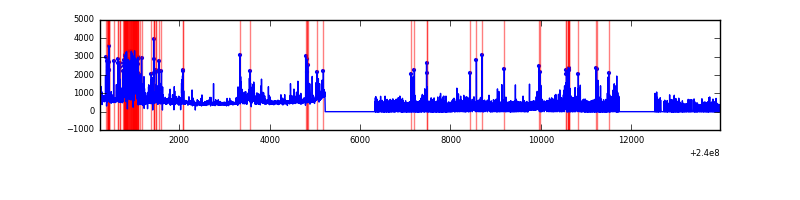 |
Top three noisy pixels from each quadrant. If the there are fewer than three noisy pixels in the level2.evt file, extra rows are filled as -1
| Pixel properties | Quadrant properties | ||||||
|---|---|---|---|---|---|---|---|
| Quadrant | DetID | PixID | Counts | Sigma | Mean | Median | Sigma |
| A | 15 | 174 | 26821 | 126.64 | 1006 | 987 | 204.0 |
| A | 3 | 1 | 12420 | 56.05 | 1006 | 987 | 204.0 |
| A | 0 | 226 | 9209 | 40.31 | 1006 | 987 | 204.0 |
| B | 4 | 174 | 112994 | 583.55 | 1004 | 980 | 192.0 |
| B | 4 | 239 | 81528 | 419.63 | 1004 | 980 | 192.0 |
| B | 4 | 81 | 45081 | 229.75 | 1004 | 980 | 192.0 |
| C | 10 | 22 | 242204 | 1071.07 | 974 | 981 | 225.2 |
| C | 14 | 67 | 12659 | 51.85 | 974 | 981 | 225.2 |
| C | 13 | 61 | 7403 | 28.51 | 974 | 981 | 225.2 |
| D | 2 | 16 | 610373 | 2552.13 | 915 | 893 | 238.8 |
| D | 8 | 195 | 291240 | 1215.8 | 915 | 893 | 238.8 |
| D | 1 | 52 | 226611 | 945.17 | 915 | 893 | 238.8 |
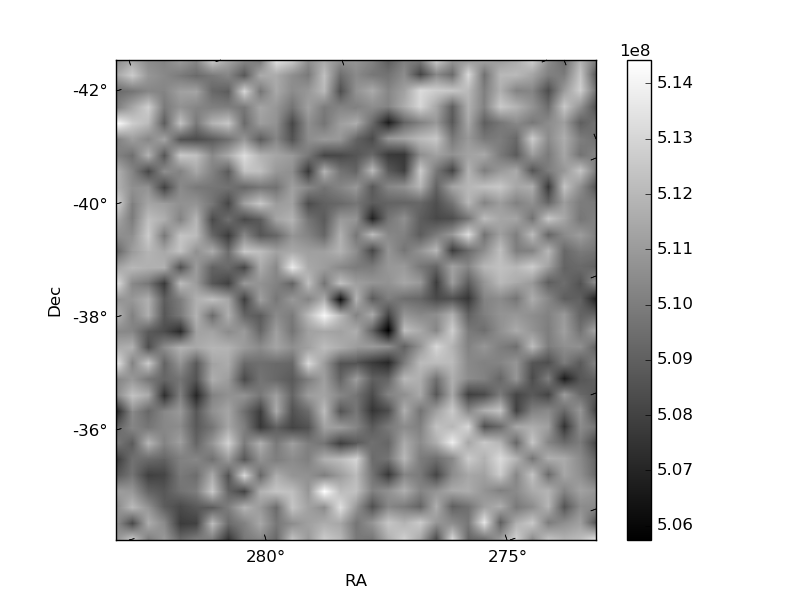
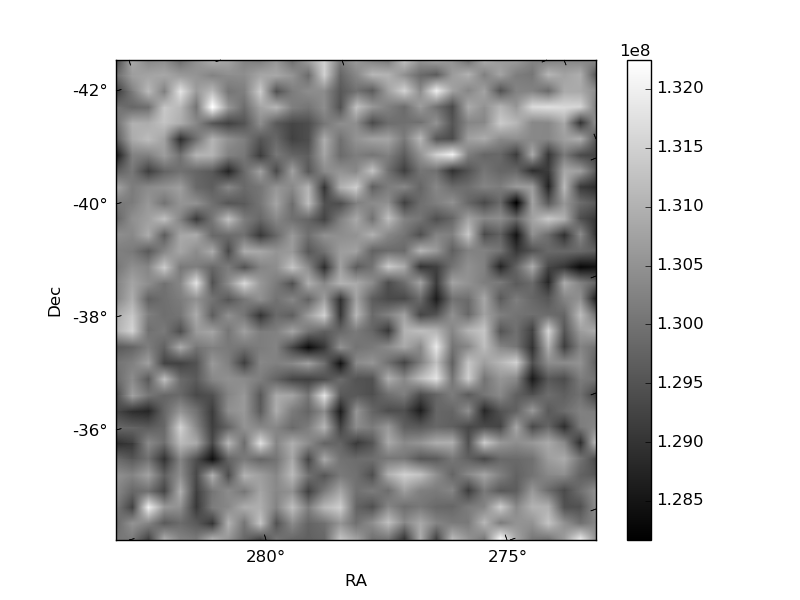
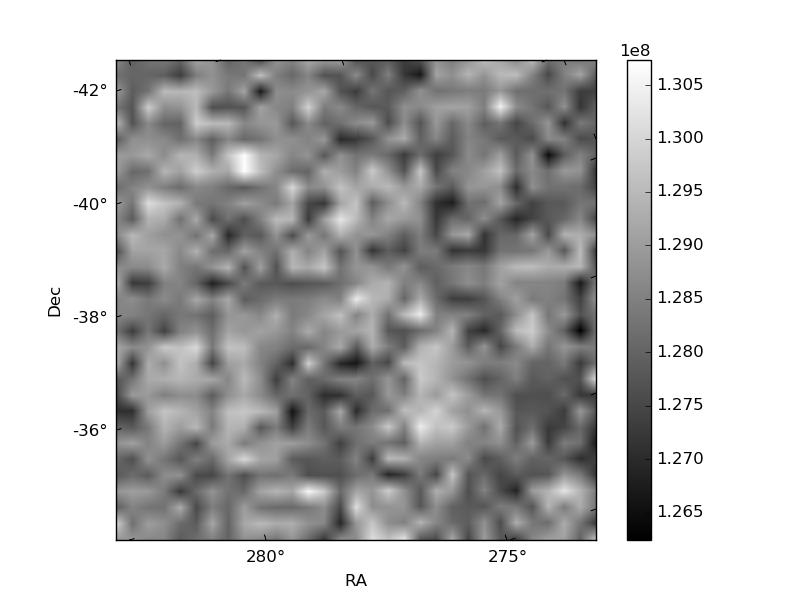
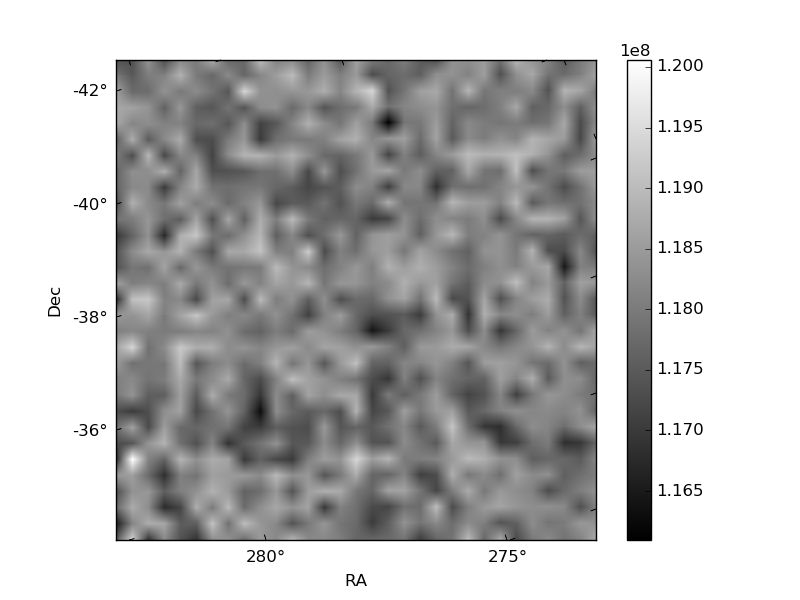
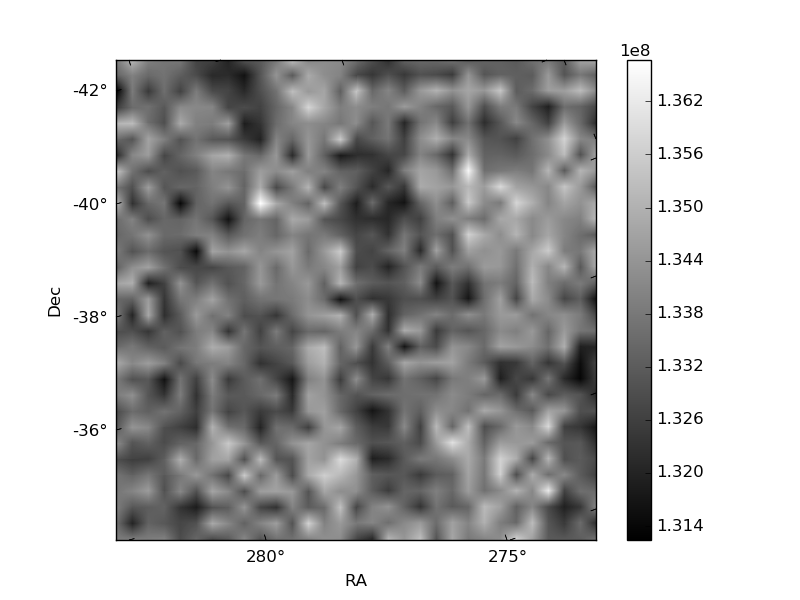
Histogram calculated using DETX and DETY for each event in the final _common_clean file
| Quadrant A | 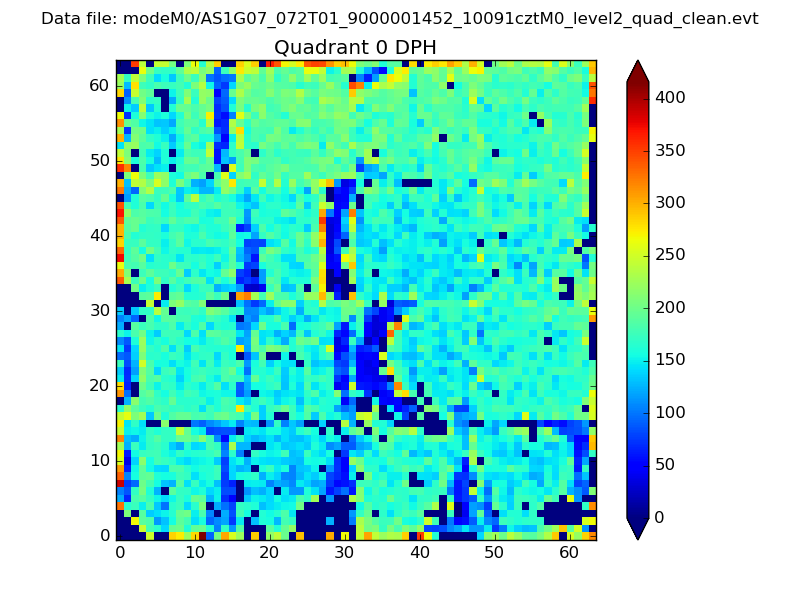 |
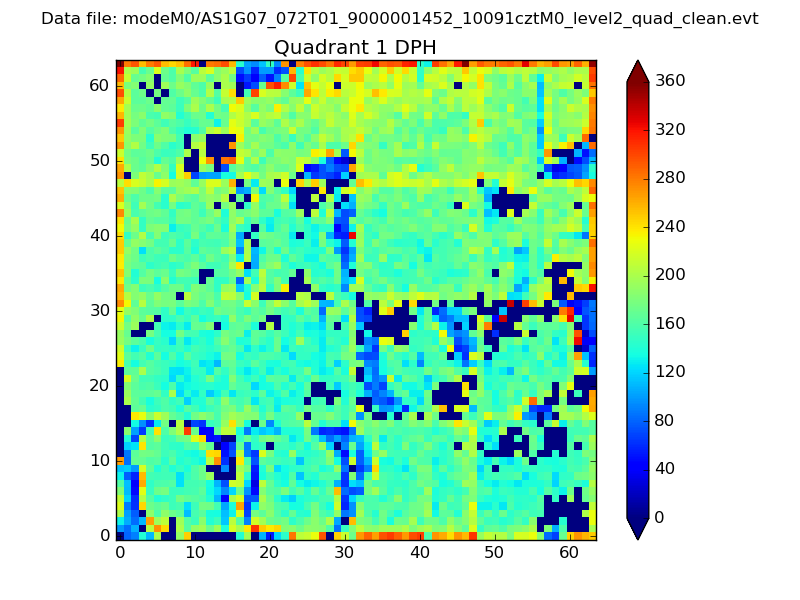 |
Quadrant B |
|---|---|---|---|
| Quadrant D | 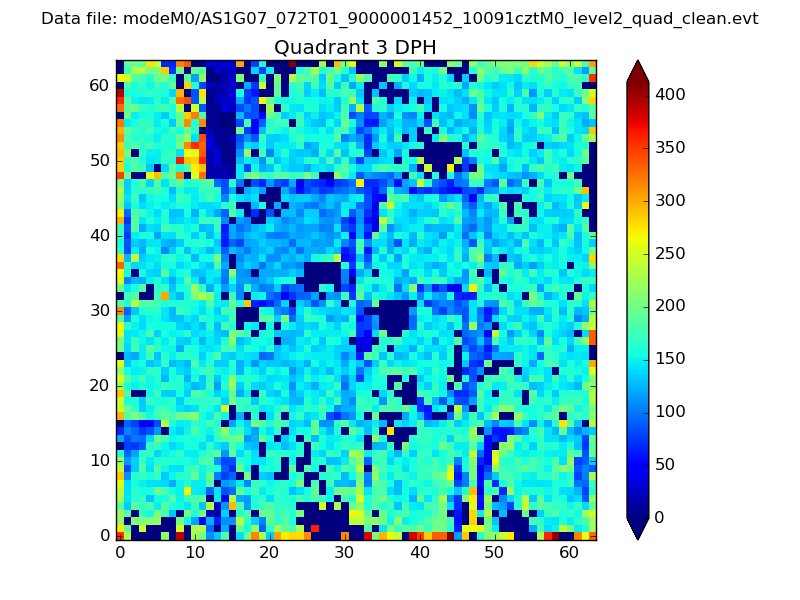 |
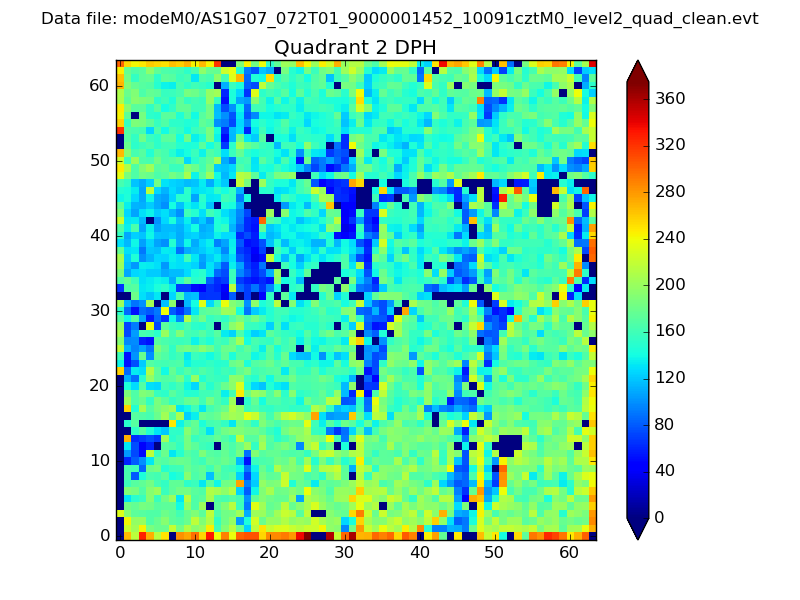 |
Quadrant C |
| Plot type | Count rate plots | Images |
|---|---|---|
| Comparison with Poisson distribution Blue bars denote a histogram of data divided into 1 sec bins. Red curve is a Poisson curve with rate = median count rate of data. |
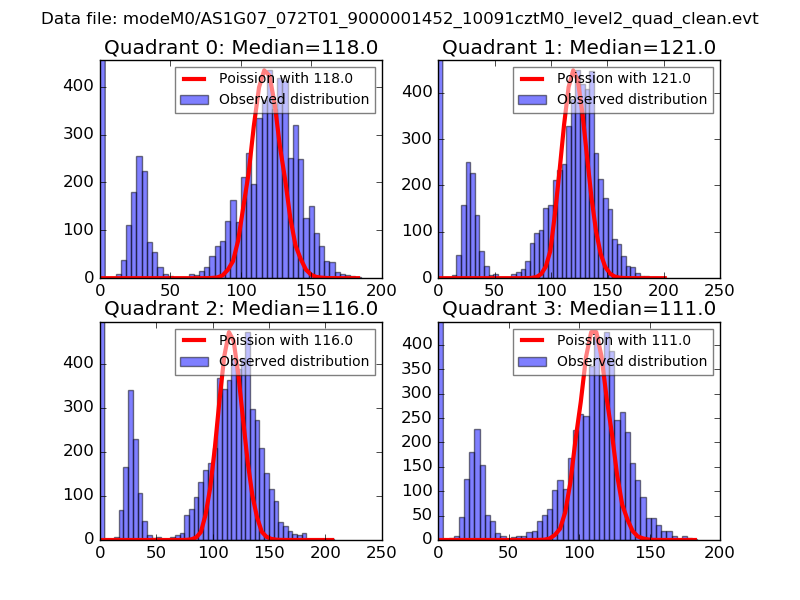 |
 |
| Quadrant-wise count rates Data is divided into 100 sec bins |
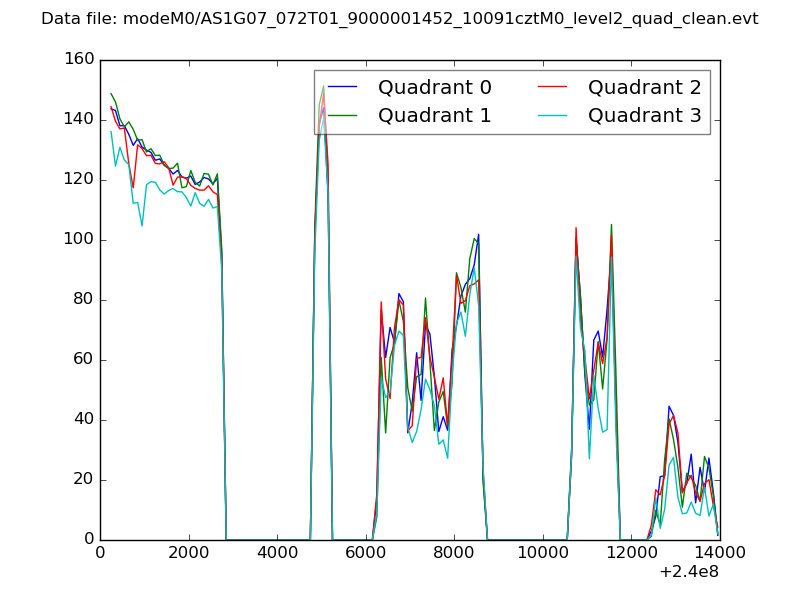 |
|
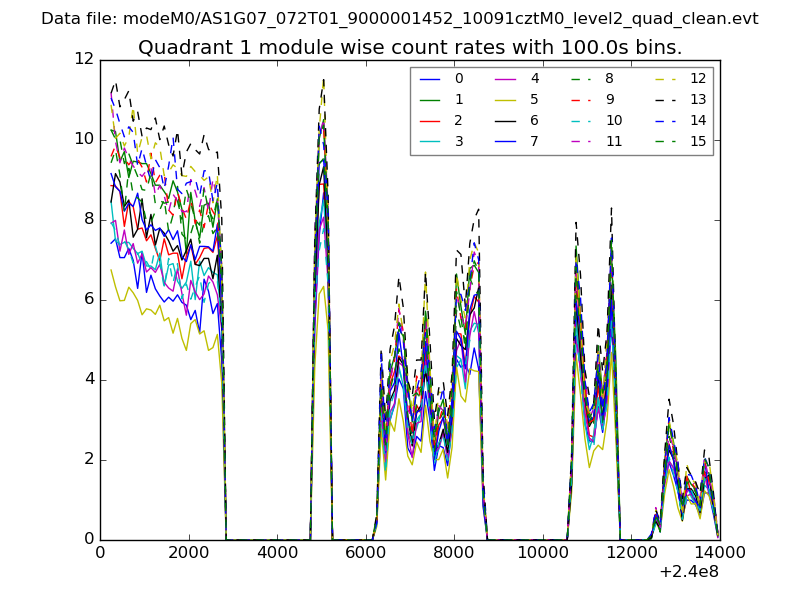
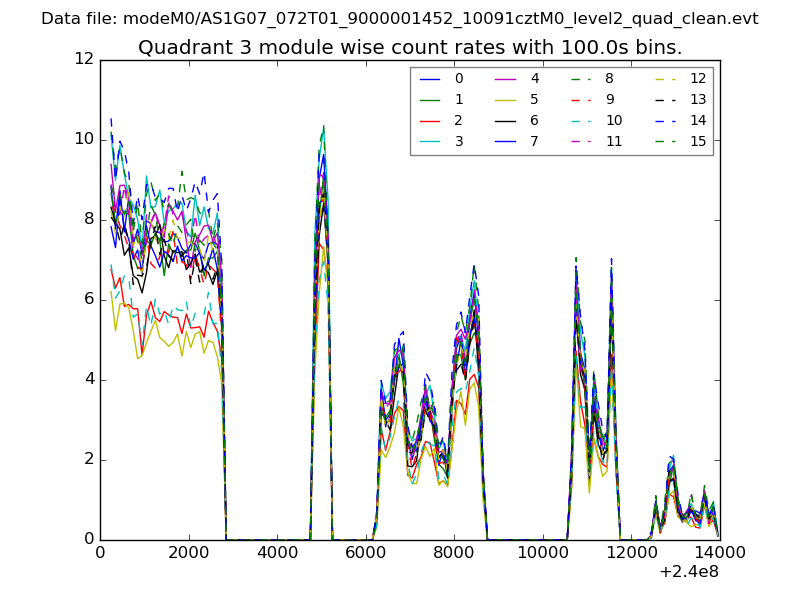
| Module-wise count rates for Quadrant A Data is divided into 100 sec bins |
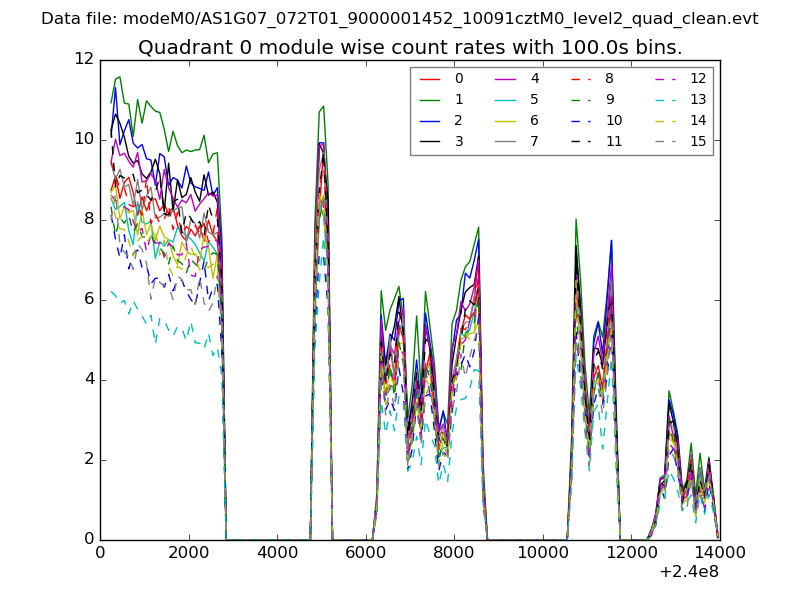 |
 |
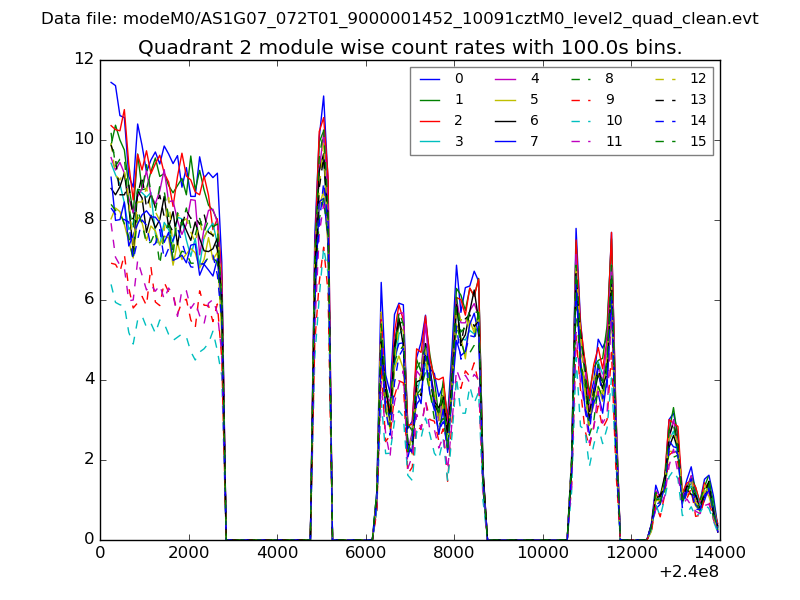
| Module-wise count rates for Quadrant B Data is divided into 100 sec bins |
 |
 |
| Module-wise count rates for Quadrant C Data is divided into 100 sec bins |
 |
 |
| Module-wise count rates for Quadrant D Data is divided into 100 sec bins |
 |
 |
| Parameter | Plot |
|---|---|
| CZT HV Monitor | 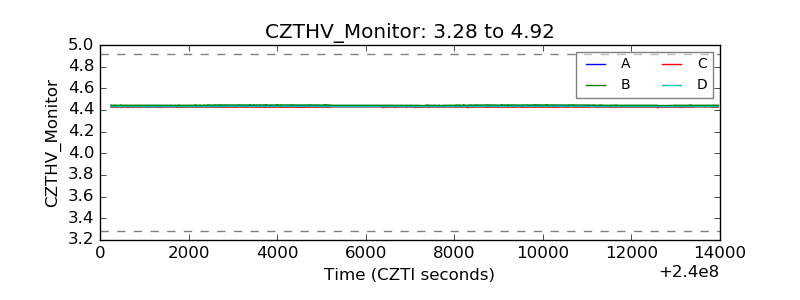 |
| D_VDD | 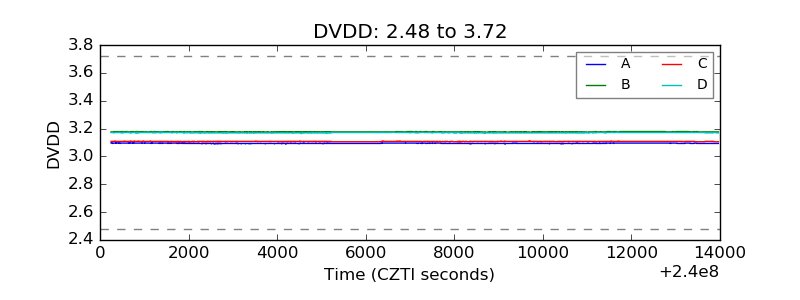 |
| Temperature 1 |  |
| Veto HV Monitor | 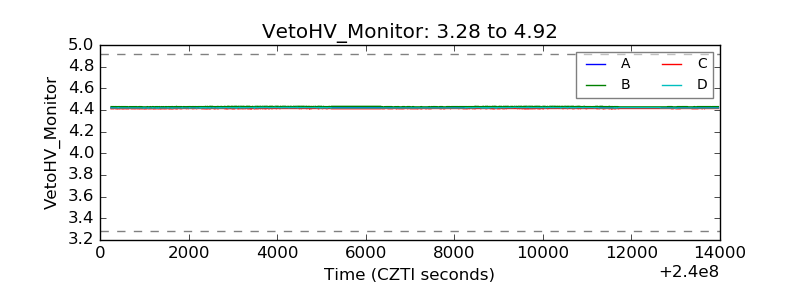 |
| Veto LLD | 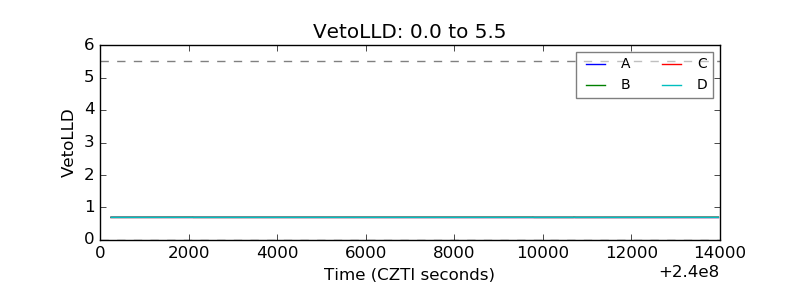 |
| Alpha Counter | 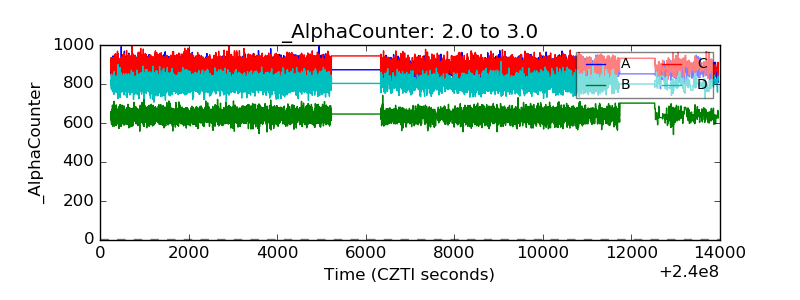 |
| _CPM_Rate | 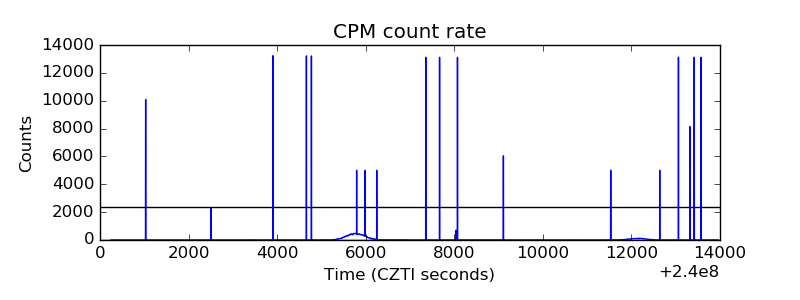 |
| CZT Counter | 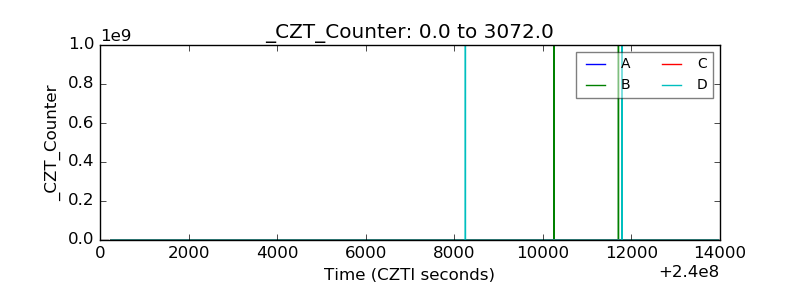 |
| +2.5 Volts monitor |  |
| +5 Volts monitor |  |
| _ROLL_ROT | 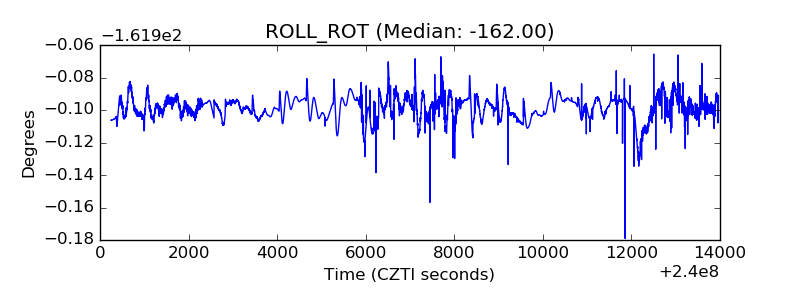 |
| _Roll_DEC | 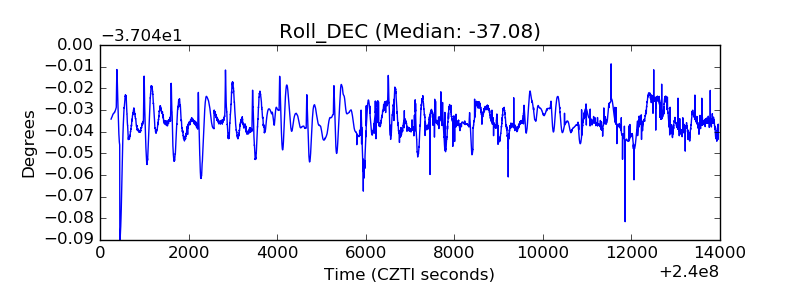 |
| _Roll_RA | 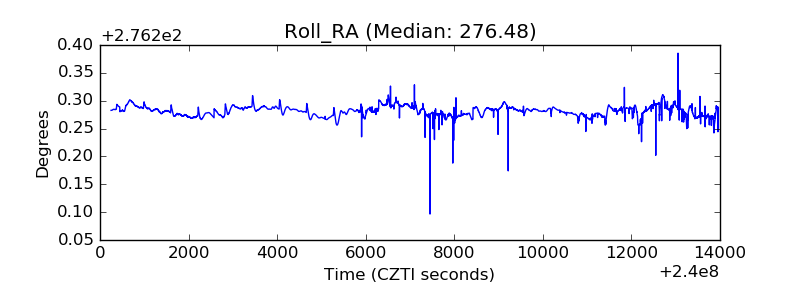 |
| Veto Counter | 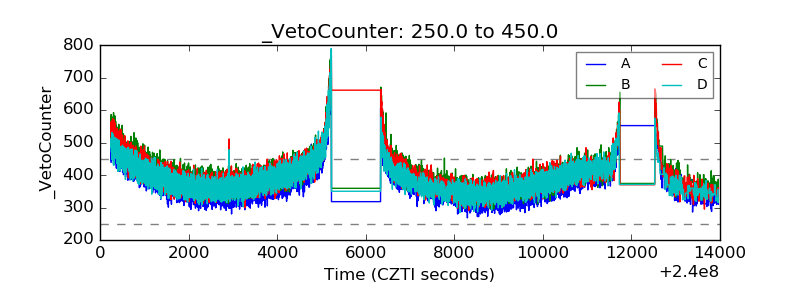 |