| Param | Original file | Final file |
|---|---|---|
| Filename | modeM0/AS1G07_072T01_9000001452_10093cztM0_level2.evt | modeM0/AS1G07_072T01_9000001452_10093cztM0_level2_quad_clean.evt |
| Size (bytes) | 159,212,160 | 30,623,040 |
| Size | 151.8 MB | 29.2 MB |
| Events in quadrant A | 1,066,567 | 204,916 |
| Events in quadrant B | 1,128,694 | 202,715 |
| Events in quadrant C | 1,042,736 | 199,923 |
| Events in quadrant D | 1,422,423 | 151,759 |
| Mode SS | |||
|---|---|---|---|
| Quadrant | BADHDUFLAG | Total packets | Discarded packets |
| A | 0 | 166 | 122 |
| B | 0 | 166 | 116 |
| C | 0 | 163 | 118 |
| D | 0 | 165 | 113 |
| Mode M0 | |||
|---|---|---|---|
| Quadrant | BADHDUFLAG | Total packets | Discarded packets |
| A | 0 | 16546 | 11524 |
| B | 0 | 17361 | 12307 |
| C | 0 | 18435 | 13572 |
| D | 0 | 23739 | 18224 |
| Mode M9 | |||
|---|---|---|---|
| Quadrant | BADHDUFLAG | Total packets | Discarded packets |
| A | 0 | 9 | 2 |
| B | 0 | 9 | 2 |
| C | 0 | 9 | 5 |
| D | 0 | 9 | 3 |
| Quadrant | Total seconds | Saturated seconds | Saturation percentage |
|---|---|---|---|
| A | 2481 | 7 | 0.282144% |
| B | 2452 | 17 | 0.693312% |
| C | 2386 | 6 | 0.251467% |
| D | 1925 | 38 | 1.974026% |
Noise dominated data is calculated using 1-second bins in cleaned event files. If a bin has >2000 counts, and if more than 50% of those come from <1% of pixels, then it is considered to be noise-dominated and hence unusable.
| Quadrant | # 1 sec bins | Bins with >0 counts | Bins with >2000 counts | High rate bins dominated by noise | Noise dominated (total time) | Noise dominated (detector-on time) | Marked lightcurve |
|---|---|---|---|---|---|---|---|
| A | 9050 | 3556 | 0 | 0 | 0.00% | 0.00% | 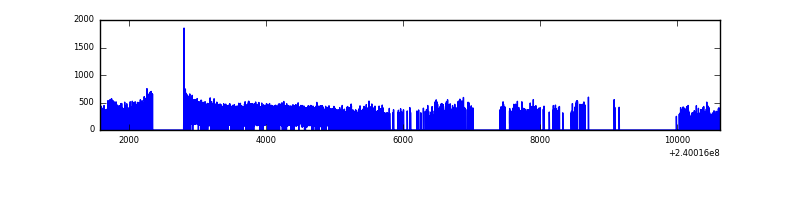 |
| B | 9035 | 3498 | 0 | 0 | 0.00% | 0.00% | 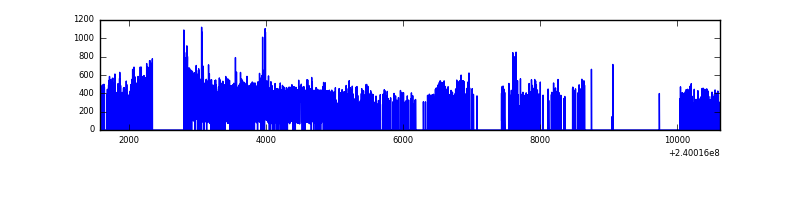 |
| C | 9050 | 3400 | 0 | 0 | 0.00% | 0.00% | 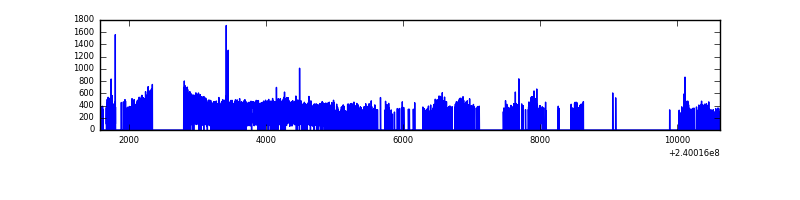 |
| D | 9055 | 2899 | 26 | 26 | 0.29% | 0.90% | 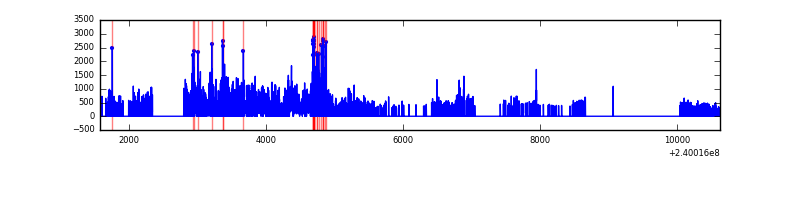 |
Top three noisy pixels from each quadrant. If the there are fewer than three noisy pixels in the level2.evt file, extra rows are filled as -1
| Pixel properties | Quadrant properties | ||||||
|---|---|---|---|---|---|---|---|
| Quadrant | DetID | PixID | Counts | Sigma | Mean | Median | Sigma |
| A | 8 | 15 | 3977 | 63.2 | 275 | 268 | 58.7 |
| A | 0 | 226 | 2587 | 39.52 | 275 | 268 | 58.7 |
| A | 12 | 194 | 2235 | 33.52 | 275 | 268 | 58.7 |
| B | 4 | 174 | 17049 | 309.22 | 275 | 269 | 54.3 |
| B | 0 | 214 | 11223 | 201.86 | 275 | 269 | 54.3 |
| B | 0 | 219 | 8865 | 158.4 | 275 | 269 | 54.3 |
| C | 10 | 22 | 29120 | 466.32 | 257 | 258 | 61.9 |
| C | 14 | 234 | 4871 | 74.53 | 257 | 258 | 61.9 |
| C | 14 | 67 | 2176 | 30.99 | 257 | 258 | 61.9 |
| D | 10 | 157 | 264714 | 5079.41 | 202 | 195 | 52.1 |
| D | 1 | 52 | 196995 | 3779.04 | 202 | 195 | 52.1 |
| D | 7 | 71 | 53411 | 1021.88 | 202 | 195 | 52.1 |
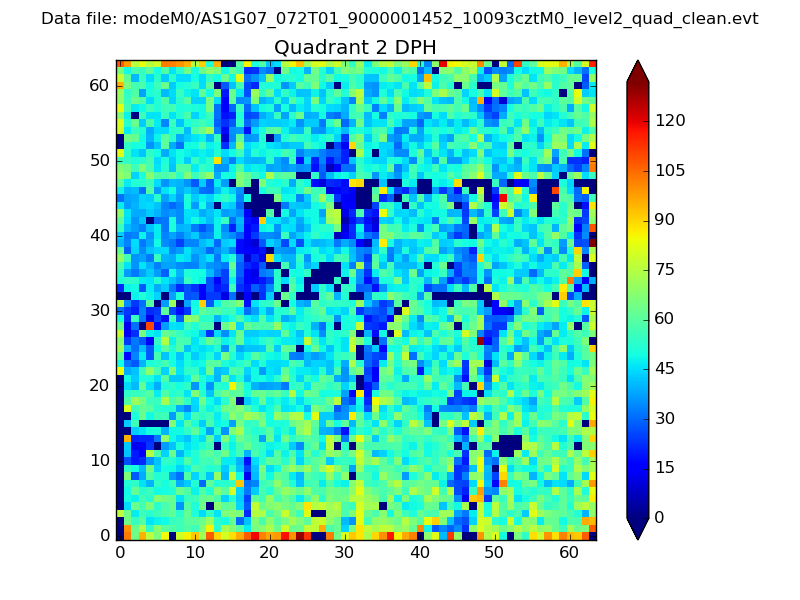
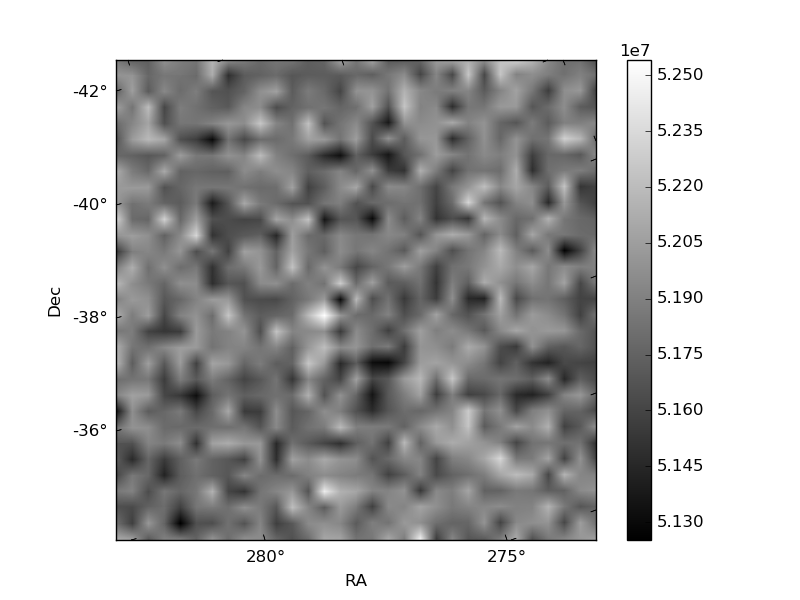
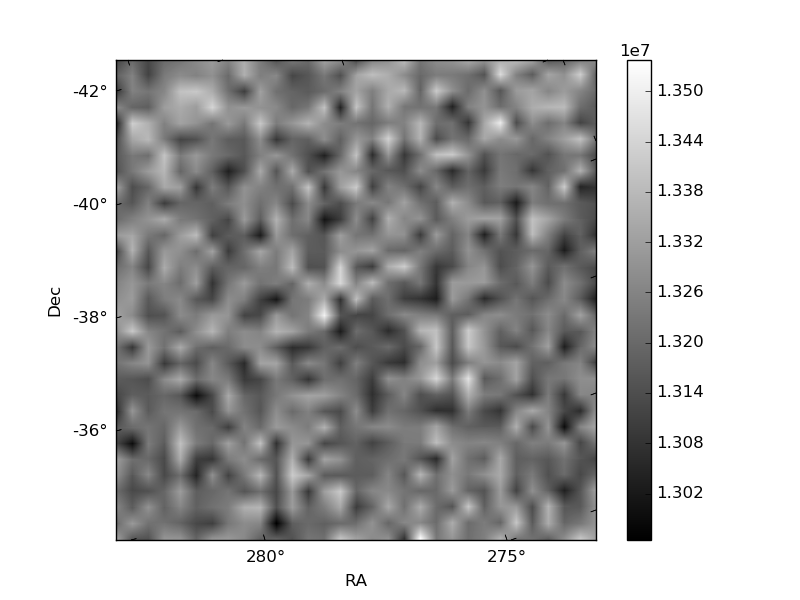
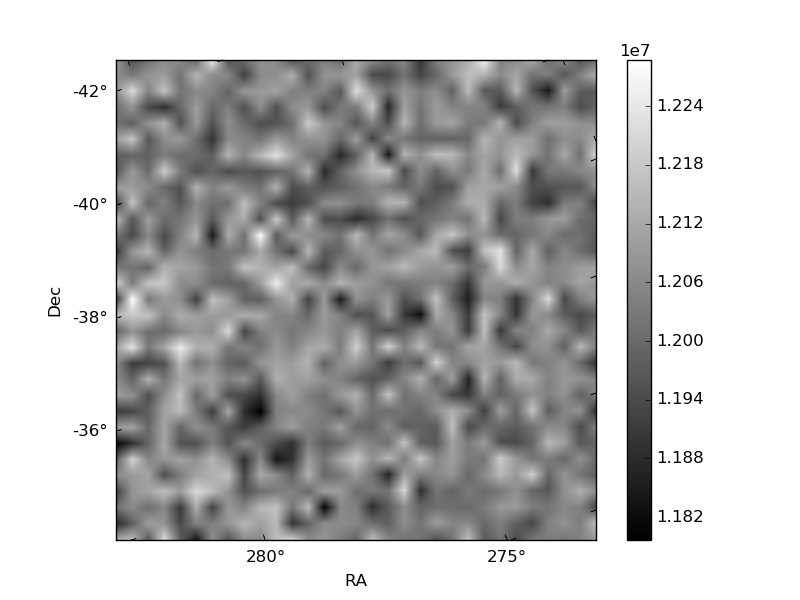
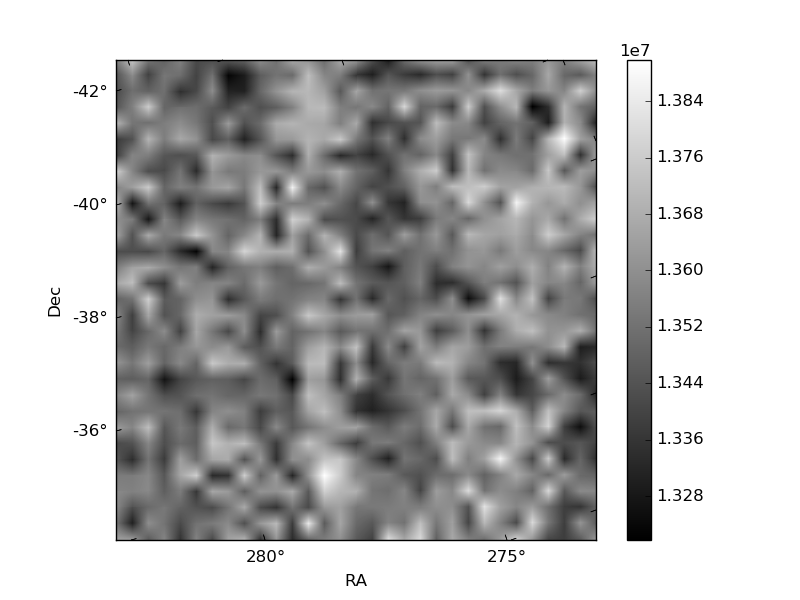
Histogram calculated using DETX and DETY for each event in the final _common_clean file
| Quadrant A | 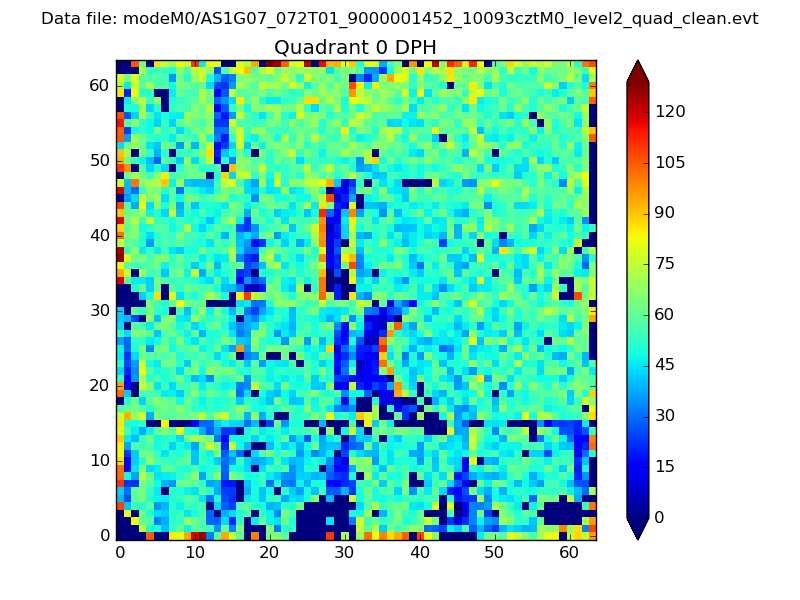 |
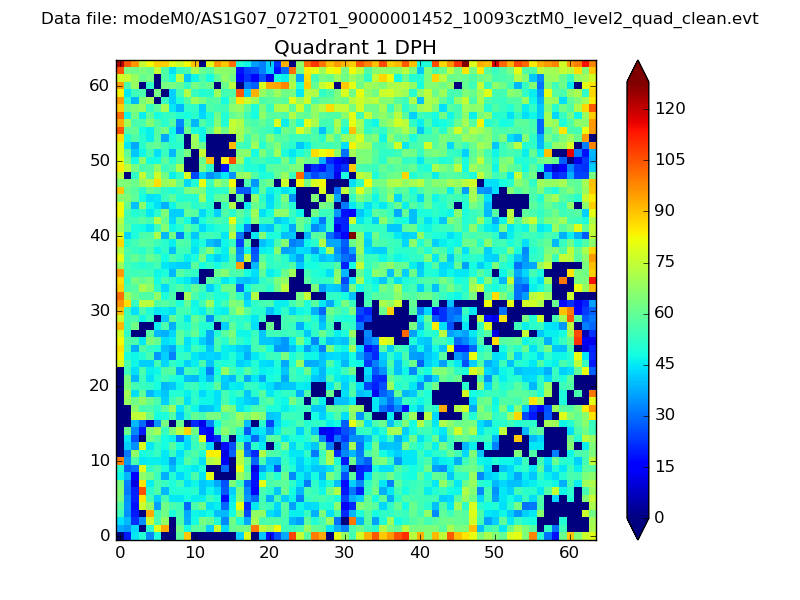 |
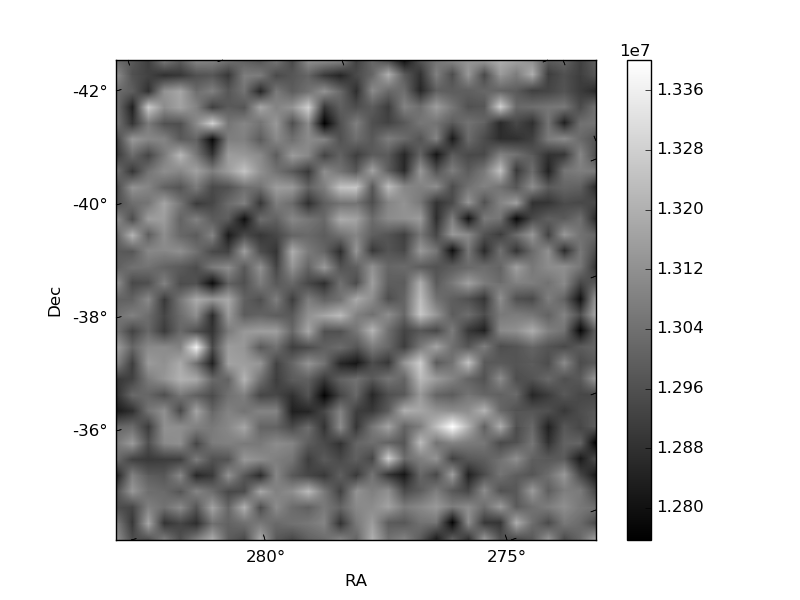
Quadrant B |
|---|---|---|---|
| Quadrant D | 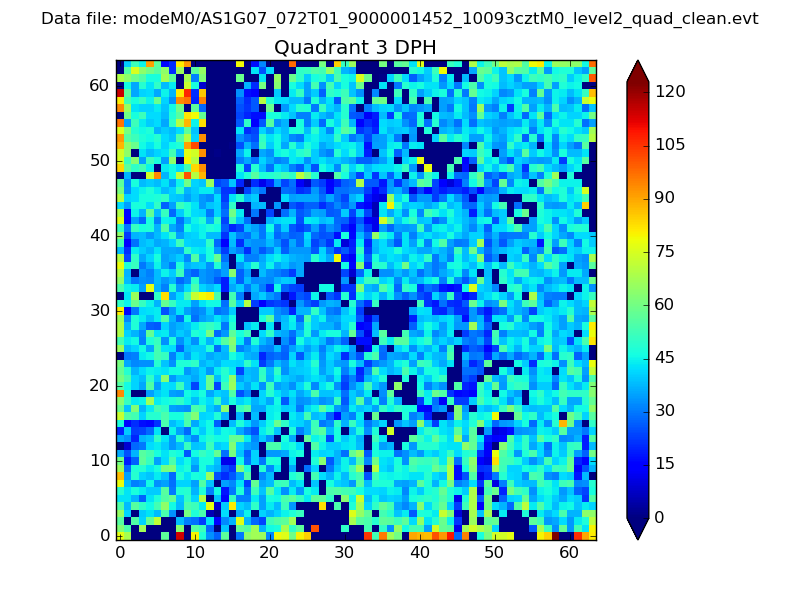 |
 |
Quadrant C |
| Plot type | Count rate plots | Images |
|---|---|---|
| Comparison with Poisson distribution Blue bars denote a histogram of data divided into 1 sec bins. Red curve is a Poisson curve with rate = median count rate of data. |
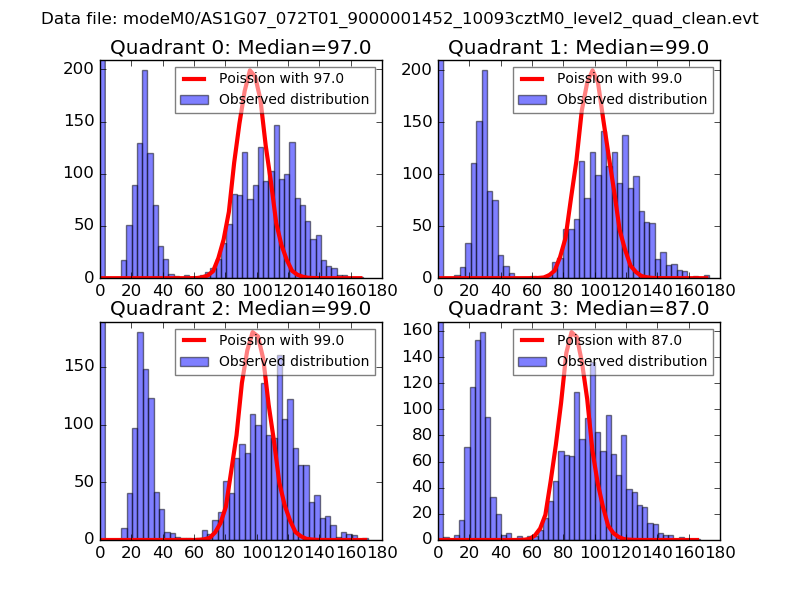 |
 |
| Quadrant-wise count rates Data is divided into 100 sec bins |
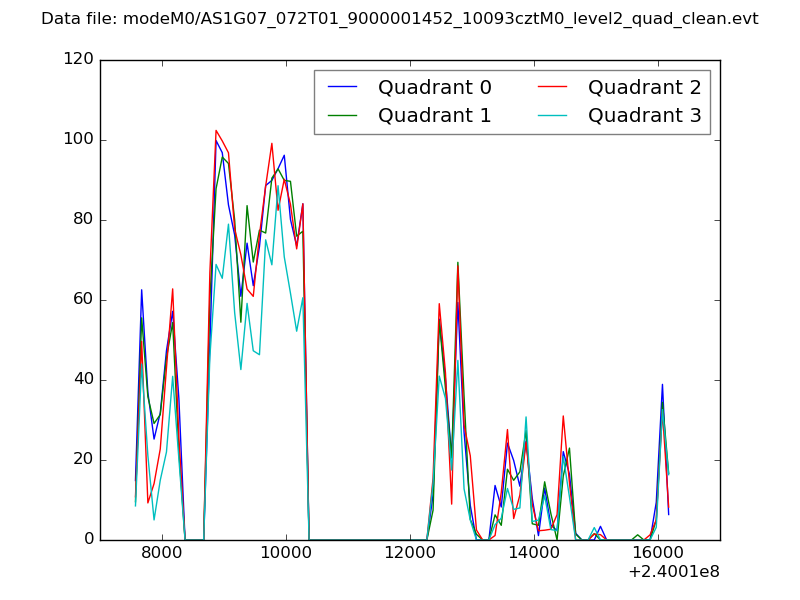 |
|
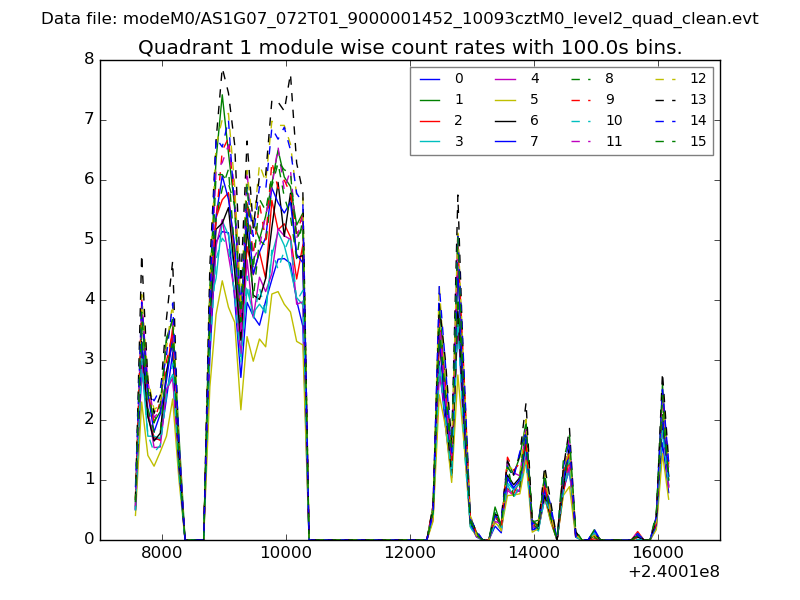
| Module-wise count rates for Quadrant A Data is divided into 100 sec bins |
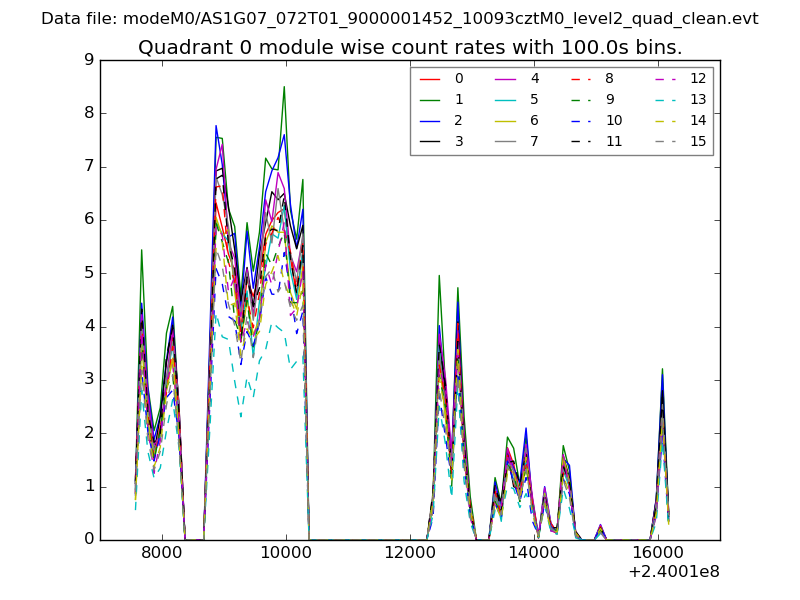 |
 |
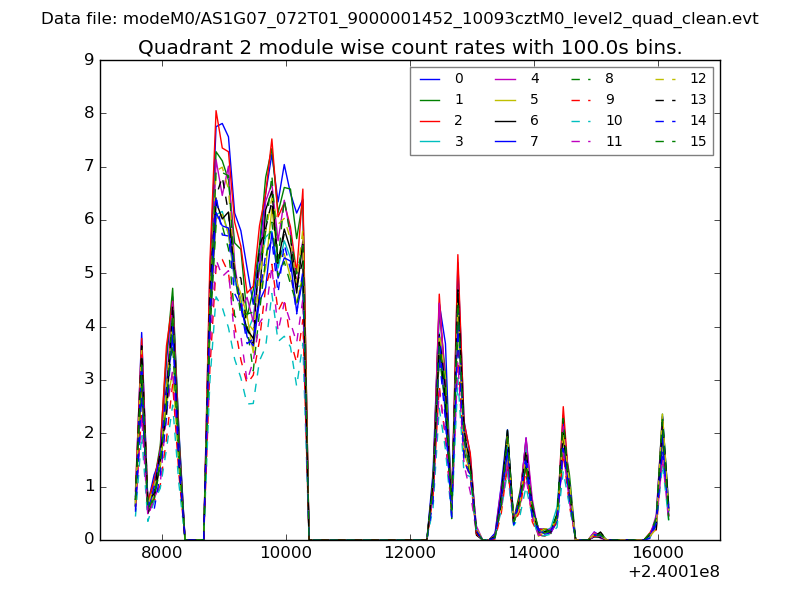
| Module-wise count rates for Quadrant B Data is divided into 100 sec bins |
 |
 |
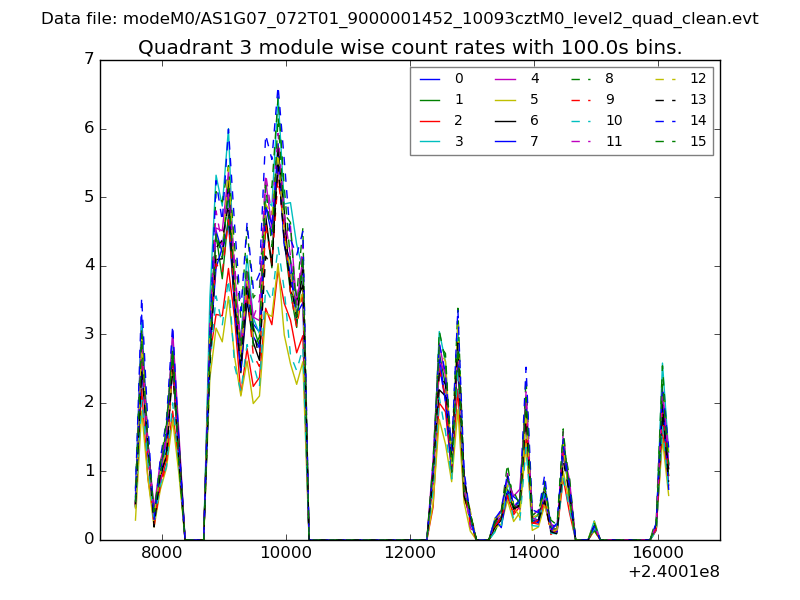
| Module-wise count rates for Quadrant C Data is divided into 100 sec bins |
 |
 |
| Module-wise count rates for Quadrant D Data is divided into 100 sec bins |
 |
 |
| Parameter | Plot |
|---|---|
| CZT HV Monitor | 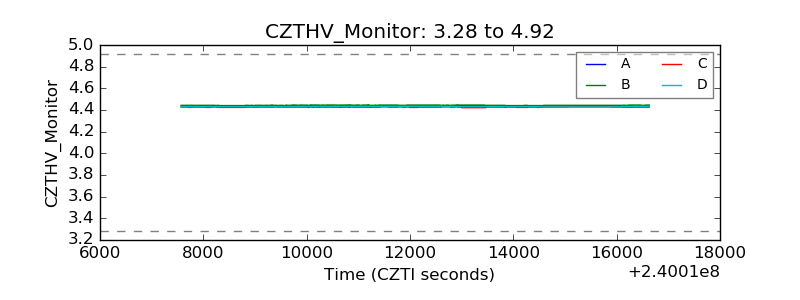 |
| D_VDD | 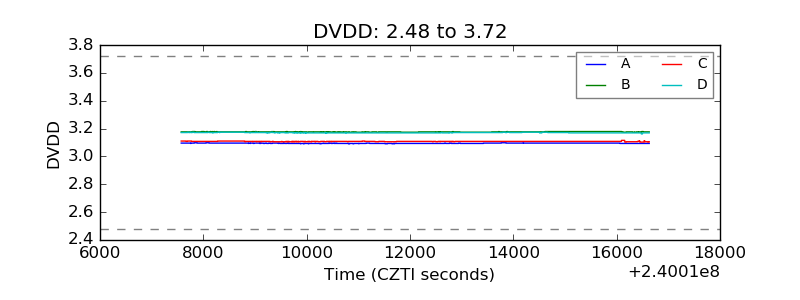 |
| Temperature 1 | 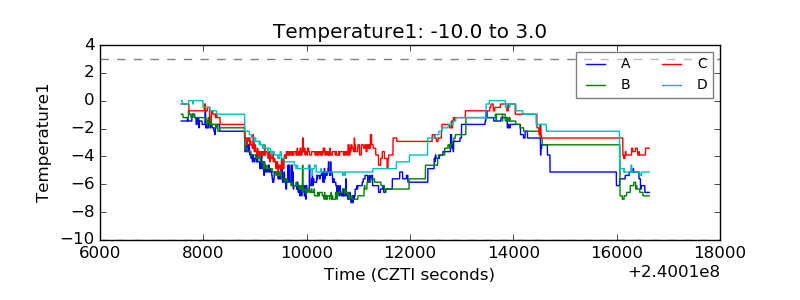 |
| Veto HV Monitor | 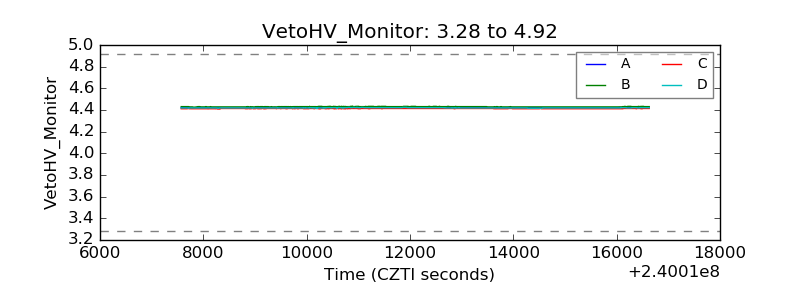 |
| Veto LLD | 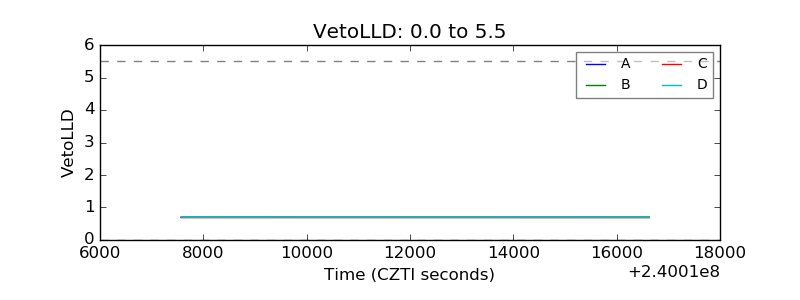 |
| Alpha Counter | 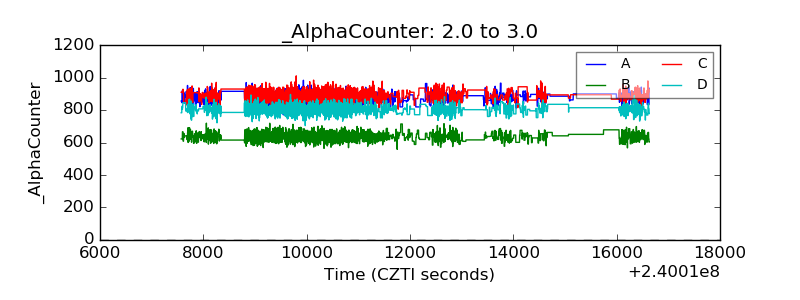 |
| _CPM_Rate | 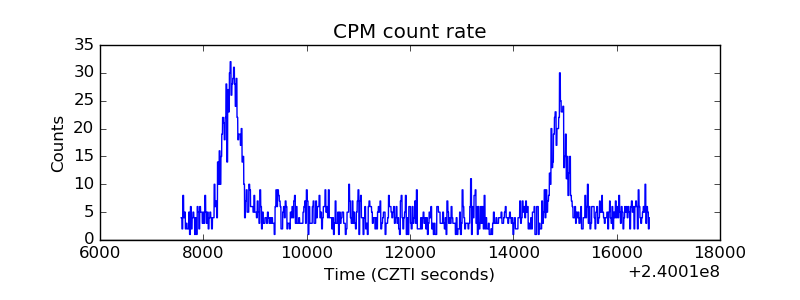 |
| CZT Counter | 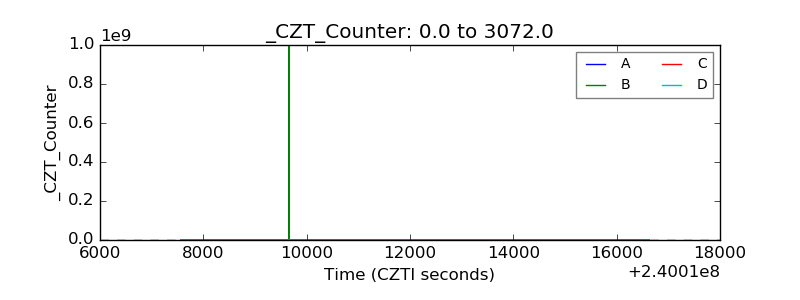 |
| +2.5 Volts monitor |  |
| +5 Volts monitor |  |
| _ROLL_ROT | 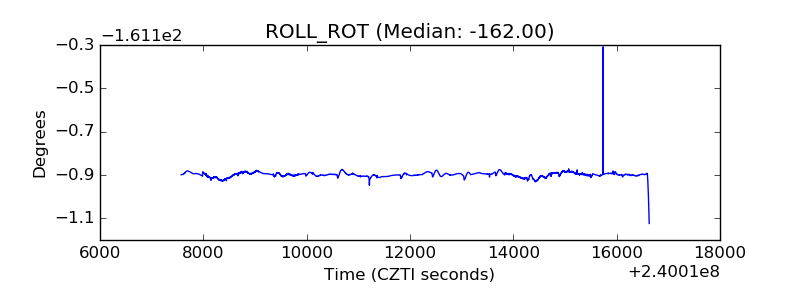 |
| _Roll_DEC | 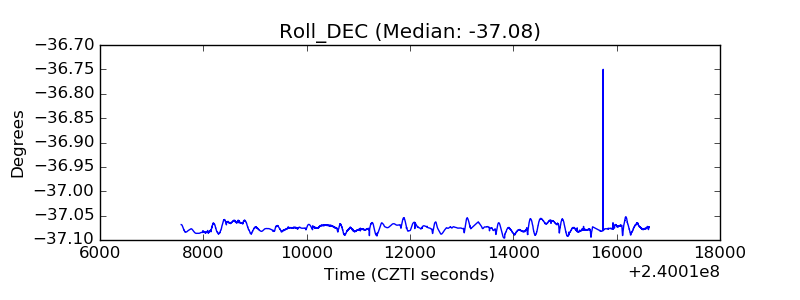 |
| _Roll_RA | 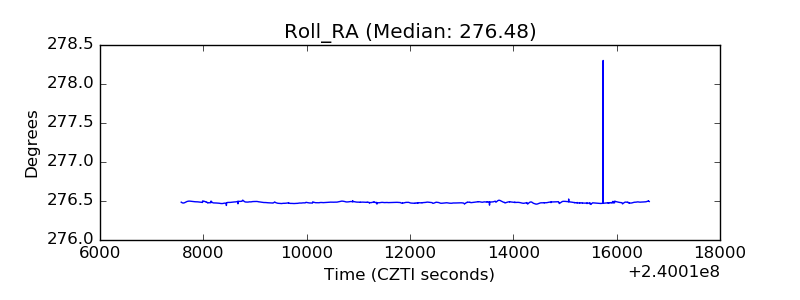 |
| Veto Counter | 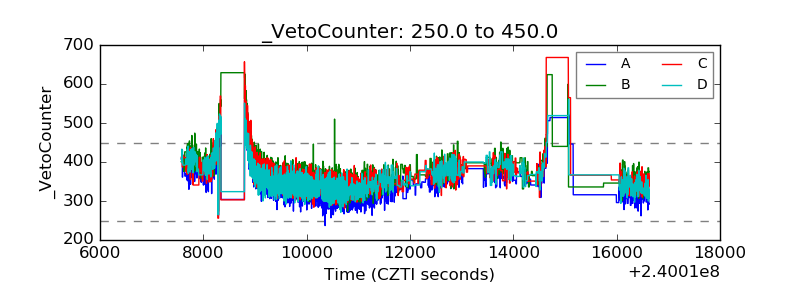 |