| Param | Original file | Final file |
|---|---|---|
| Filename | modeM0/AS1G07_072T01_9000001452_10094cztM0_level2.evt | modeM0/AS1G07_072T01_9000001452_10094cztM0_level2_quad_clean.evt |
| Size (bytes) | 35,225,280 | 8,196,480 |
| Size | 33.6 MB | 7.8 MB |
| Events in quadrant A | 256,129 | 56,819 |
| Events in quadrant B | 262,272 | 51,488 |
| Events in quadrant C | 236,707 | 49,309 |
| Events in quadrant D | 272,327 | 45,456 |
| Mode SS | |||
|---|---|---|---|
| Quadrant | BADHDUFLAG | Total packets | Discarded packets |
| A | 0 | 53 | 37 |
| B | 0 | 51 | 39 |
| C | 0 | 53 | 39 |
| D | 0 | 54 | 42 |
| Mode M0 | |||
|---|---|---|---|
| Quadrant | BADHDUFLAG | Total packets | Discarded packets |
| A | 0 | 5343 | 4213 |
| B | 0 | 5602 | 4495 |
| C | 0 | 6010 | 4961 |
| D | 0 | 6517 | 5399 |
| Mode M9 | |||
|---|---|---|---|
| Quadrant | BADHDUFLAG | Total packets | Discarded packets |
| A | 0 | 3 | 1 |
| B | 0 | 3 | 1 |
| C | 0 | 4 | 2 |
| D | 0 | 3 | 2 |
| Quadrant | Total seconds | Saturated seconds | Saturation percentage |
|---|---|---|---|
| A | 542 | 3 | 0.553506% |
| B | 517 | 7 | 1.353965% |
| C | 493 | 7 | 1.419878% |
| D | 494 | 1 | 0.202429% |
Noise dominated data is calculated using 1-second bins in cleaned event files. If a bin has >2000 counts, and if more than 50% of those come from <1% of pixels, then it is considered to be noise-dominated and hence unusable.
| Quadrant | # 1 sec bins | Bins with >0 counts | Bins with >2000 counts | High rate bins dominated by noise | Noise dominated (total time) | Noise dominated (detector-on time) | Marked lightcurve |
|---|---|---|---|---|---|---|---|
| A | 2716 | 880 | 0 | 0 | 0.00% | 0.00% | 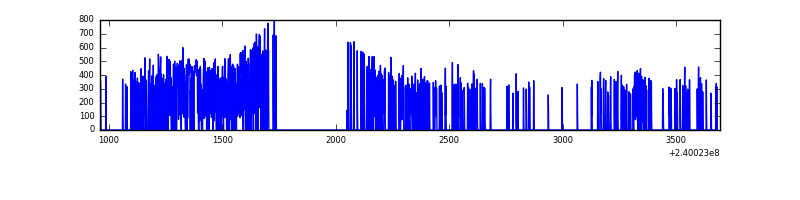 |
| B | 2697 | 828 | 0 | 0 | 0.00% | 0.00% | 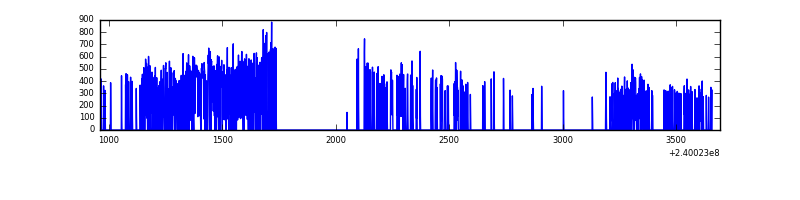 |
| C | 2699 | 773 | 0 | 0 | 0.00% | 0.00% | 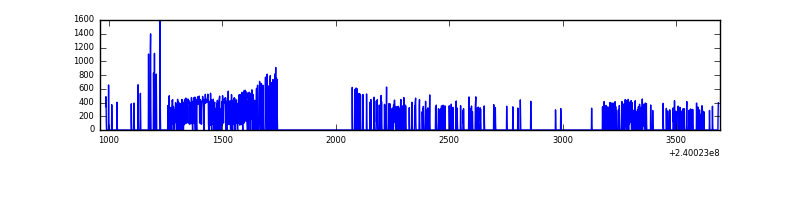 |
| D | 2710 | 779 | 0 | 0 | 0.00% | 0.00% | 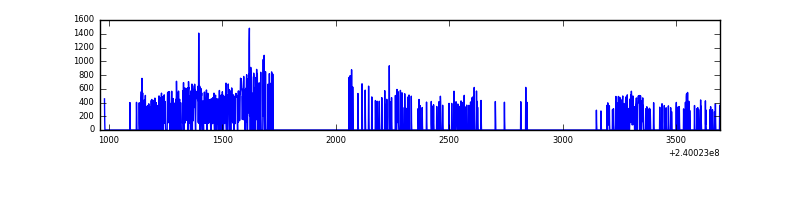 |
Top three noisy pixels from each quadrant. If the there are fewer than three noisy pixels in the level2.evt file, extra rows are filled as -1
| Pixel properties | Quadrant properties | ||||||
|---|---|---|---|---|---|---|---|
| Quadrant | DetID | PixID | Counts | Sigma | Mean | Median | Sigma |
| A | 0 | 226 | 591 | 32.65 | 66 | 64 | 16.1 |
| A | 12 | 194 | 557 | 30.54 | 66 | 64 | 16.1 |
| A | 8 | 15 | 432 | 22.8 | 66 | 64 | 16.1 |
| B | 4 | 174 | 6744 | 460.21 | 62 | 61 | 14.5 |
| B | 4 | 81 | 3604 | 243.98 | 62 | 61 | 14.5 |
| B | 0 | 189 | 2286 | 153.22 | 62 | 61 | 14.5 |
| C | 10 | 22 | 9170 | 588.76 | 57 | 57 | 15.5 |
| C | 8 | 128 | 545 | 31.53 | 57 | 57 | 15.5 |
| C | 13 | 61 | 447 | 25.2 | 57 | 57 | 15.5 |
| D | 8 | 195 | 18864 | 1177.74 | 56 | 54 | 16.0 |
| D | 2 | 16 | 10006 | 623.12 | 56 | 54 | 16.0 |
| D | 2 | 152 | 9184 | 571.65 | 56 | 54 | 16.0 |
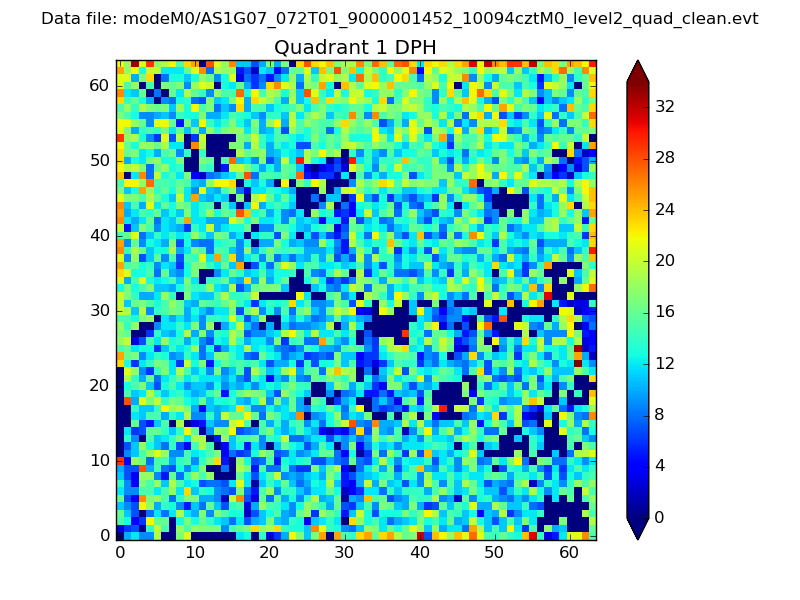
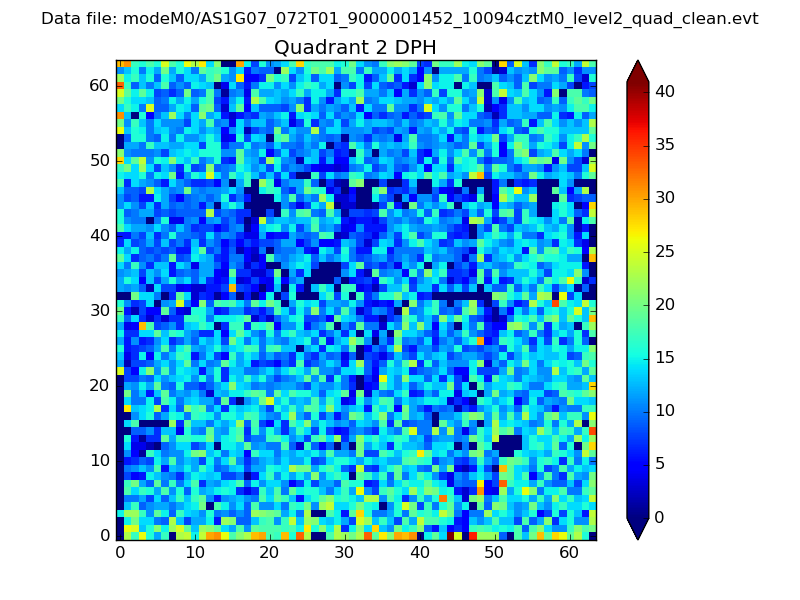
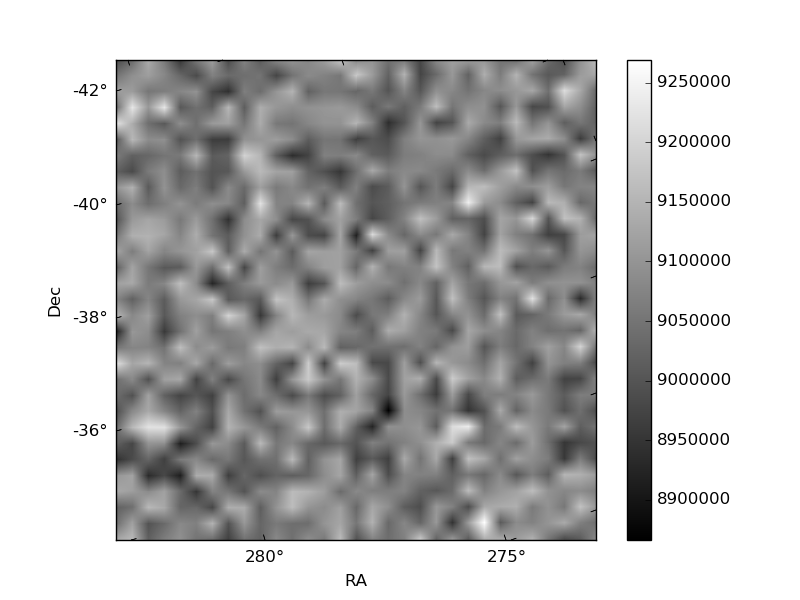
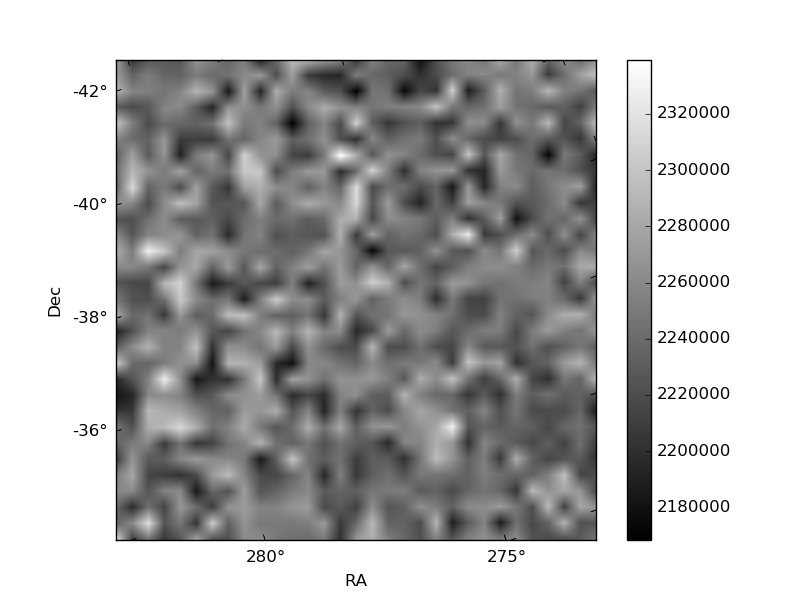
Histogram calculated using DETX and DETY for each event in the final _common_clean file
| Quadrant A |  |
 |
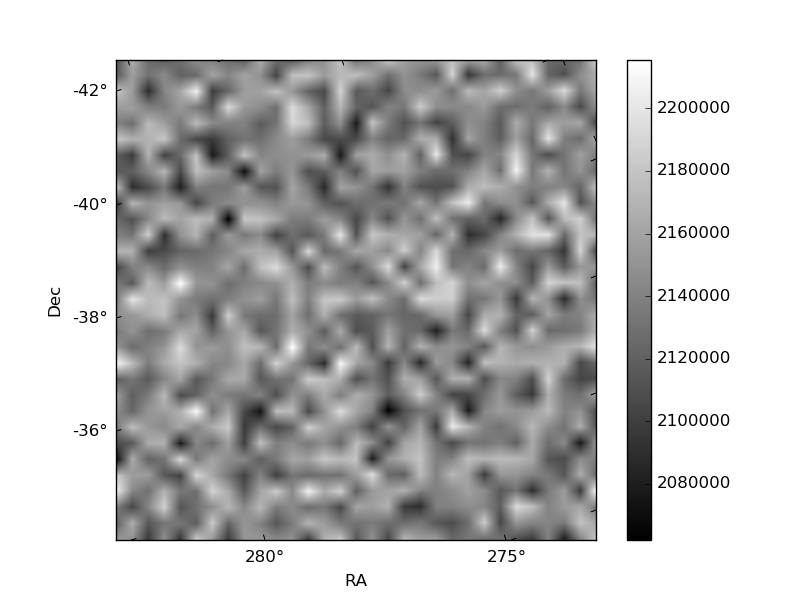
Quadrant B |
|---|---|---|---|
| Quadrant D | 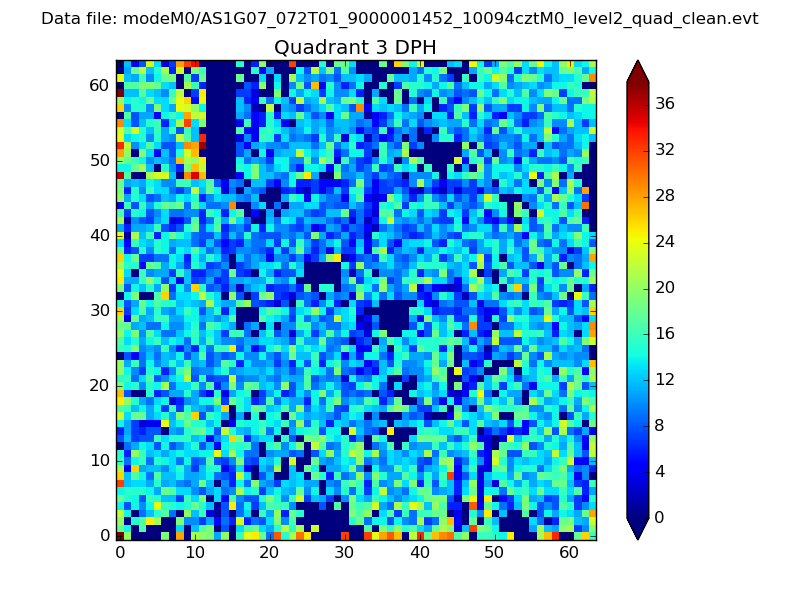 |
 |
Quadrant C |
| Plot type | Count rate plots | Images |
|---|---|---|
| Comparison with Poisson distribution Blue bars denote a histogram of data divided into 1 sec bins. Red curve is a Poisson curve with rate = median count rate of data. |
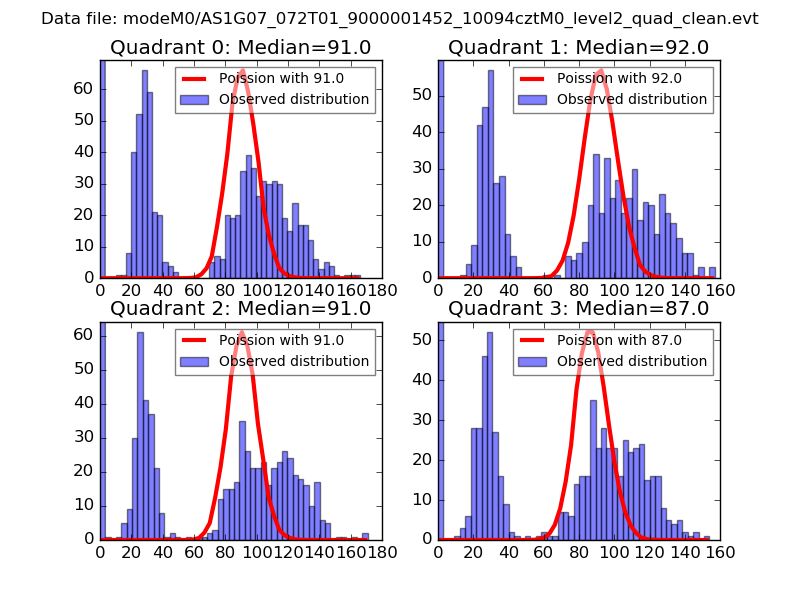 |
 |
| Quadrant-wise count rates Data is divided into 100 sec bins |
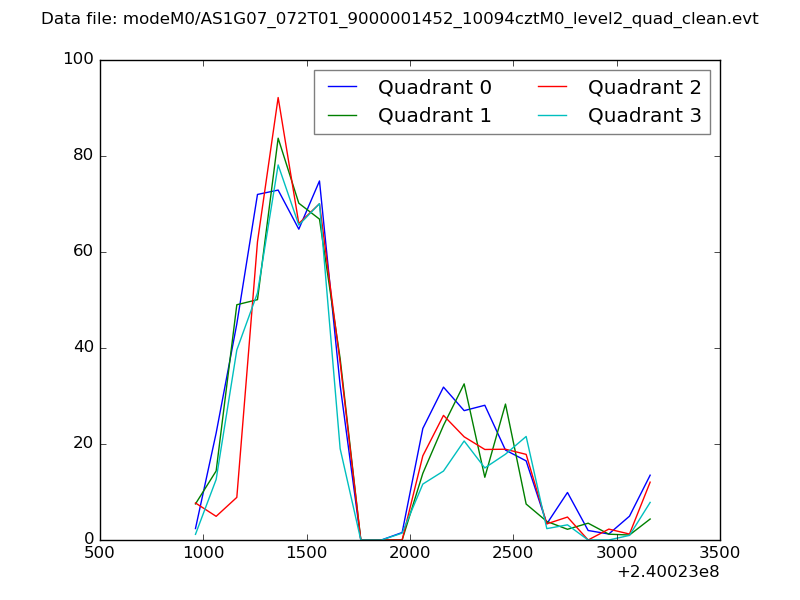 |
|
| Module-wise count rates for Quadrant A Data is divided into 100 sec bins |
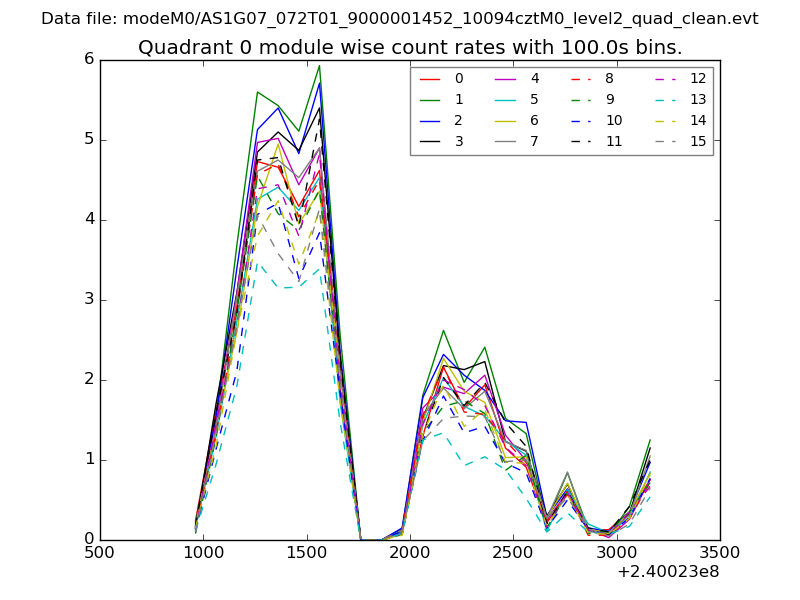 |
 |
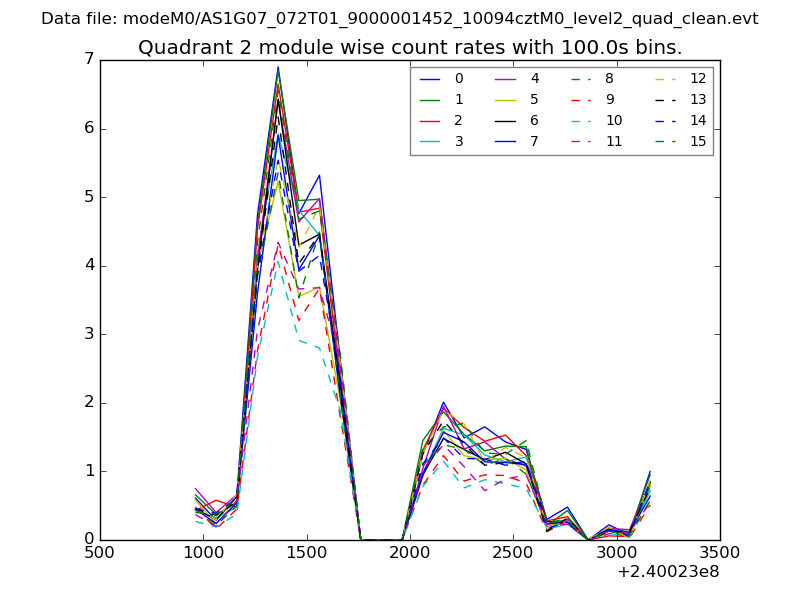
| Module-wise count rates for Quadrant B Data is divided into 100 sec bins |
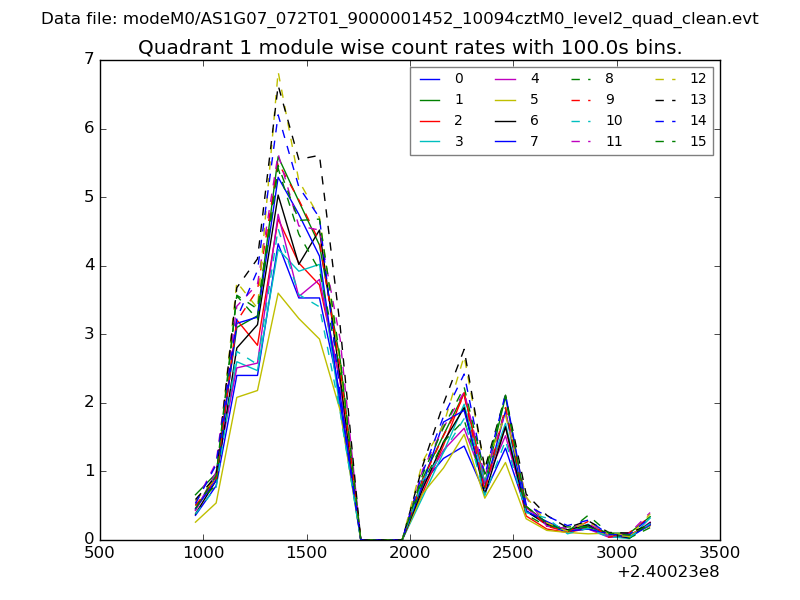 |
 |
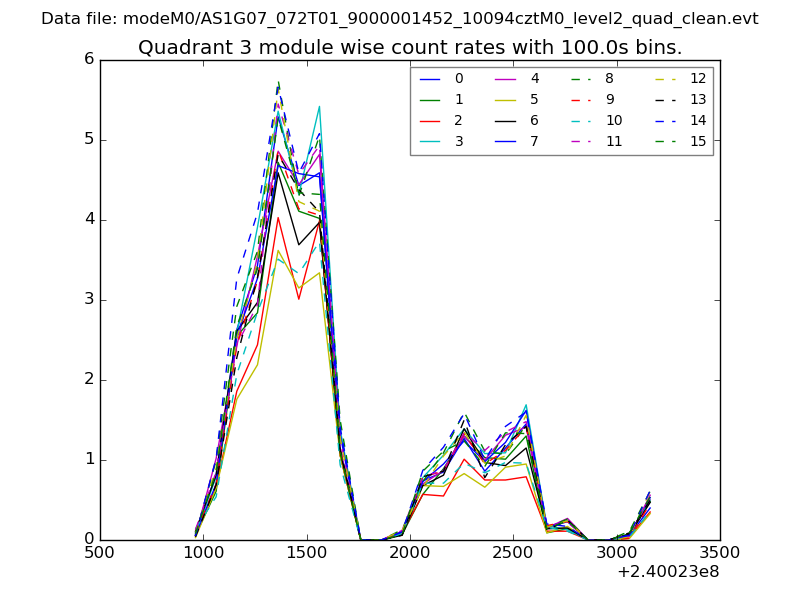
| Module-wise count rates for Quadrant C Data is divided into 100 sec bins |
 |
 |
| Module-wise count rates for Quadrant D Data is divided into 100 sec bins |
 |
 |
| Parameter | Plot |
|---|---|
| CZT HV Monitor | 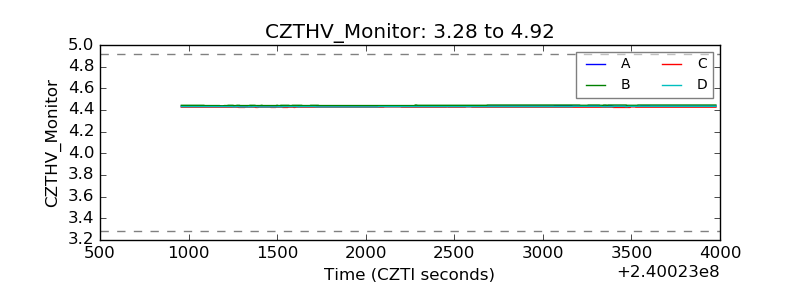 |
| D_VDD | 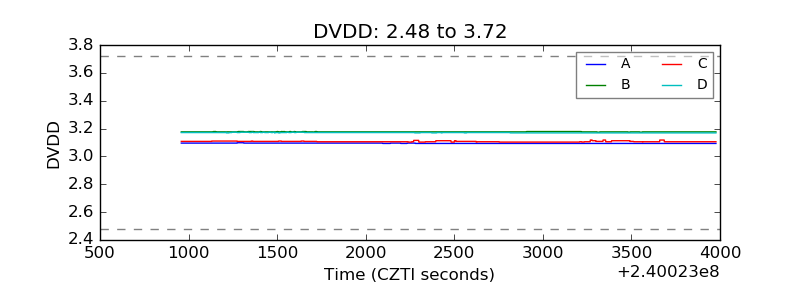 |
| Temperature 1 | 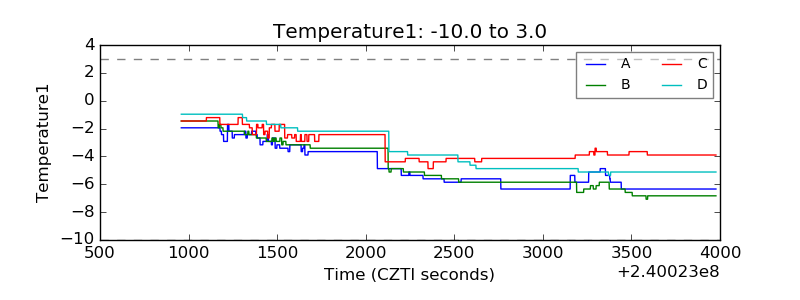 |
| Veto HV Monitor | 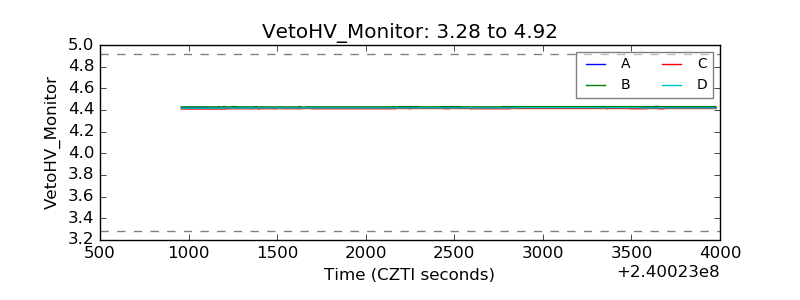 |
| Veto LLD | 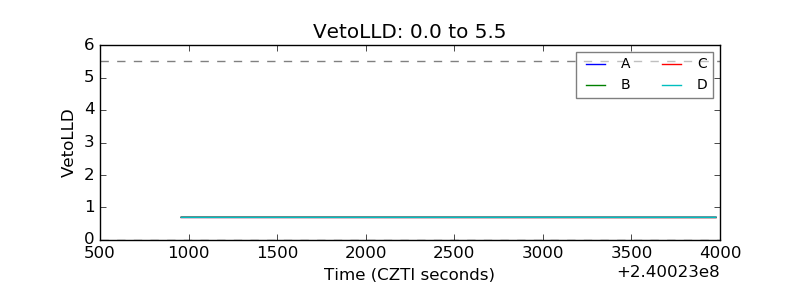 |
| Alpha Counter | 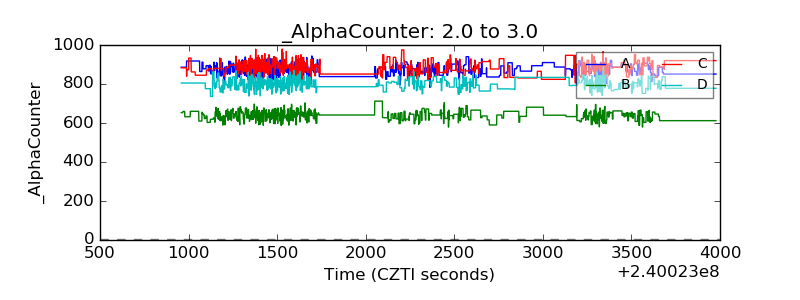 |
| _CPM_Rate | 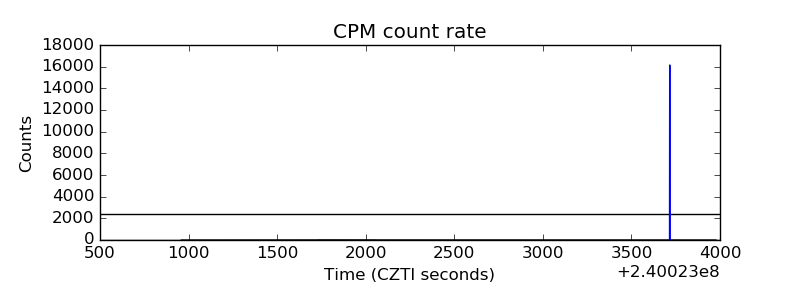 |
| CZT Counter | 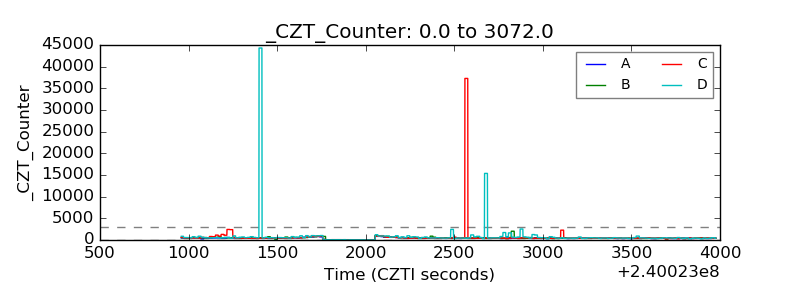 |
| +2.5 Volts monitor |  |
| +5 Volts monitor |  |
| _ROLL_ROT | 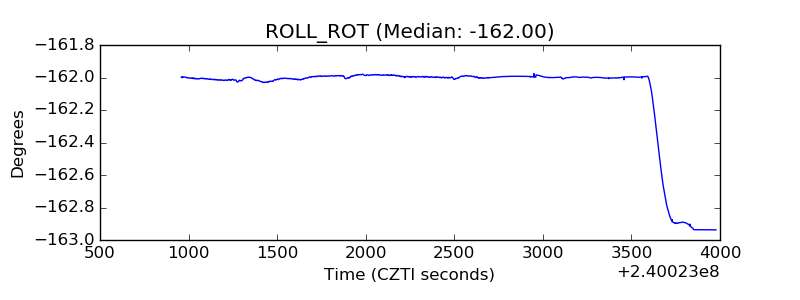 |
| _Roll_DEC | 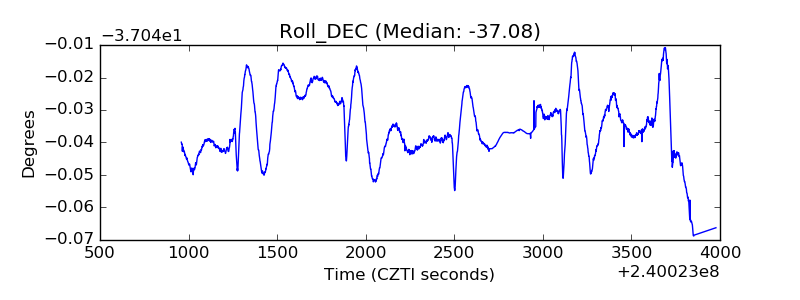 |
| _Roll_RA | 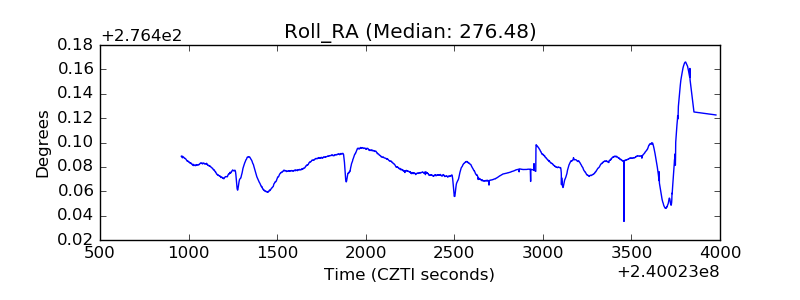 |
| Veto Counter | 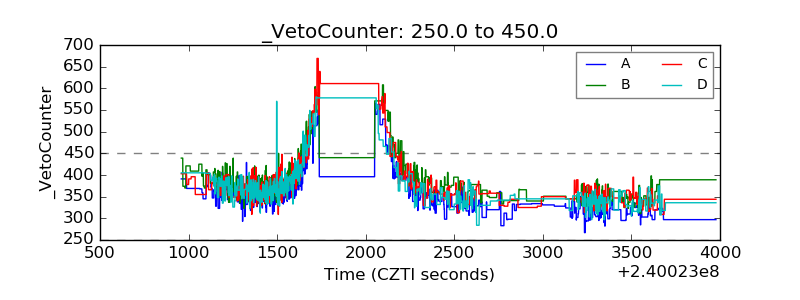 |