| Param | Original file | Final file |
|---|---|---|
| Filename | modeM0/AS1G07_072T01_9000001452_10097cztM0_level2.evt | modeM0/AS1G07_072T01_9000001452_10097cztM0_level2_quad_clean.evt |
| Size (bytes) | 538,862,400 | 83,836,800 |
| Size | 513.9 MB | 80.0 MB |
| Events in quadrant A | 3,393,556 | 507,302 |
| Events in quadrant B | 3,626,271 | 516,455 |
| Events in quadrant C | 3,392,661 | 515,376 |
| Events in quadrant D | 5,402,253 | 481,810 |
| Mode SS | |||
|---|---|---|---|
| Quadrant | BADHDUFLAG | Total packets | Discarded packets |
| A | 0 | 152 | 0 |
| B | 0 | 152 | 0 |
| C | 0 | 152 | 0 |
| D | 0 | 152 | 0 |
| Mode M0 | |||
|---|---|---|---|
| Quadrant | BADHDUFLAG | Total packets | Discarded packets |
| A | 0 | 15193 | 26 |
| B | 0 | 15609 | 30 |
| C | 0 | 15307 | 28 |
| D | 0 | 21024 | 52 |
| Mode M9 | |||
|---|---|---|---|
| Quadrant | BADHDUFLAG | Total packets | Discarded packets |
| A | 0 | 17 | 0 |
| B | 0 | 17 | 0 |
| C | 0 | 17 | 0 |
| D | 0 | 17 | 0 |
| Quadrant | Total seconds | Saturated seconds | Saturation percentage |
|---|---|---|---|
| A | 7445 | 66 | 0.886501% |
| B | 7443 | 85 | 1.142013% |
| C | 7443 | 74 | 0.994223% |
| D | 7440 | 201 | 2.701613% |
Noise dominated data is calculated using 1-second bins in cleaned event files. If a bin has >2000 counts, and if more than 50% of those come from <1% of pixels, then it is considered to be noise-dominated and hence unusable.
| Quadrant | # 1 sec bins | Bins with >0 counts | Bins with >2000 counts | High rate bins dominated by noise | Noise dominated (total time) | Noise dominated (detector-on time) | Marked lightcurve |
|---|---|---|---|---|---|---|---|
| A | 9095 | 7455 | 0 | 0 | 0.00% | 0.00% | 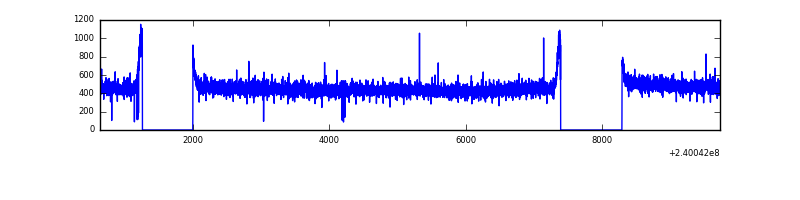 |
| B | 9095 | 7454 | 12 | 12 | 0.13% | 0.16% | 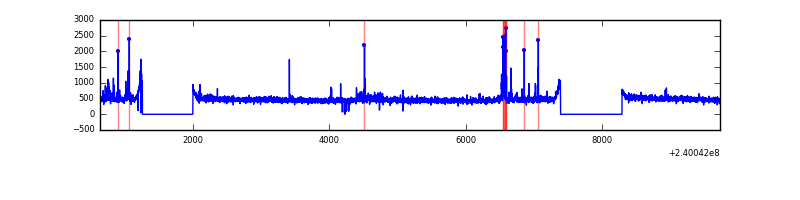 |
| C | 9095 | 7454 | 6 | 6 | 0.07% | 0.08% |  |
| D | 9095 | 7453 | 102 | 102 | 1.12% | 1.37% |  |
Top three noisy pixels from each quadrant. If the there are fewer than three noisy pixels in the level2.evt file, extra rows are filled as -1
| Pixel properties | Quadrant properties | ||||||
|---|---|---|---|---|---|---|---|
| Quadrant | DetID | PixID | Counts | Sigma | Mean | Median | Sigma |
| A | 0 | 226 | 7960 | 39.39 | 880 | 860 | 180.3 |
| A | 12 | 194 | 7231 | 35.34 | 880 | 860 | 180.3 |
| A | 3 | 137 | 4059 | 17.75 | 880 | 860 | 180.3 |
| B | 4 | 239 | 107756 | 629.91 | 886 | 864 | 169.7 |
| B | 0 | 214 | 54505 | 316.11 | 886 | 864 | 169.7 |
| B | 12 | 111 | 18817 | 105.8 | 886 | 864 | 169.7 |
| C | 14 | 234 | 31199 | 150.79 | 860 | 863 | 201.2 |
| C | 13 | 61 | 6409 | 27.57 | 860 | 863 | 201.2 |
| C | 8 | 222 | 4933 | 20.23 | 860 | 863 | 201.2 |
| D | 1 | 52 | 1690479 | 7681.82 | 842 | 820 | 220.0 |
| D | 8 | 195 | 164053 | 742.12 | 842 | 820 | 220.0 |
| D | 2 | 16 | 150221 | 679.23 | 842 | 820 | 220.0 |
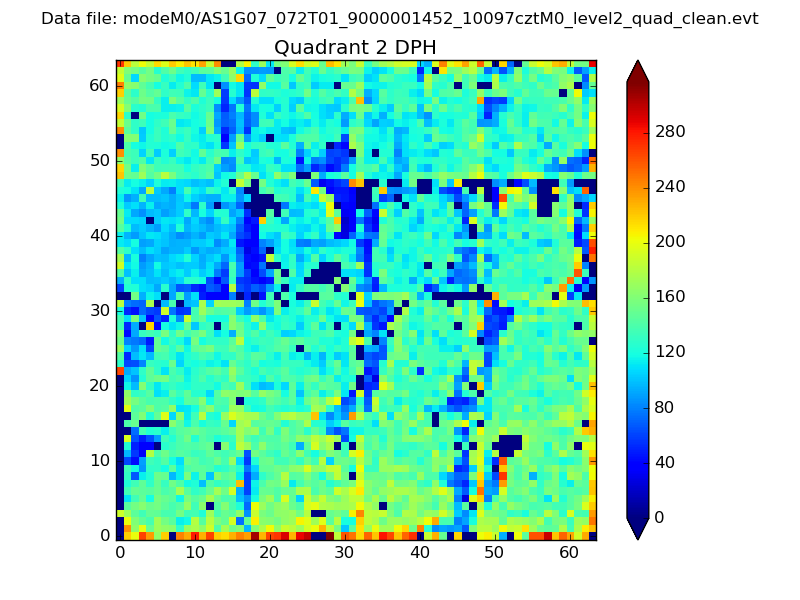
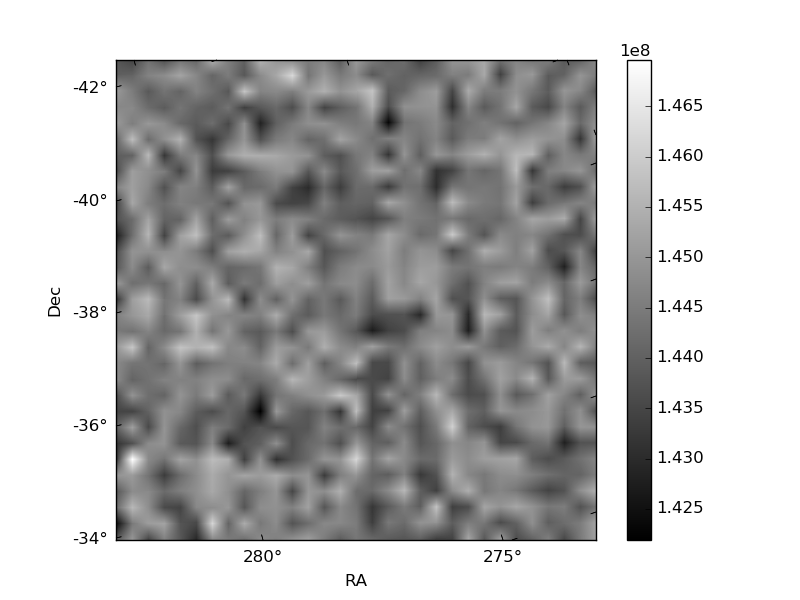
Histogram calculated using DETX and DETY for each event in the final _common_clean file
| Quadrant A | 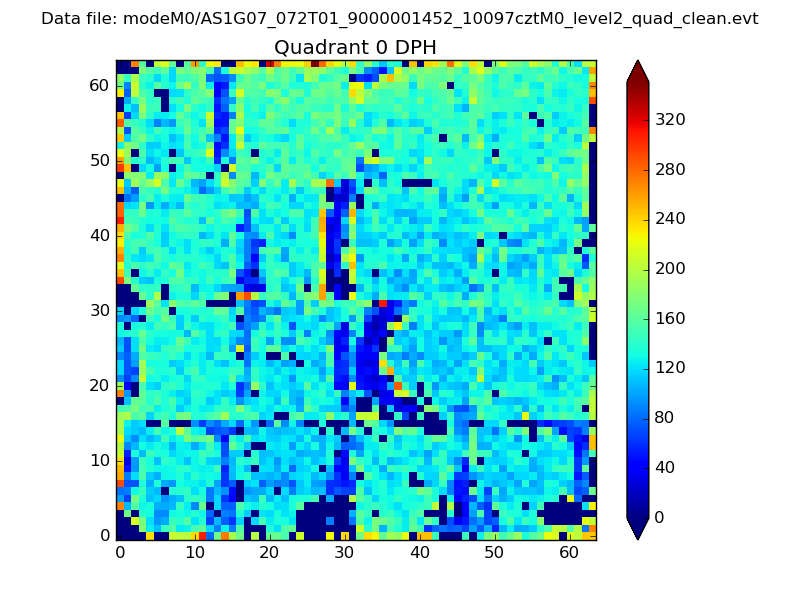 |
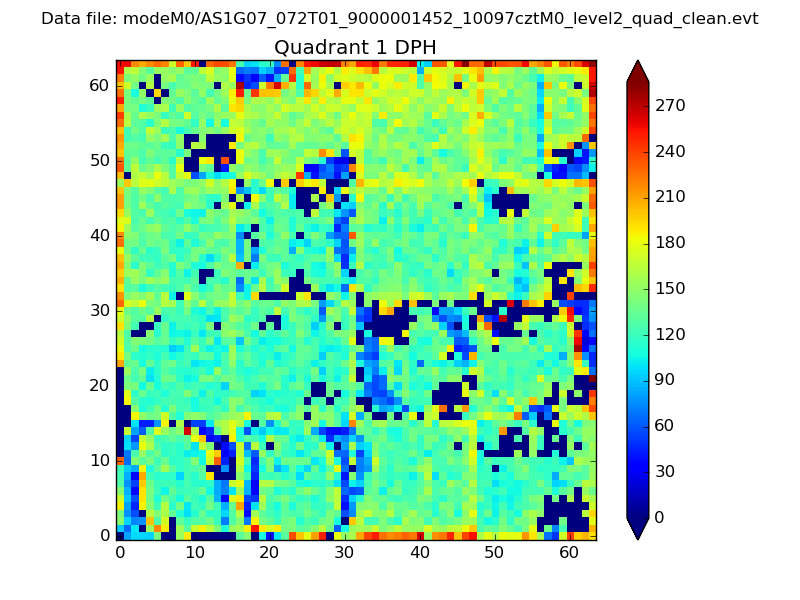 |
Quadrant B |
|---|---|---|---|
| Quadrant D | 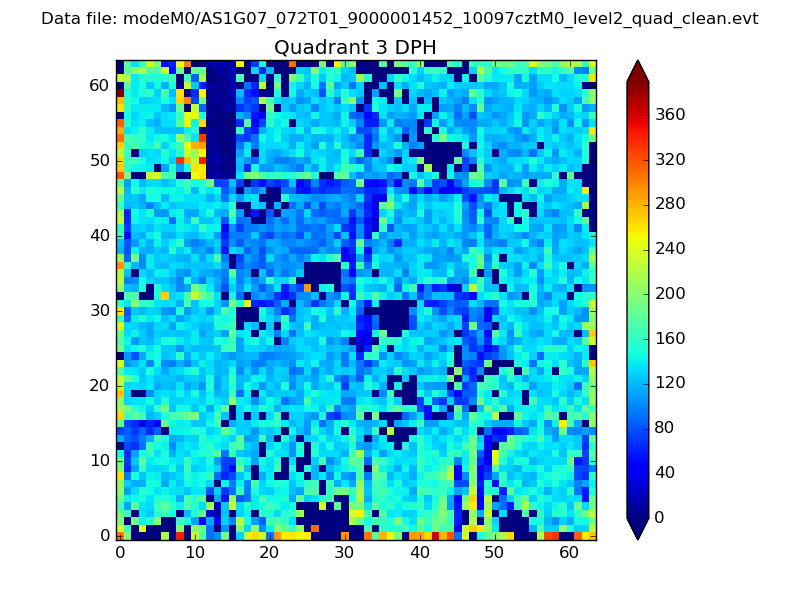 |
 |
Quadrant C |
| Plot type | Count rate plots | Images |
|---|---|---|
| Comparison with Poisson distribution Blue bars denote a histogram of data divided into 1 sec bins. Red curve is a Poisson curve with rate = median count rate of data. |
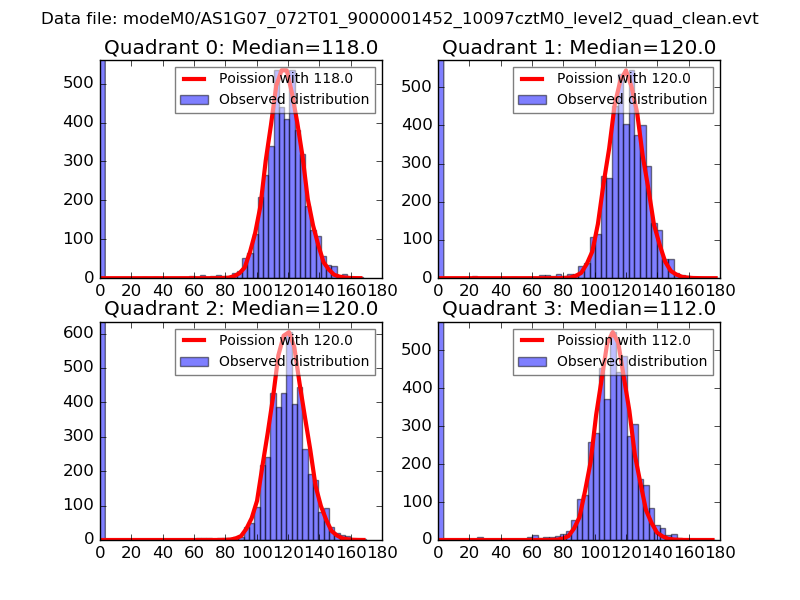 |
 |
| Quadrant-wise count rates Data is divided into 100 sec bins |
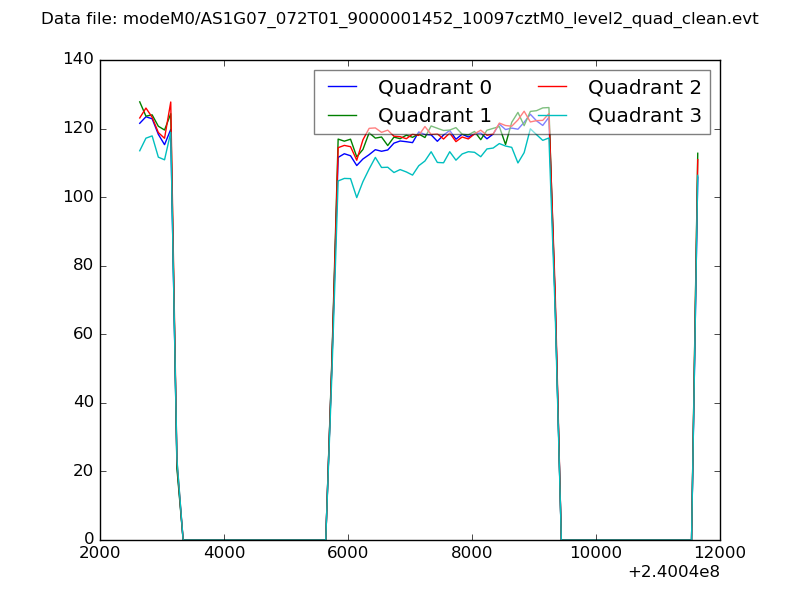 |
|
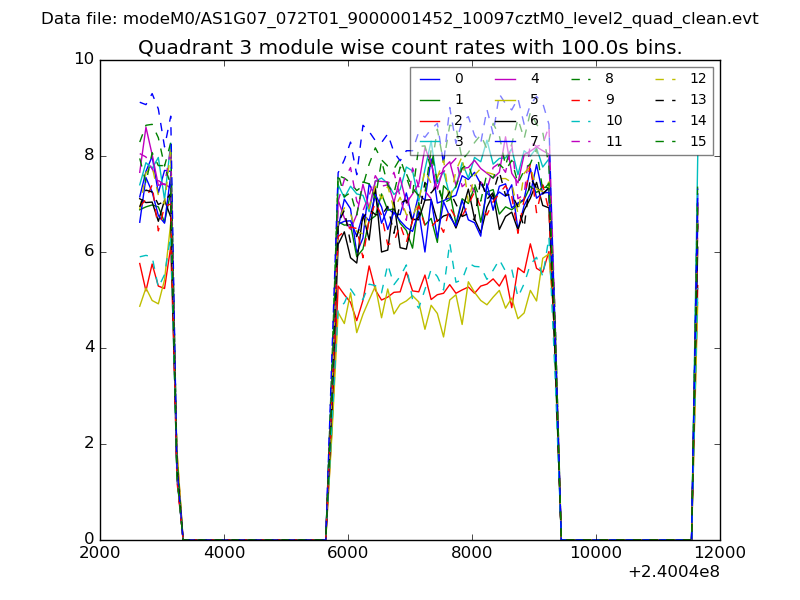
| Module-wise count rates for Quadrant A Data is divided into 100 sec bins |
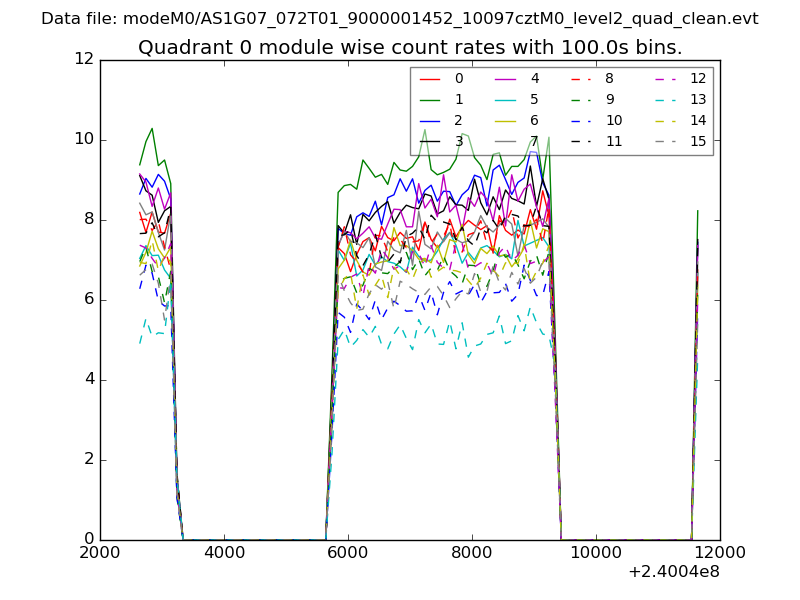 |
 |
| Module-wise count rates for Quadrant B Data is divided into 100 sec bins |
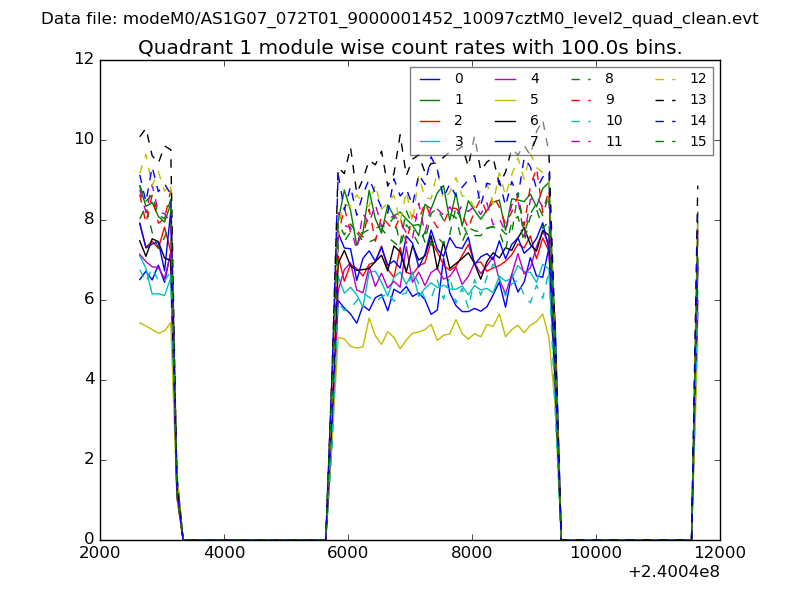 |
 |
| Module-wise count rates for Quadrant C Data is divided into 100 sec bins |
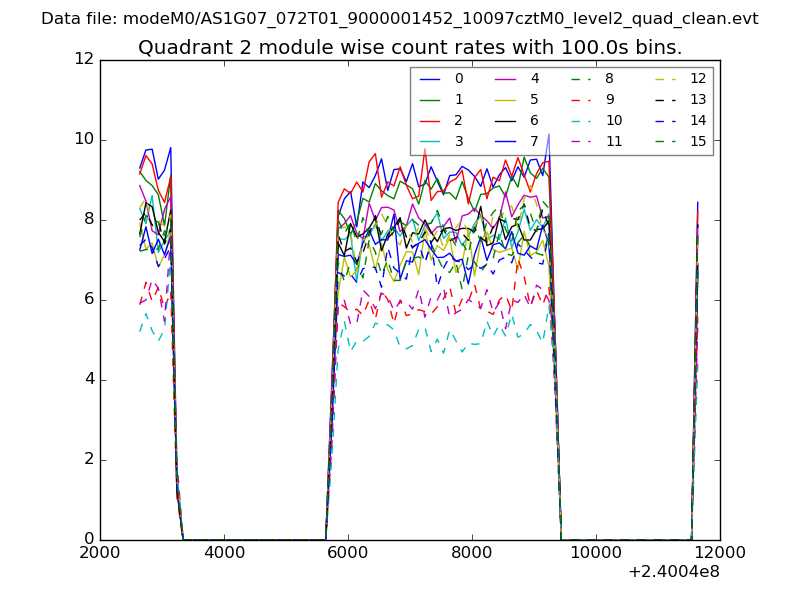 |
 |
| Module-wise count rates for Quadrant D Data is divided into 100 sec bins |
 |
 |
| Parameter | Plot |
|---|---|
| CZT HV Monitor | 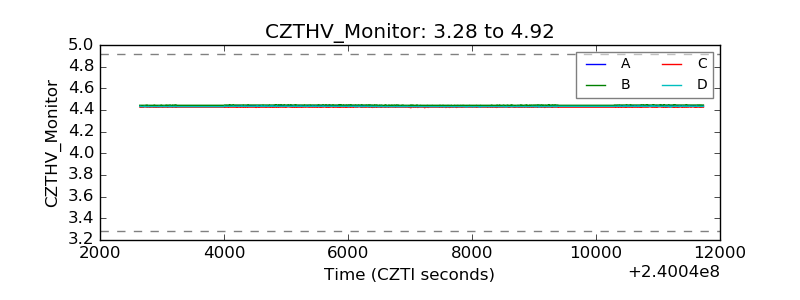 |
| D_VDD | 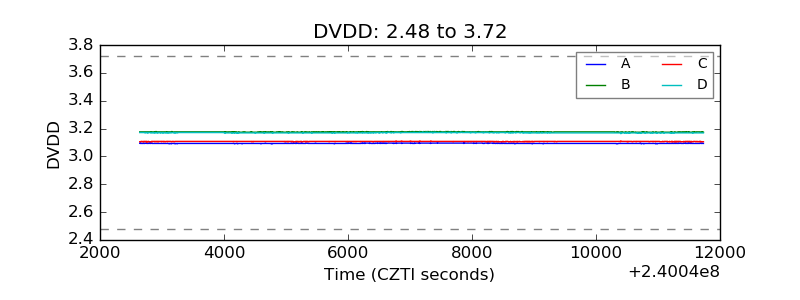 |
| Temperature 1 | 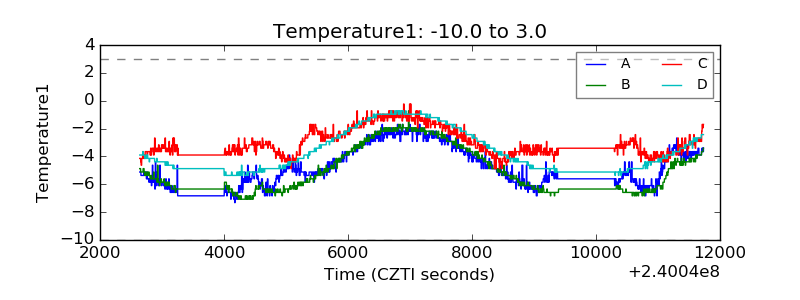 |
| Veto HV Monitor | 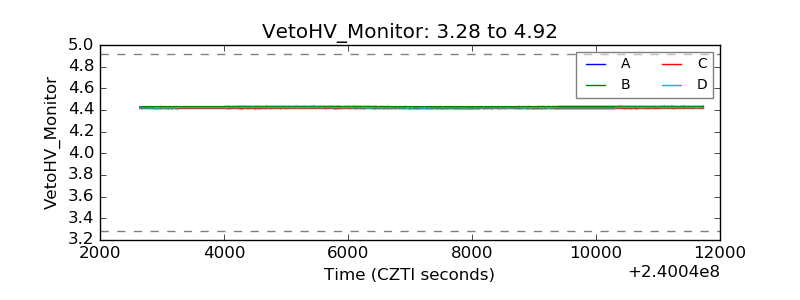 |
| Veto LLD | 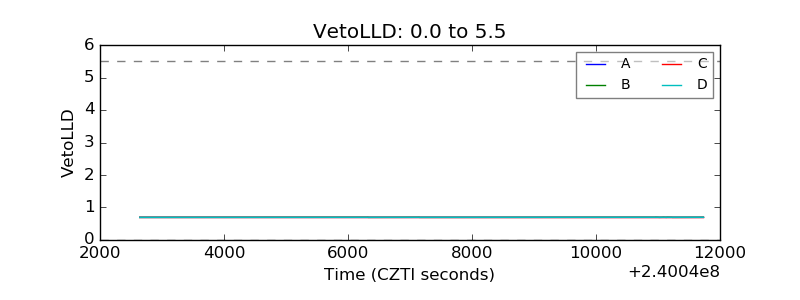 |
| Alpha Counter | 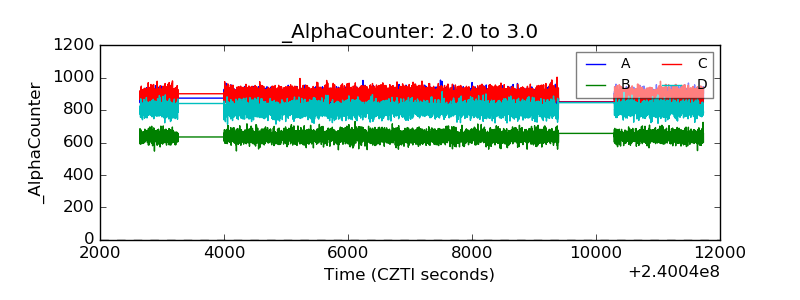 |
| _CPM_Rate | 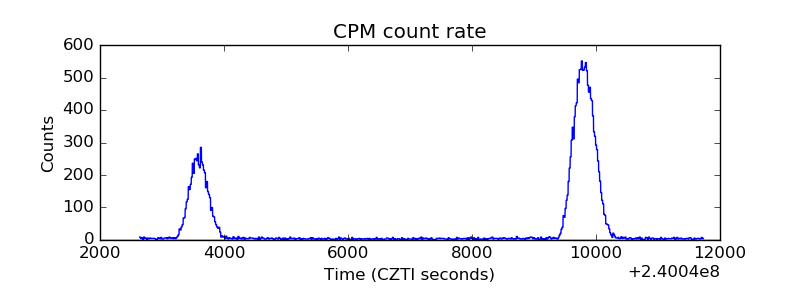 |
| CZT Counter | 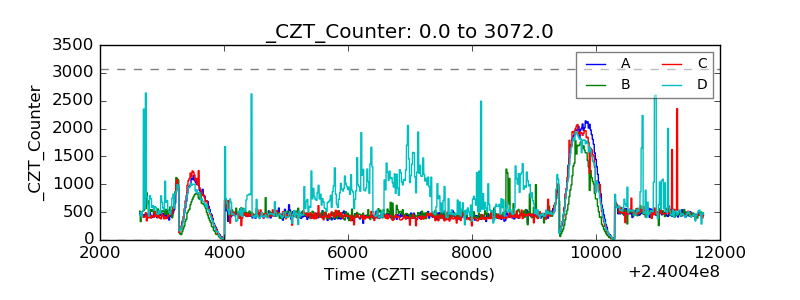 |
| +2.5 Volts monitor |  |
| +5 Volts monitor | 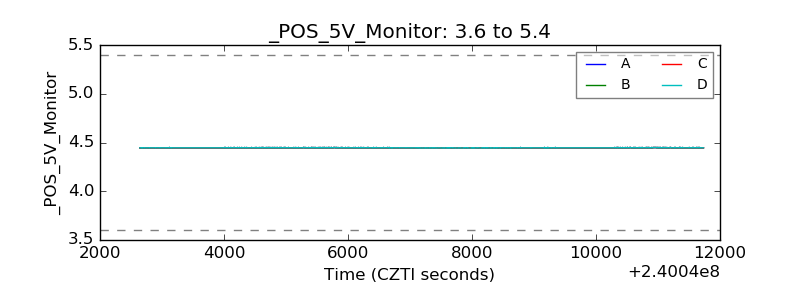 |
| _ROLL_ROT | 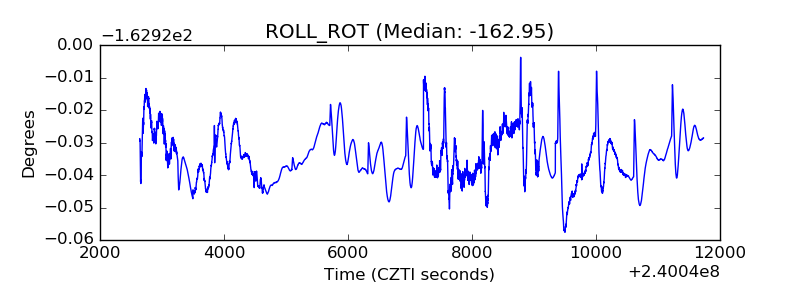 |
| _Roll_DEC | 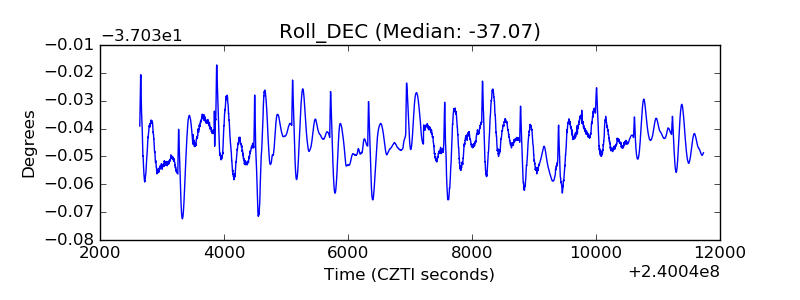 |
| _Roll_RA | 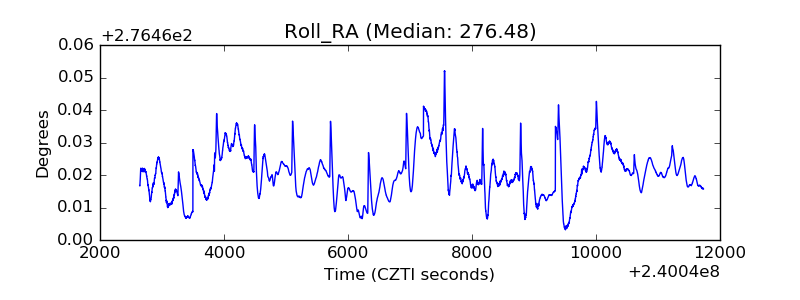 |
| Veto Counter | 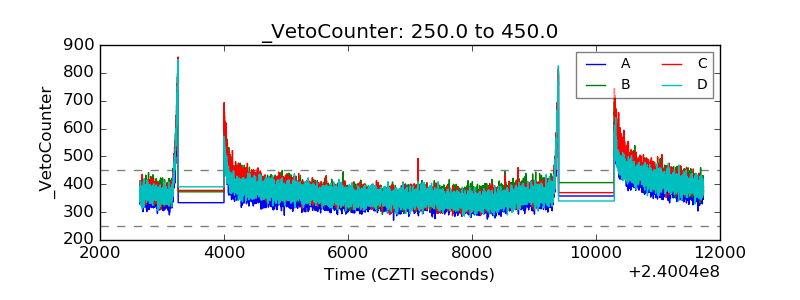 |