| Param | Original file | Final file |
|---|---|---|
| Filename | modeM0/AS1G07_072T01_9000001452_10100cztM0_level2.evt | modeM0/AS1G07_072T01_9000001452_10100cztM0_level2_quad_clean.evt |
| Size (bytes) | 450,961,920 | 92,825,280 |
| Size | 430.1 MB | 88.5 MB |
| Events in quadrant A | 3,161,341 | 591,313 |
| Events in quadrant B | 3,346,513 | 602,054 |
| Events in quadrant C | 3,114,680 | 595,653 |
| Events in quadrant D | 3,593,854 | 569,478 |
| Mode SS | |||
|---|---|---|---|
| Quadrant | BADHDUFLAG | Total packets | Discarded packets |
| A | 0 | 132 | 0 |
| B | 0 | 132 | 0 |
| C | 0 | 132 | 0 |
| D | 0 | 132 | 0 |
| Mode M0 | |||
|---|---|---|---|
| Quadrant | BADHDUFLAG | Total packets | Discarded packets |
| A | 0 | 13650 | 3 |
| B | 0 | 14093 | 2 |
| C | 0 | 13620 | 2 |
| D | 0 | 14825 | 2 |
| Mode M9 | |||
|---|---|---|---|
| Quadrant | BADHDUFLAG | Total packets | Discarded packets |
| A | 0 | 13 | 0 |
| B | 0 | 13 | 0 |
| C | 0 | 13 | 0 |
| D | 0 | 14 | 0 |
| Quadrant | Total seconds | Saturated seconds | Saturation percentage |
|---|---|---|---|
| A | 6488 | 84 | 1.294698% |
| B | 6488 | 100 | 1.541307% |
| C | 6488 | 77 | 1.186806% |
| D | 6488 | 116 | 1.787916% |
Noise dominated data is calculated using 1-second bins in cleaned event files. If a bin has >2000 counts, and if more than 50% of those come from <1% of pixels, then it is considered to be noise-dominated and hence unusable.
| Quadrant | # 1 sec bins | Bins with >0 counts | Bins with >2000 counts | High rate bins dominated by noise | Noise dominated (total time) | Noise dominated (detector-on time) | Marked lightcurve |
|---|---|---|---|---|---|---|---|
| A | 7623 | 6488 | 0 | 0 | 0.00% | 0.00% |  |
| B | 7623 | 6488 | 4 | 4 | 0.05% | 0.06% |  |
| C | 7623 | 6488 | 0 | 0 | 0.00% | 0.00% |  |
| D | 7623 | 6488 | 33 | 33 | 0.43% | 0.51% |  |
Top three noisy pixels from each quadrant. If the there are fewer than three noisy pixels in the level2.evt file, extra rows are filled as -1
| Pixel properties | Quadrant properties | ||||||
|---|---|---|---|---|---|---|---|
| Quadrant | DetID | PixID | Counts | Sigma | Mean | Median | Sigma |
| A | 15 | 174 | 12518 | 71.57 | 815 | 799 | 163.7 |
| A | 0 | 226 | 7536 | 41.14 | 815 | 799 | 163.7 |
| A | 12 | 194 | 6872 | 37.09 | 815 | 799 | 163.7 |
| B | 0 | 214 | 89646 | 579.66 | 813 | 794 | 153.3 |
| B | 4 | 239 | 37753 | 241.12 | 813 | 794 | 153.3 |
| B | 0 | 230 | 17628 | 109.82 | 813 | 794 | 153.3 |
| C | 14 | 67 | 12339 | 63.58 | 786 | 792 | 181.6 |
| C | 14 | 234 | 10972 | 56.05 | 786 | 792 | 181.6 |
| C | 8 | 128 | 10697 | 54.54 | 786 | 792 | 181.6 |
| D | 1 | 52 | 245654 | 1184.04 | 782 | 763 | 206.8 |
| D | 7 | 71 | 118827 | 570.84 | 782 | 763 | 206.8 |
| D | 8 | 195 | 78014 | 373.51 | 782 | 763 | 206.8 |
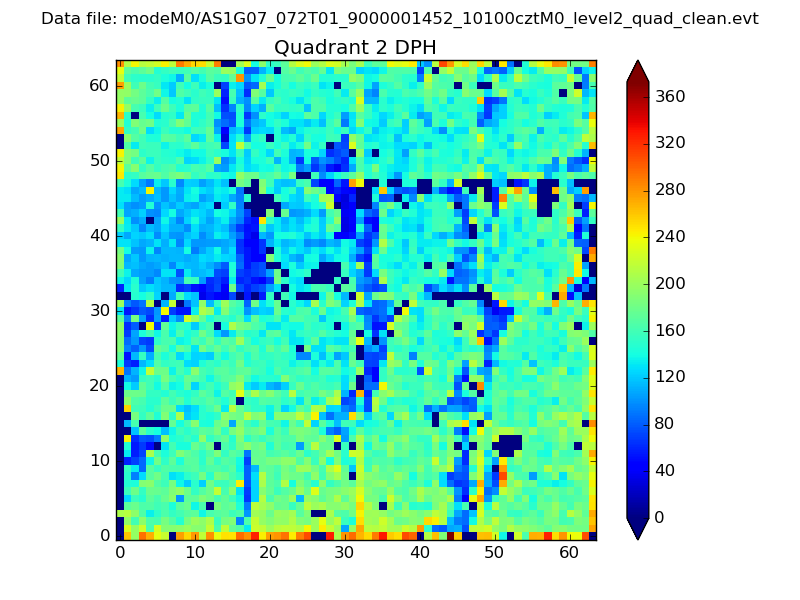
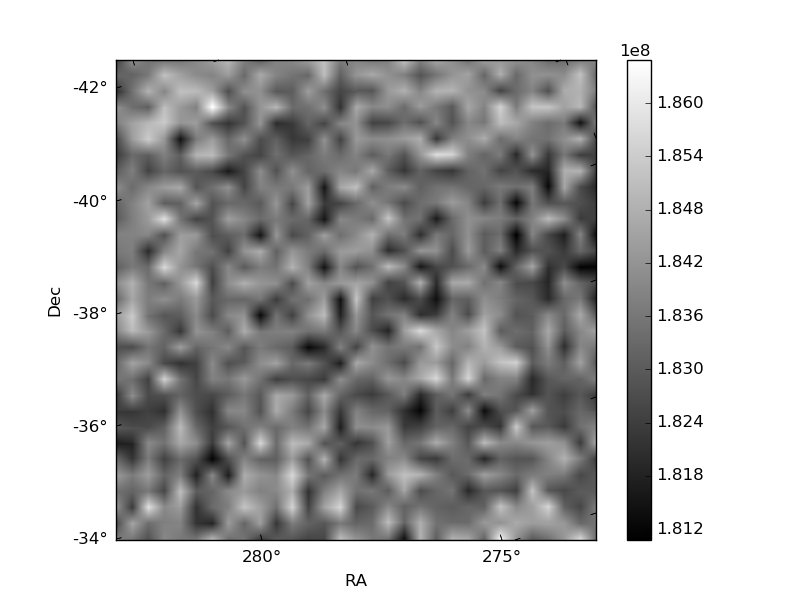
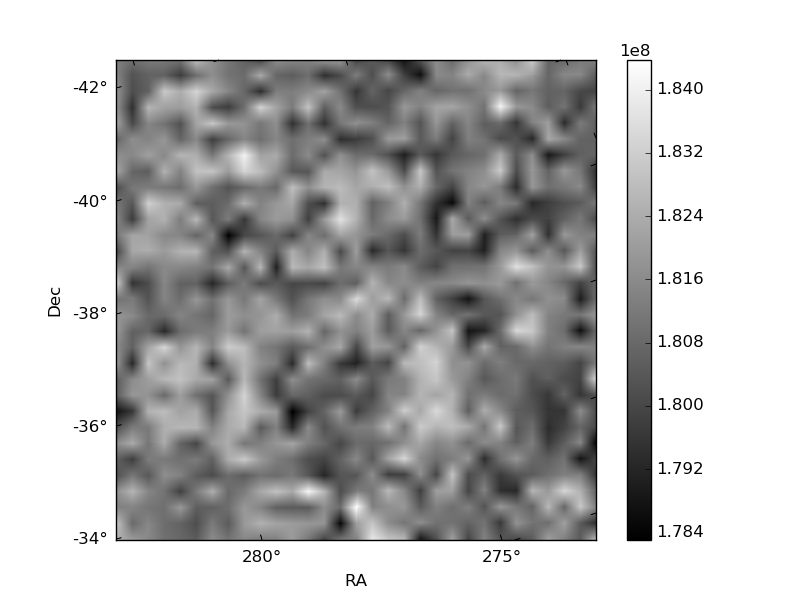
Histogram calculated using DETX and DETY for each event in the final _common_clean file
| Quadrant A | 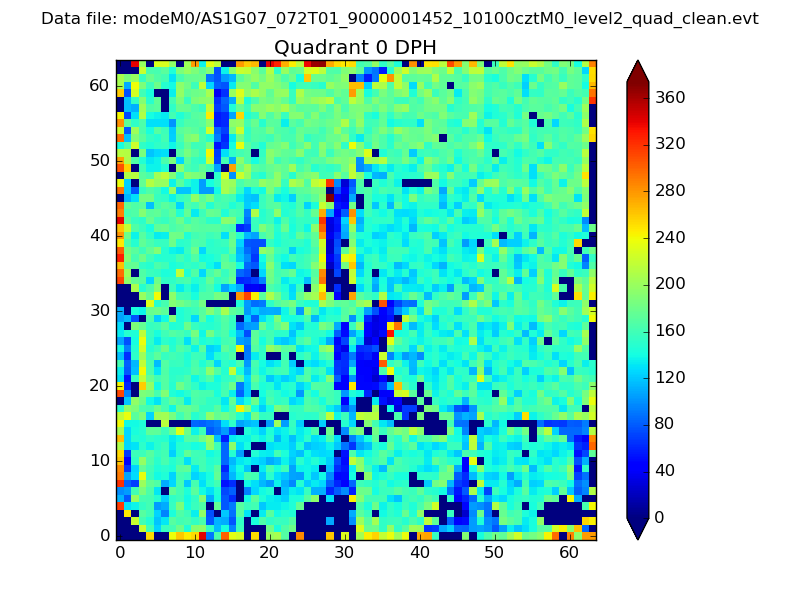 |
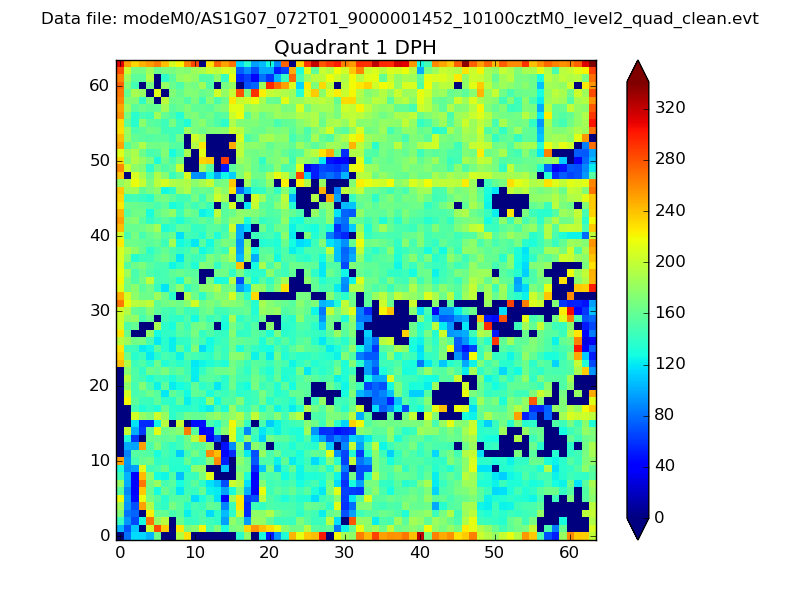 |
Quadrant B |
|---|---|---|---|
| Quadrant D | 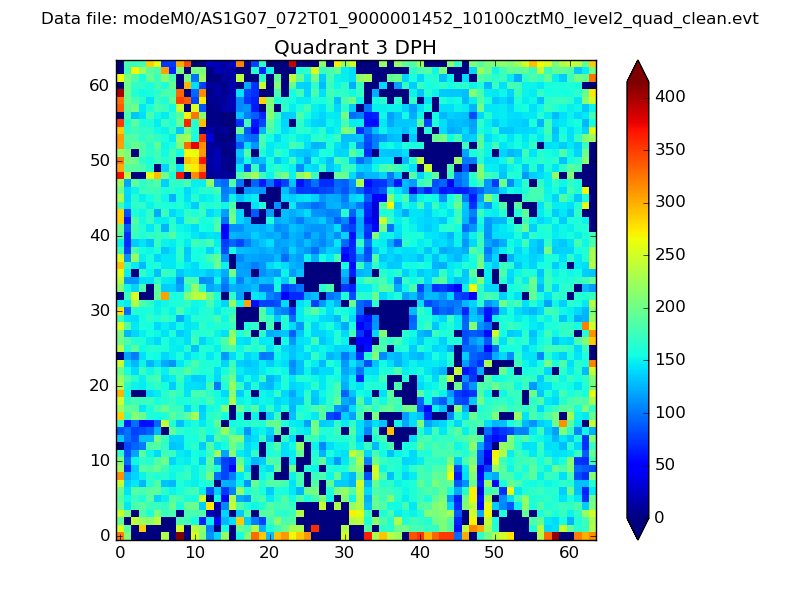 |
 |
Quadrant C |
| Plot type | Count rate plots | Images |
|---|---|---|
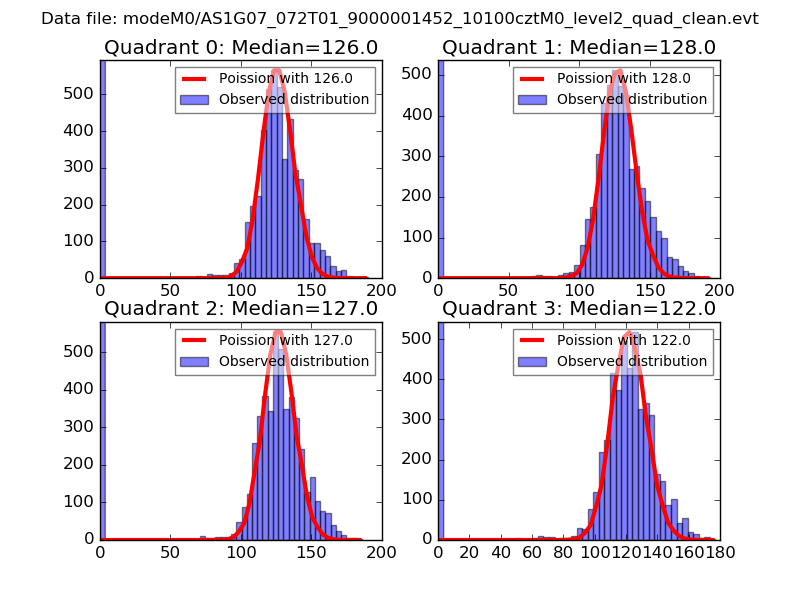
| Comparison with Poisson distribution Blue bars denote a histogram of data divided into 1 sec bins. Red curve is a Poisson curve with rate = median count rate of data. |
 |
 |
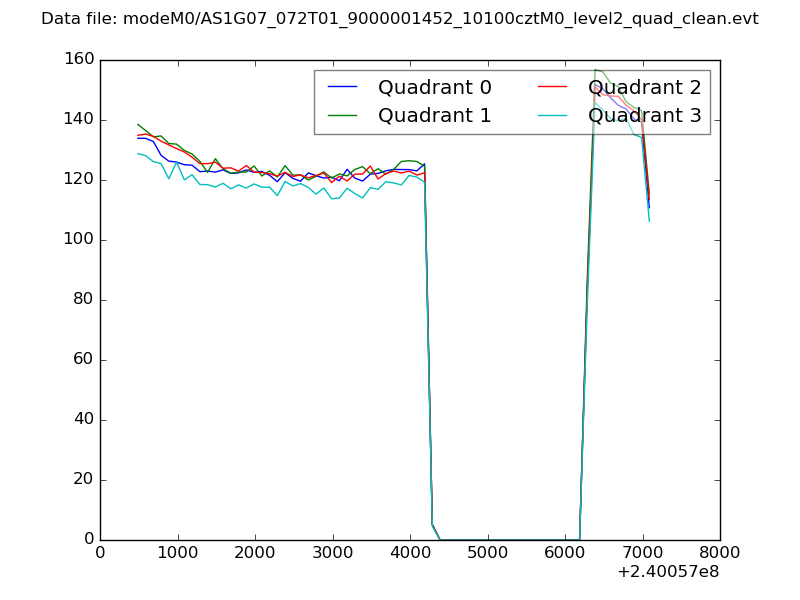
| Quadrant-wise count rates Data is divided into 100 sec bins |
 |
|
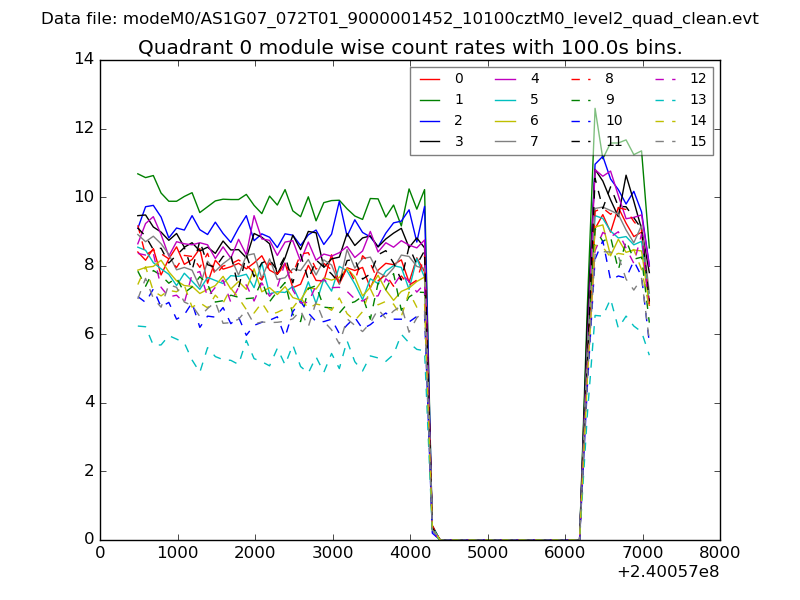
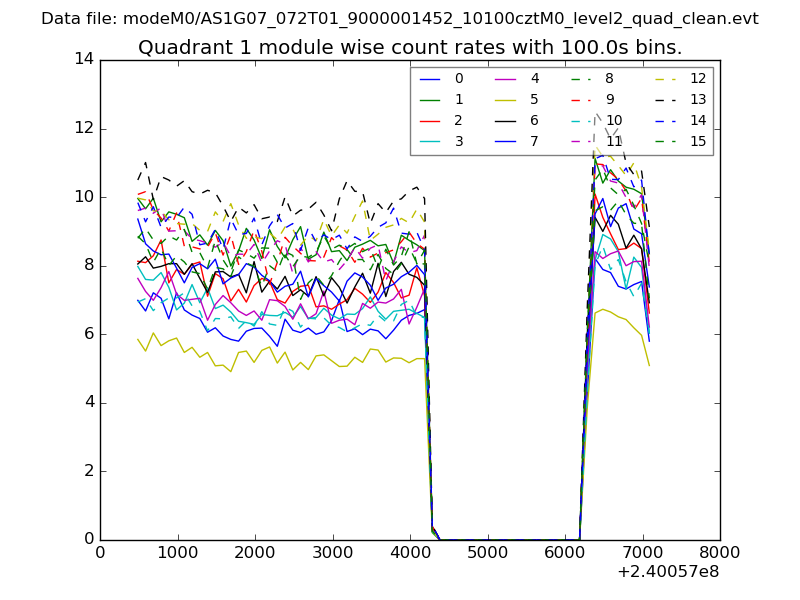
| Module-wise count rates for Quadrant A Data is divided into 100 sec bins |
 |
 |
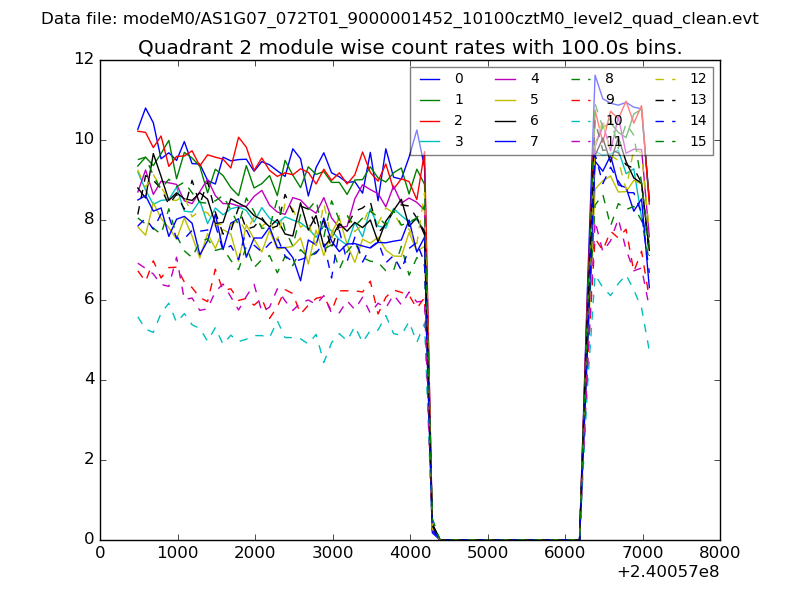
| Module-wise count rates for Quadrant B Data is divided into 100 sec bins |
 |
 |
| Module-wise count rates for Quadrant C Data is divided into 100 sec bins |
 |
 |
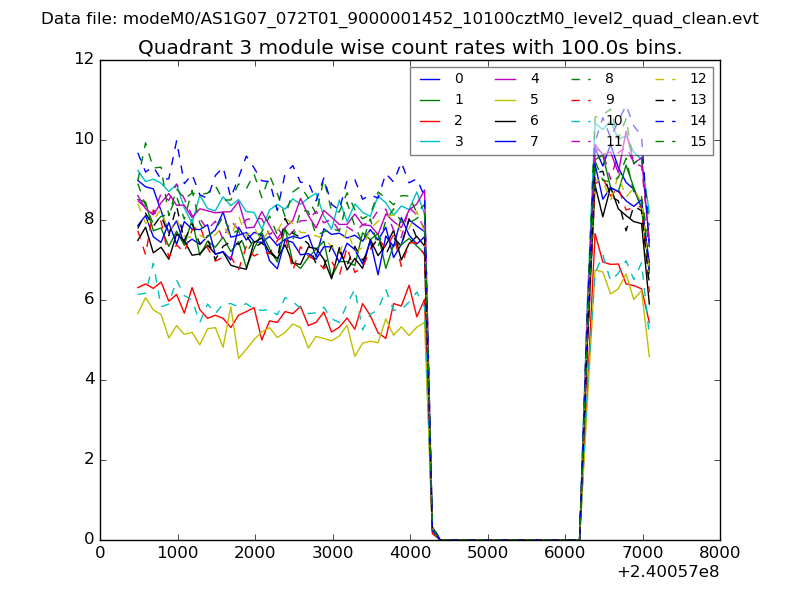
| Module-wise count rates for Quadrant D Data is divided into 100 sec bins |
 |
 |
| Parameter | Plot |
|---|---|
| CZT HV Monitor | 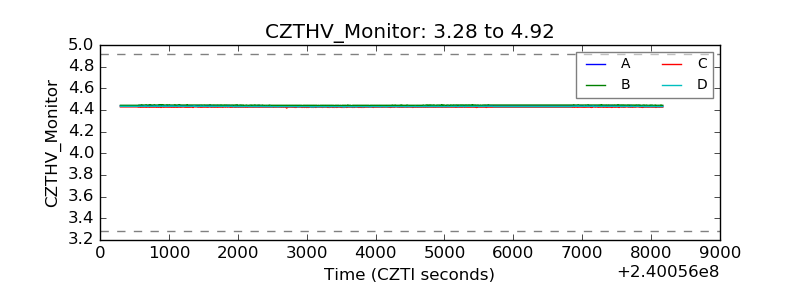 |
| D_VDD |  |
| Temperature 1 | 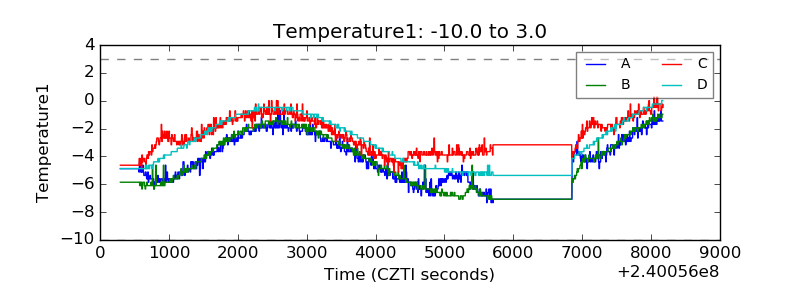 |
| Veto HV Monitor |  |
| Veto LLD | 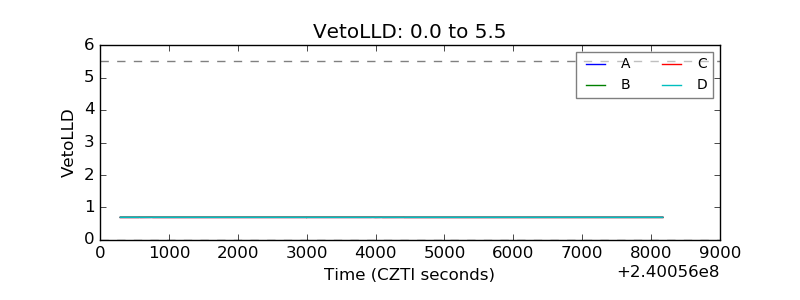 |
| Alpha Counter | 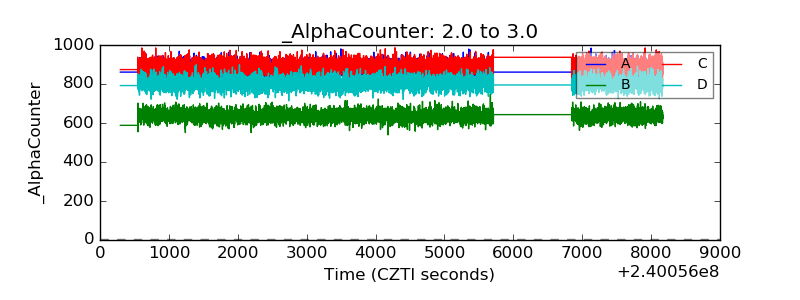 |
| _CPM_Rate |  |
| CZT Counter | 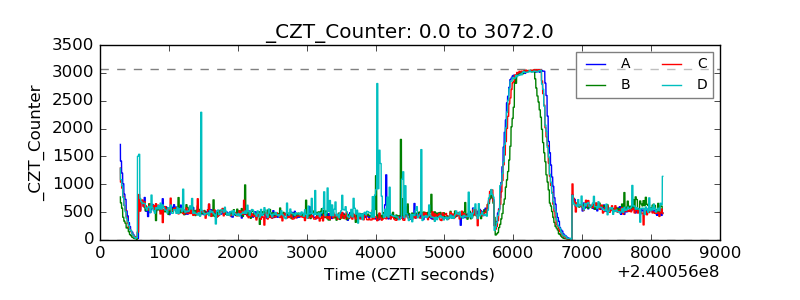 |
| +2.5 Volts monitor |  |
| +5 Volts monitor |  |
| _ROLL_ROT | 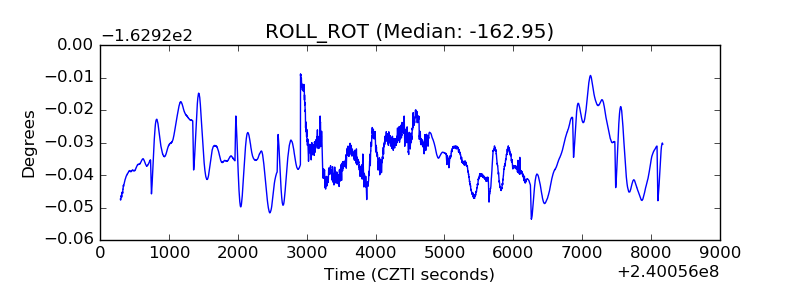 |
| _Roll_DEC | 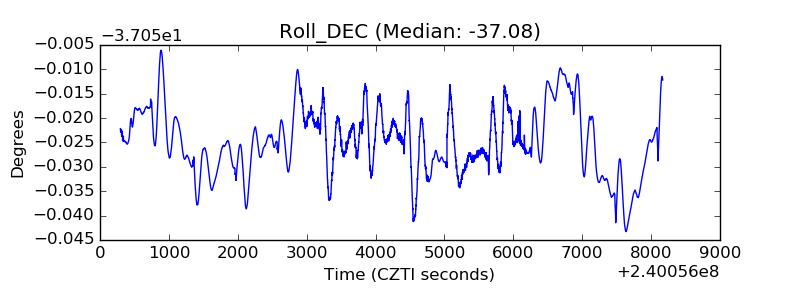 |
| _Roll_RA |  |
| Veto Counter | 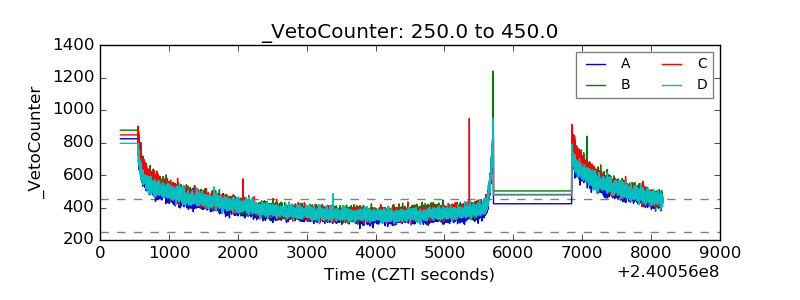 |