| Param | Original file | Final file |
|---|---|---|
| Filename | modeM0/AS1G07_072T01_9000001452_10101cztM0_level2.evt | modeM0/AS1G07_072T01_9000001452_10101cztM0_level2_quad_clean.evt |
| Size (bytes) | 348,094,080 | 87,117,120 |
| Size | 332.0 MB | 83.1 MB |
| Events in quadrant A | 2,398,797 | 583,812 |
| Events in quadrant B | 2,570,466 | 588,082 |
| Events in quadrant C | 2,333,468 | 584,401 |
| Events in quadrant D | 2,905,494 | 538,971 |
| Mode SS | |||
|---|---|---|---|
| Quadrant | BADHDUFLAG | Total packets | Discarded packets |
| A | 0 | 113 | 12 |
| B | 0 | 114 | 16 |
| C | 0 | 113 | 17 |
| D | 0 | 114 | 16 |
| Mode M0 | |||
|---|---|---|---|
| Quadrant | BADHDUFLAG | Total packets | Discarded packets |
| A | 0 | 11918 | 1574 |
| B | 0 | 12604 | 1759 |
| C | 0 | 11758 | 1517 |
| D | 0 | 14154 | 2331 |
| Mode M9 | |||
|---|---|---|---|
| Quadrant | BADHDUFLAG | Total packets | Discarded packets |
| A | 0 | 13 | 0 |
| B | 0 | 13 | 1 |
| C | 0 | 13 | 1 |
| D | 0 | 13 | 0 |
| Quadrant | Total seconds | Saturated seconds | Saturation percentage |
|---|---|---|---|
| A | 4915 | 62 | 1.261445% |
| B | 4893 | 62 | 1.267116% |
| C | 4935 | 38 | 0.770010% |
| D | 4790 | 83 | 1.732777% |
Noise dominated data is calculated using 1-second bins in cleaned event files. If a bin has >2000 counts, and if more than 50% of those come from <1% of pixels, then it is considered to be noise-dominated and hence unusable.
| Quadrant | # 1 sec bins | Bins with >0 counts | Bins with >2000 counts | High rate bins dominated by noise | Noise dominated (total time) | Noise dominated (detector-on time) | Marked lightcurve |
|---|---|---|---|---|---|---|---|
| A | 6889 | 5449 | 0 | 0 | 0.00% | 0.00% | 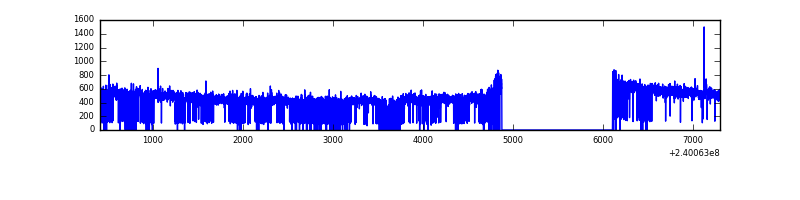 |
| B | 6888 | 5430 | 0 | 0 | 0.00% | 0.00% | 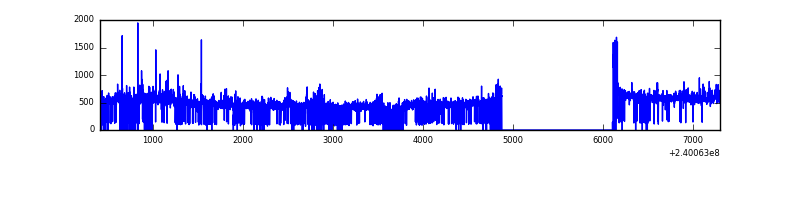 |
| C | 6889 | 5464 | 0 | 0 | 0.00% | 0.00% | 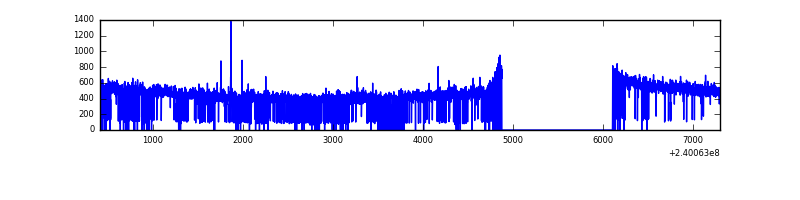 |
| D | 6889 | 5407 | 30 | 30 | 0.44% | 0.55% | 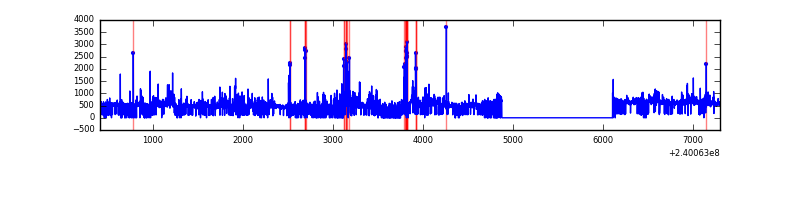 |
Top three noisy pixels from each quadrant. If the there are fewer than three noisy pixels in the level2.evt file, extra rows are filled as -1
| Pixel properties | Quadrant properties | ||||||
|---|---|---|---|---|---|---|---|
| Quadrant | DetID | PixID | Counts | Sigma | Mean | Median | Sigma |
| A | 15 | 174 | 6610 | 47.78 | 621 | 609 | 125.6 |
| A | 0 | 226 | 5872 | 41.9 | 621 | 609 | 125.6 |
| A | 12 | 194 | 5247 | 36.93 | 621 | 609 | 125.6 |
| B | 0 | 214 | 79214 | 671.46 | 615 | 603 | 117.1 |
| B | 0 | 219 | 41240 | 347.1 | 615 | 603 | 117.1 |
| B | 4 | 81 | 23727 | 197.51 | 615 | 603 | 117.1 |
| C | 14 | 67 | 6082 | 39.86 | 594 | 597 | 137.6 |
| C | 14 | 234 | 4542 | 28.67 | 594 | 597 | 137.6 |
| C | 13 | 61 | 4538 | 28.64 | 594 | 597 | 137.6 |
| D | 1 | 52 | 267233 | 1899.11 | 582 | 564 | 140.4 |
| D | 0 | 11 | 85810 | 607.09 | 582 | 564 | 140.4 |
| D | 13 | 104 | 70647 | 499.1 | 582 | 564 | 140.4 |
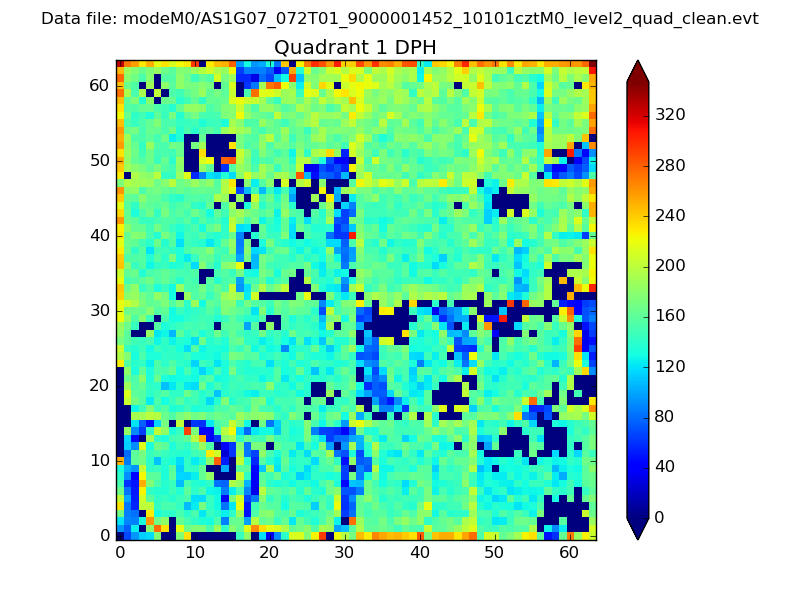
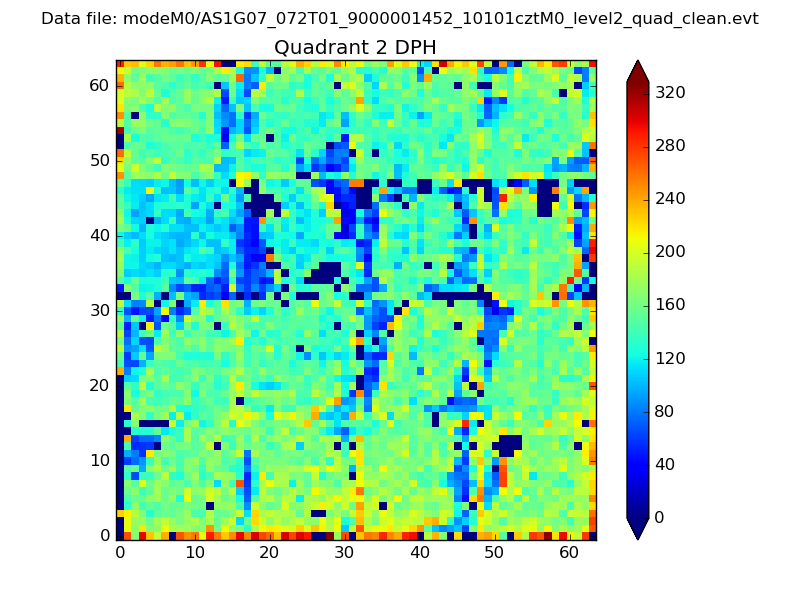
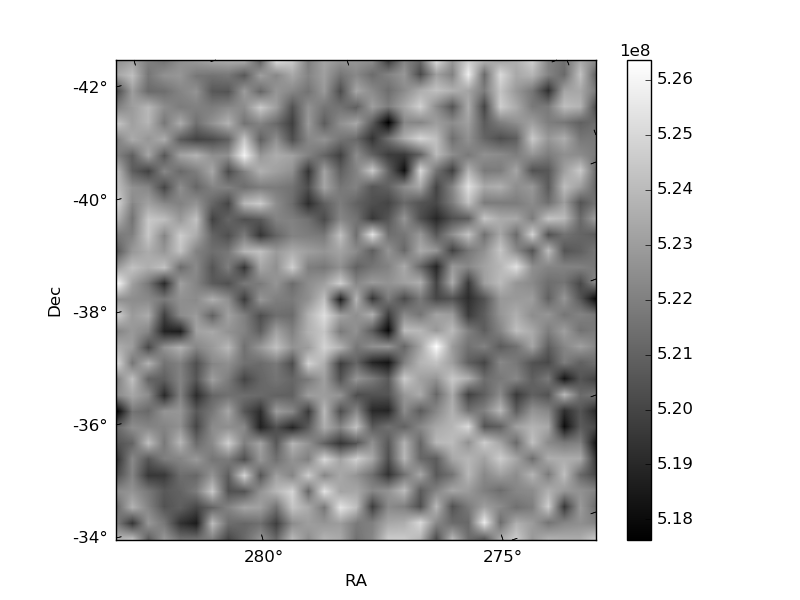
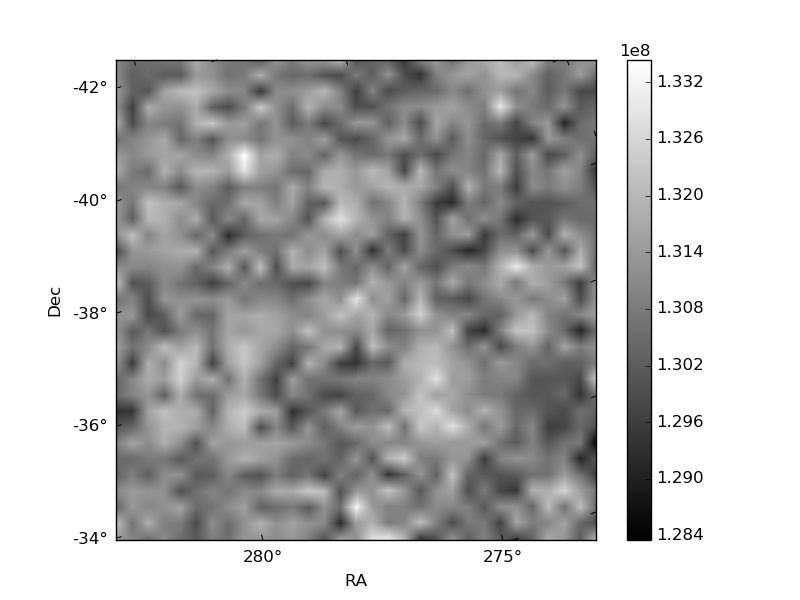
Histogram calculated using DETX and DETY for each event in the final _common_clean file
| Quadrant A |  |
 |
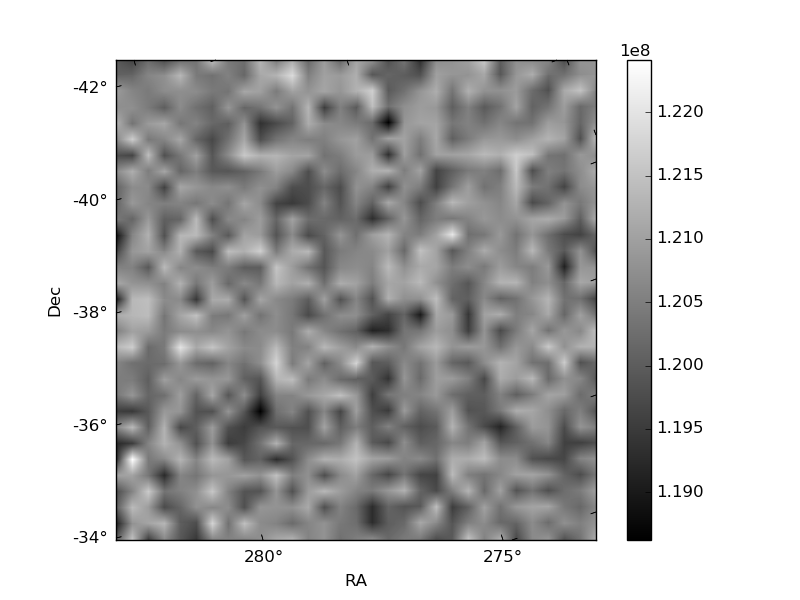
Quadrant B |
|---|---|---|---|
| Quadrant D | 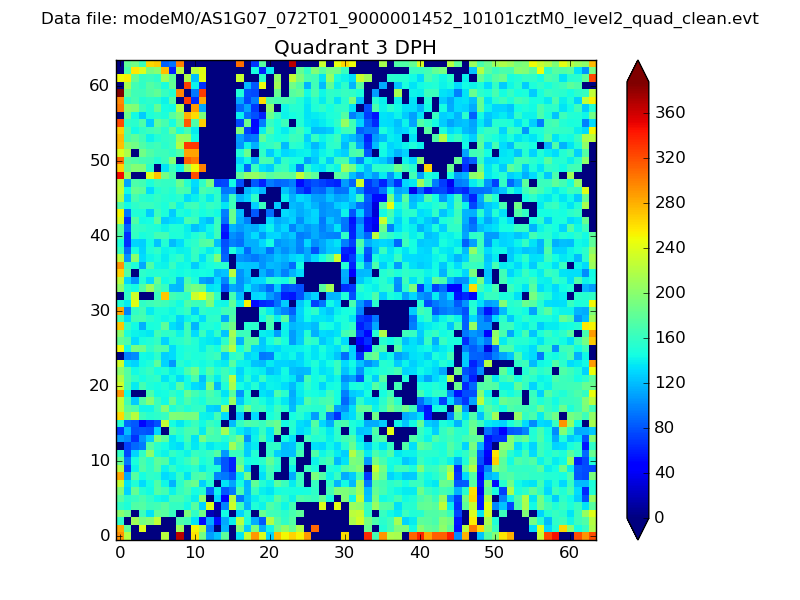 |
 |
Quadrant C |
| Plot type | Count rate plots | Images |
|---|---|---|
| Comparison with Poisson distribution Blue bars denote a histogram of data divided into 1 sec bins. Red curve is a Poisson curve with rate = median count rate of data. |
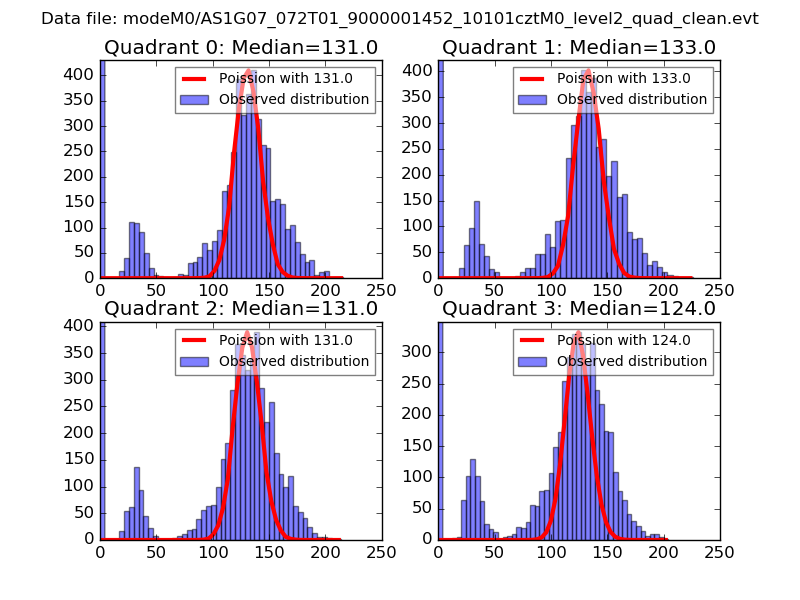 |
 |
| Quadrant-wise count rates Data is divided into 100 sec bins |
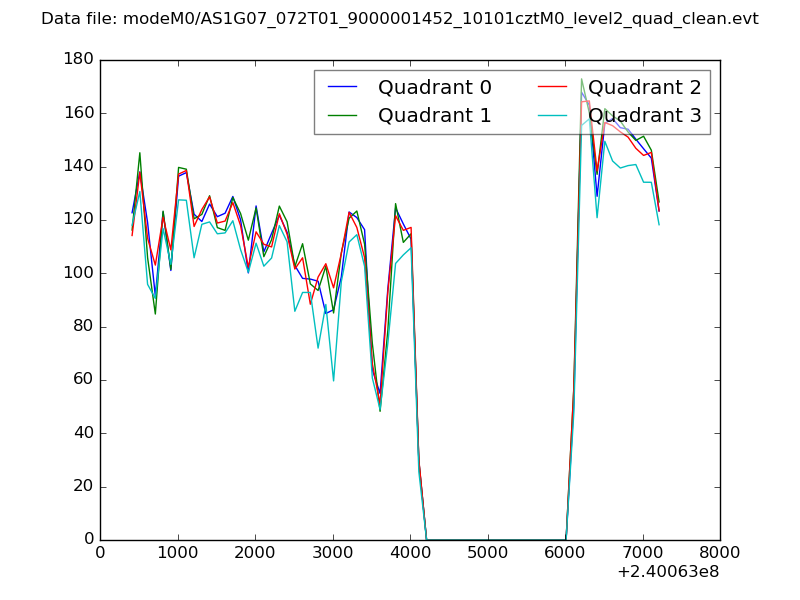 |
|
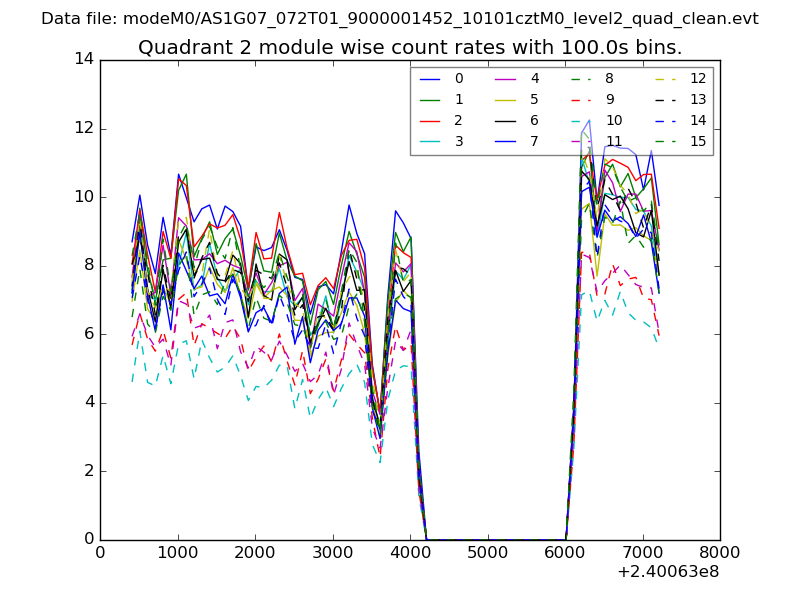
| Module-wise count rates for Quadrant A Data is divided into 100 sec bins |
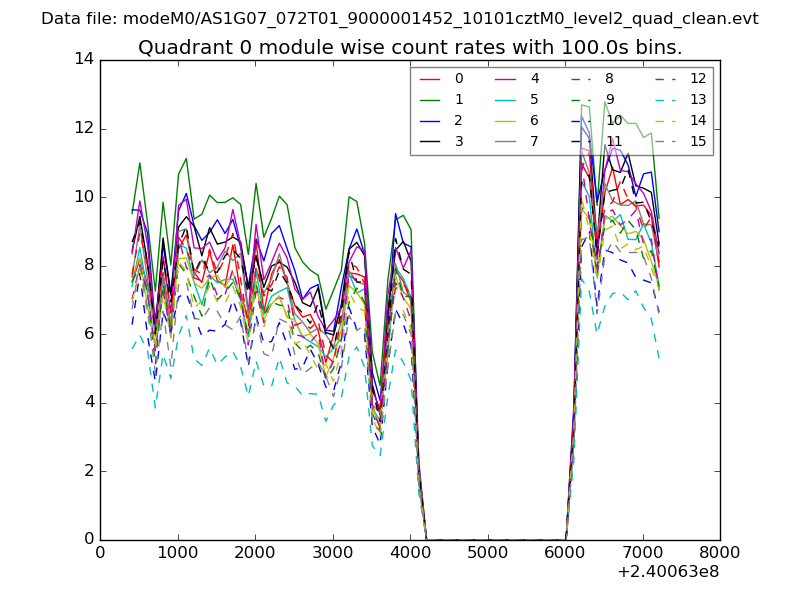 |
 |
| Module-wise count rates for Quadrant B Data is divided into 100 sec bins |
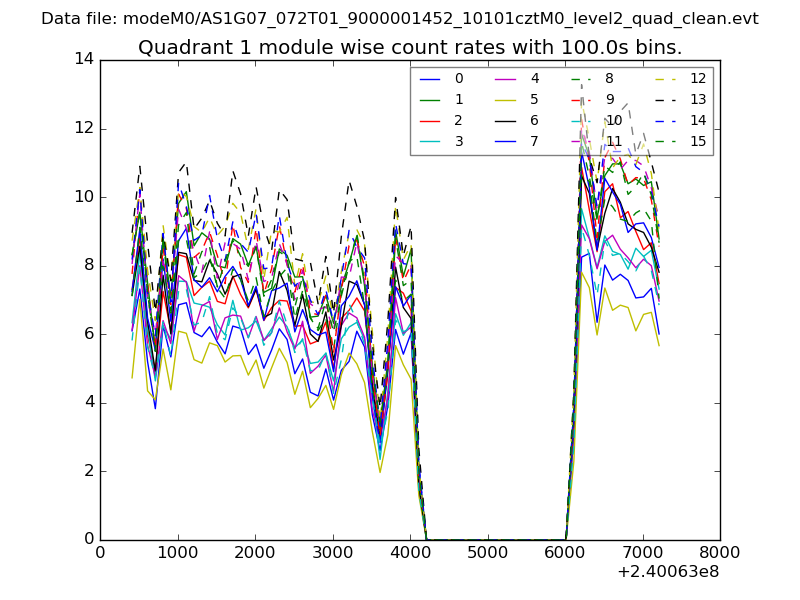 |
 |
| Module-wise count rates for Quadrant C Data is divided into 100 sec bins |
 |
 |
| Module-wise count rates for Quadrant D Data is divided into 100 sec bins |
 |
 |
| Parameter | Plot |
|---|---|
| CZT HV Monitor | 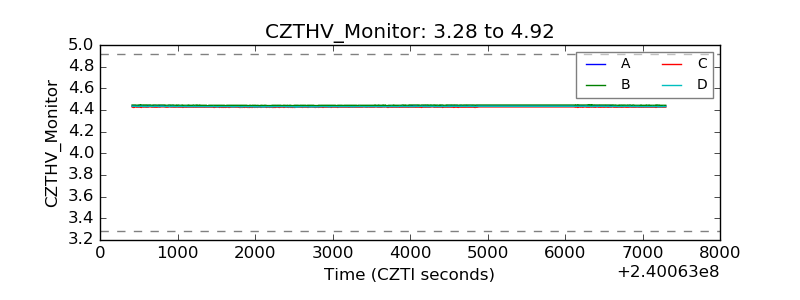 |
| D_VDD | 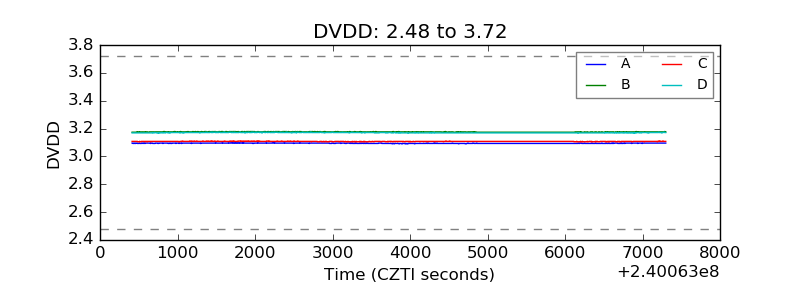 |
| Temperature 1 | 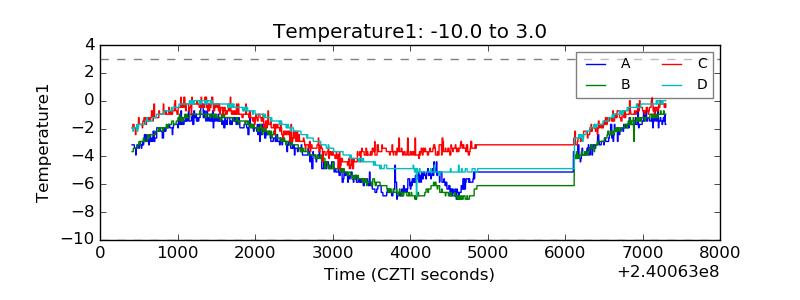 |
| Veto HV Monitor | 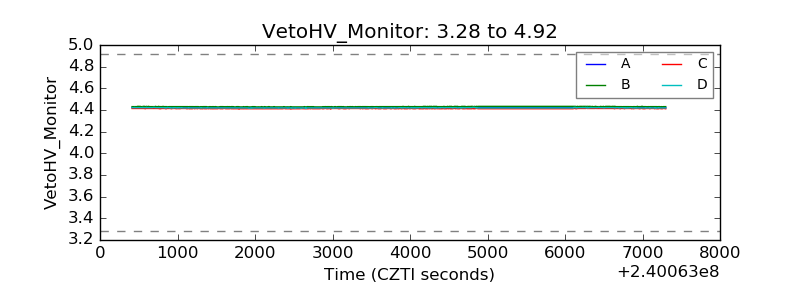 |
| Veto LLD | 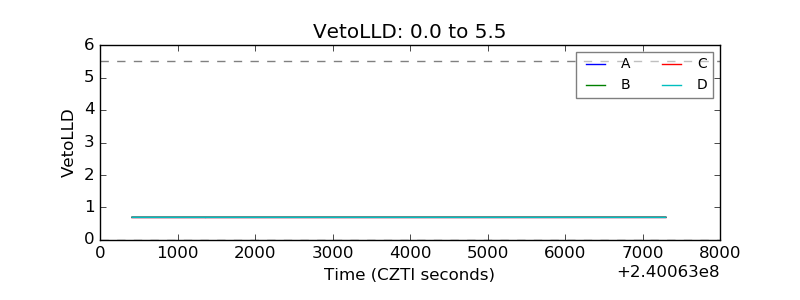 |
| Alpha Counter | 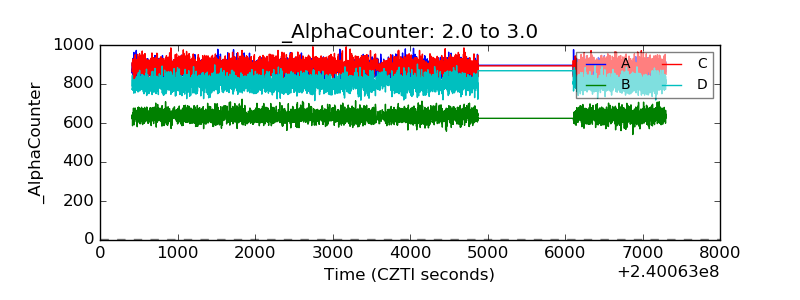 |
| _CPM_Rate | 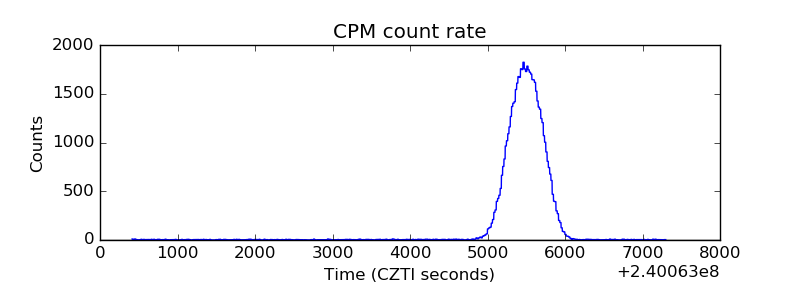 |
| CZT Counter | 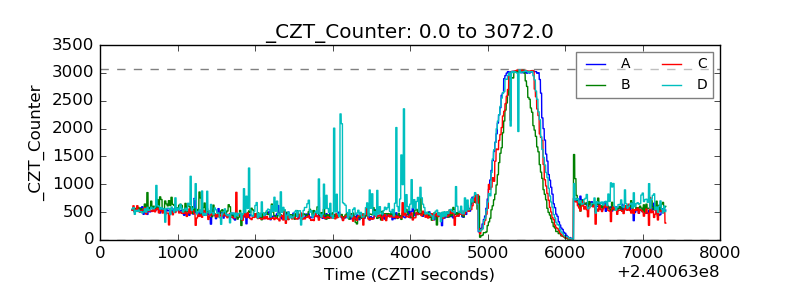 |
| +2.5 Volts monitor |  |
| +5 Volts monitor |  |
| _ROLL_ROT | 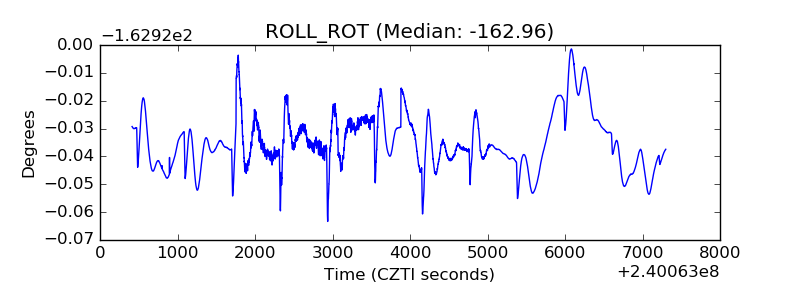 |
| _Roll_DEC | 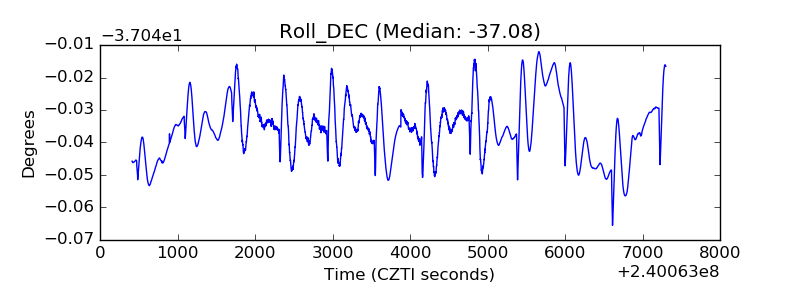 |
| _Roll_RA | 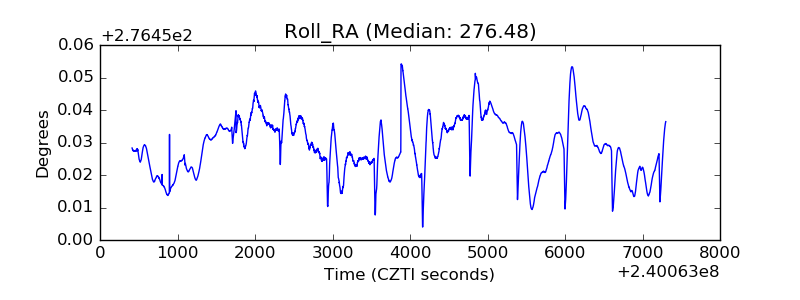 |
| Veto Counter | 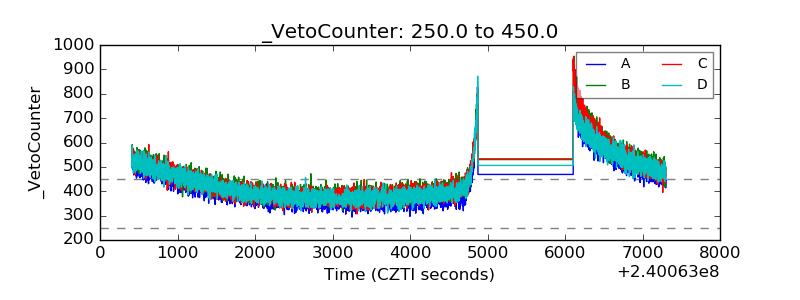 |