| Param | Original file | Final file |
|---|---|---|
| Filename | modeM0/AS1G07_072T01_9000001452_10102cztM0_level2.evt | modeM0/AS1G07_072T01_9000001452_10102cztM0_level2_quad_clean.evt |
| Size (bytes) | 480,188,160 | 113,863,680 |
| Size | 457.9 MB | 108.6 MB |
| Events in quadrant A | 3,222,031 | 763,722 |
| Events in quadrant B | 3,669,935 | 767,682 |
| Events in quadrant C | 3,101,988 | 751,286 |
| Events in quadrant D | 4,111,475 | 716,751 |
| Mode SS | |||
|---|---|---|---|
| Quadrant | BADHDUFLAG | Total packets | Discarded packets |
| A | 0 | 130 | 0 |
| B | 0 | 130 | 0 |
| C | 0 | 130 | 0 |
| D | 0 | 130 | 0 |
| Mode M0 | |||
|---|---|---|---|
| Quadrant | BADHDUFLAG | Total packets | Discarded packets |
| A | 0 | 13805 | 3 |
| B | 0 | 15180 | 2 |
| C | 0 | 13505 | 2 |
| D | 0 | 16707 | 2 |
| Mode M9 | |||
|---|---|---|---|
| Quadrant | BADHDUFLAG | Total packets | Discarded packets |
| A | 0 | 13 | 0 |
| B | 0 | 13 | 0 |
| C | 0 | 13 | 0 |
| D | 0 | 14 | 0 |
| Quadrant | Total seconds | Saturated seconds | Saturation percentage |
|---|---|---|---|
| A | 6443 | 69 | 1.070930% |
| B | 6443 | 114 | 1.769362% |
| C | 6443 | 43 | 0.667391% |
| D | 6443 | 71 | 1.101971% |
Noise dominated data is calculated using 1-second bins in cleaned event files. If a bin has >2000 counts, and if more than 50% of those come from <1% of pixels, then it is considered to be noise-dominated and hence unusable.
| Quadrant | # 1 sec bins | Bins with >0 counts | Bins with >2000 counts | High rate bins dominated by noise | Noise dominated (total time) | Noise dominated (detector-on time) | Marked lightcurve |
|---|---|---|---|---|---|---|---|
| A | 7733 | 6443 | 0 | 0 | 0.00% | 0.00% | 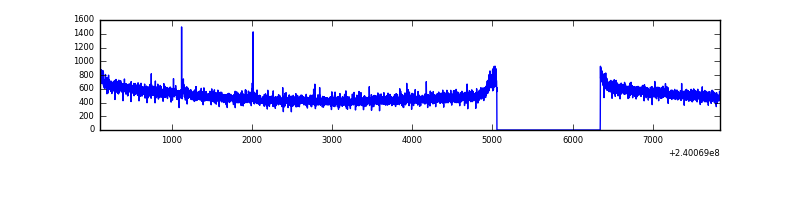 |
| B | 7733 | 6444 | 20 | 20 | 0.26% | 0.31% | 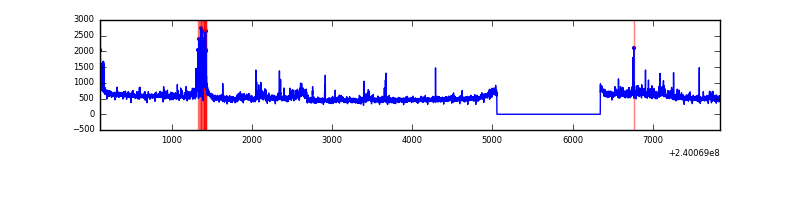 |
| C | 7733 | 6443 | 0 | 0 | 0.00% | 0.00% | 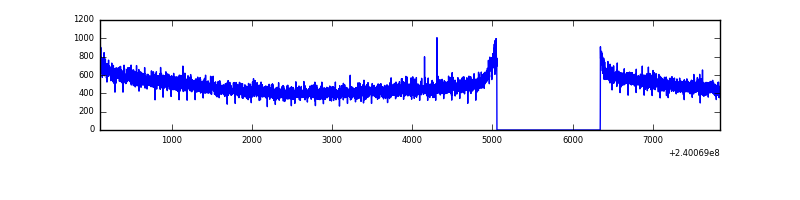 |
| D | 7733 | 6443 | 14 | 14 | 0.18% | 0.22% | 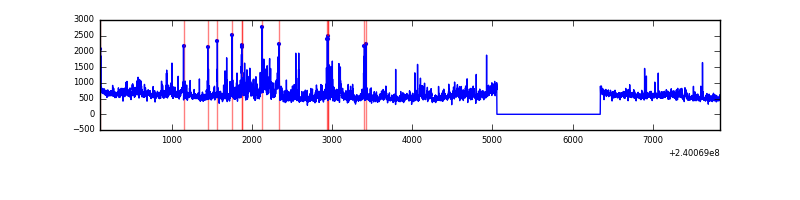 |
Top three noisy pixels from each quadrant. If the there are fewer than three noisy pixels in the level2.evt file, extra rows are filled as -1
| Pixel properties | Quadrant properties | ||||||
|---|---|---|---|---|---|---|---|
| Quadrant | DetID | PixID | Counts | Sigma | Mean | Median | Sigma |
| A | 15 | 174 | 9163 | 49.6 | 835 | 819 | 168.2 |
| A | 0 | 226 | 8002 | 42.7 | 835 | 819 | 168.2 |
| A | 12 | 194 | 7215 | 38.02 | 835 | 819 | 168.2 |
| B | 4 | 81 | 132926 | 848.49 | 829 | 814 | 155.7 |
| B | 0 | 219 | 105360 | 671.45 | 829 | 814 | 155.7 |
| B | 0 | 214 | 104724 | 667.36 | 829 | 814 | 155.7 |
| C | 13 | 61 | 5956 | 28.5 | 792 | 797 | 181.0 |
| C | 14 | 67 | 5505 | 26.01 | 792 | 797 | 181.0 |
| C | 9 | 15 | 3764 | 16.39 | 792 | 797 | 181.0 |
| D | 0 | 11 | 526007 | 2714.84 | 800 | 780 | 193.5 |
| D | 1 | 52 | 182345 | 938.49 | 800 | 780 | 193.5 |
| D | 8 | 195 | 86255 | 441.81 | 800 | 780 | 193.5 |
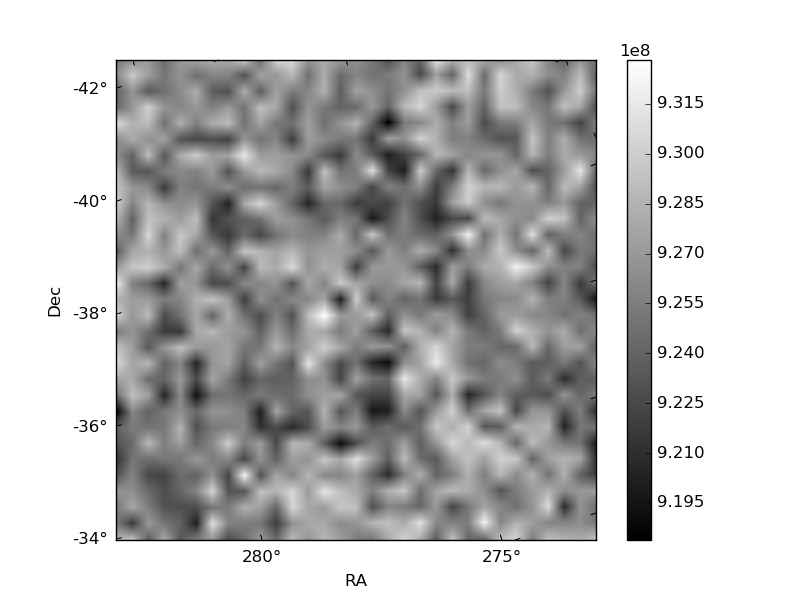
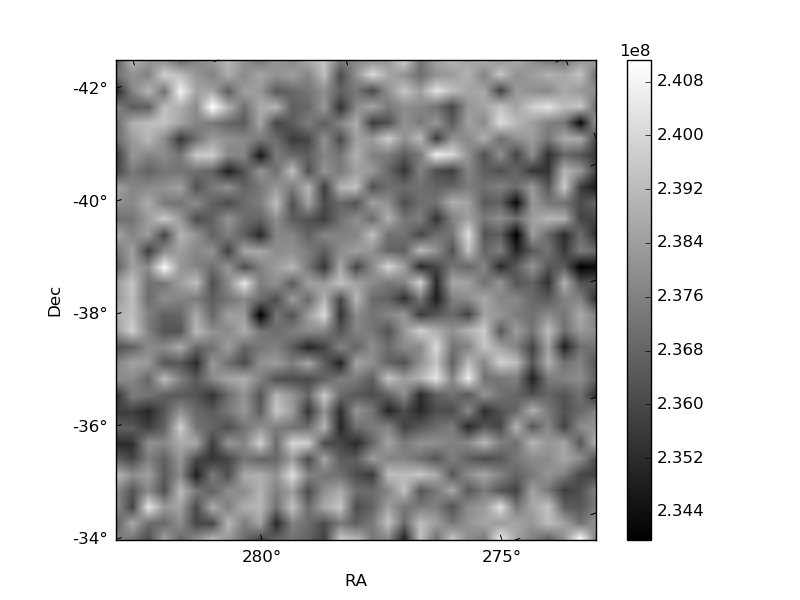
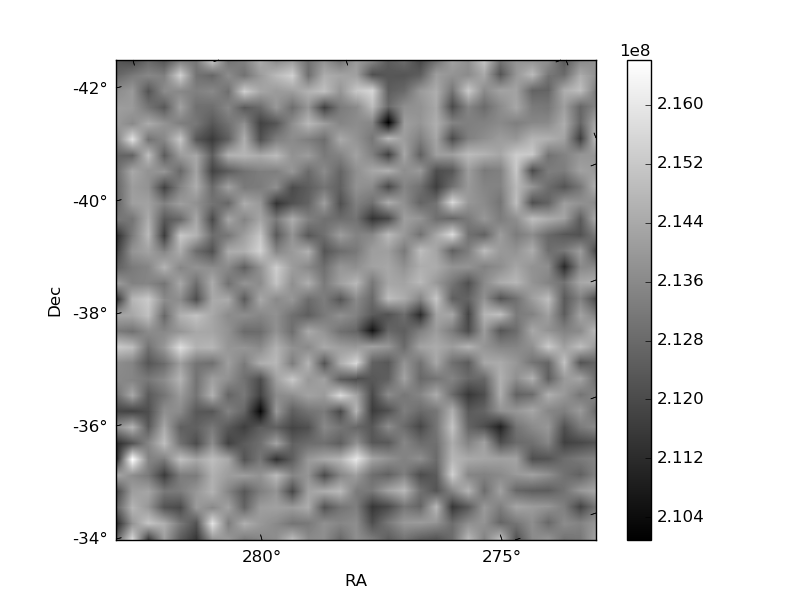
Histogram calculated using DETX and DETY for each event in the final _common_clean file
| Quadrant A | 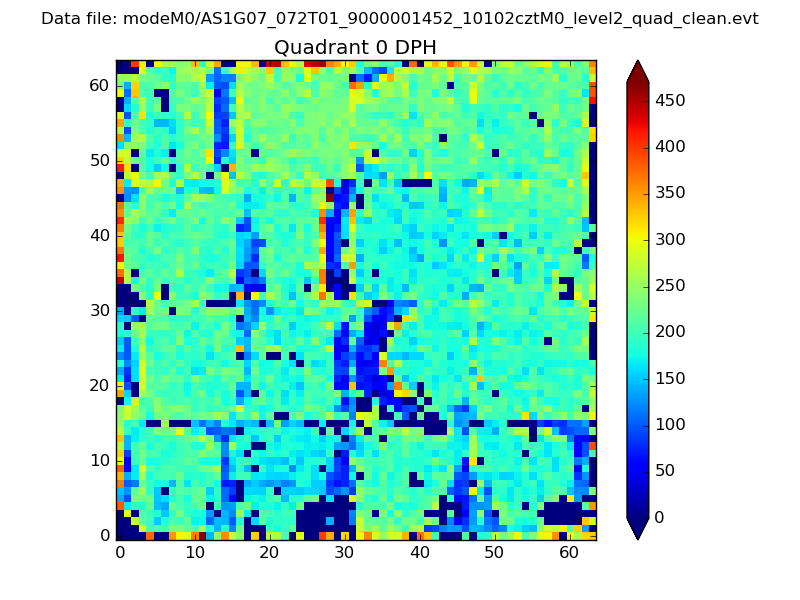 |
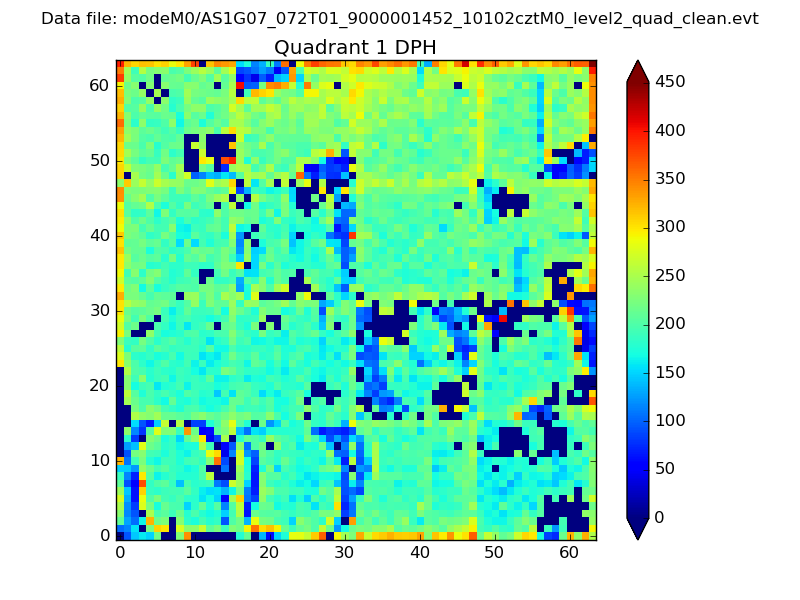 |
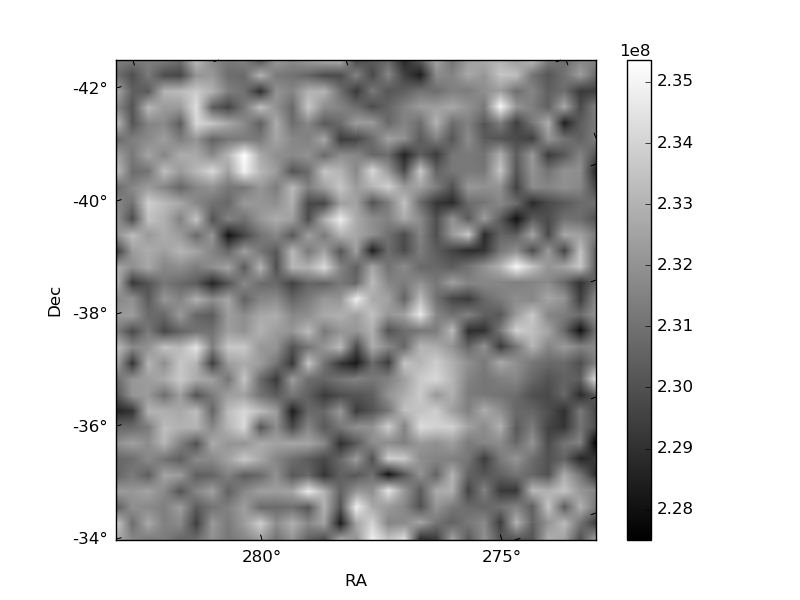
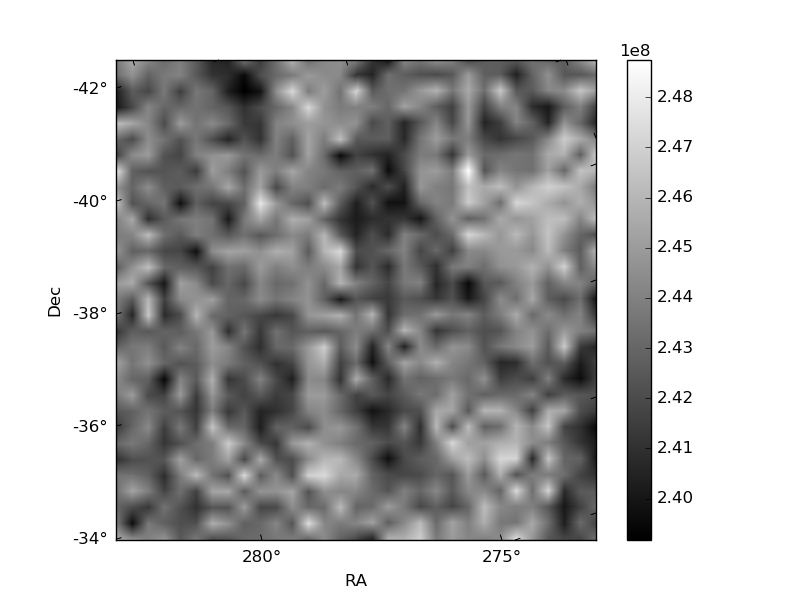
Quadrant B |
|---|---|---|---|
| Quadrant D | 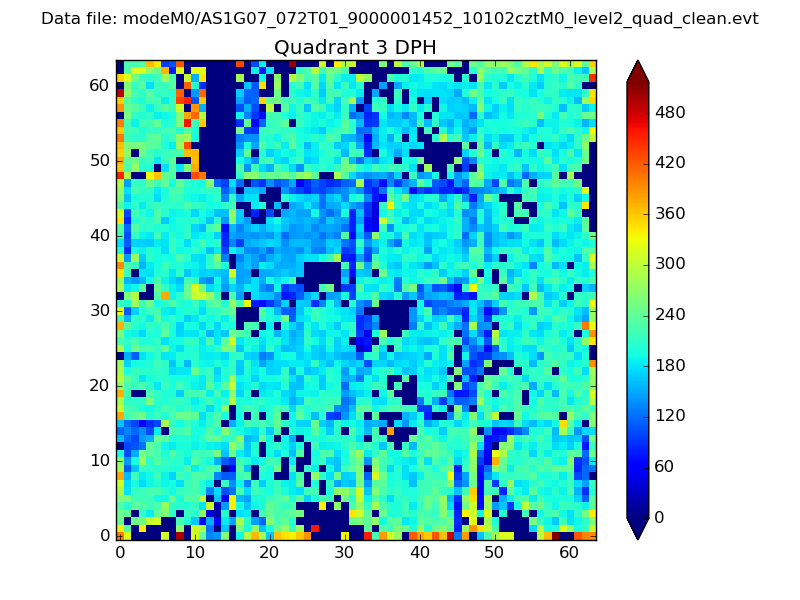 |
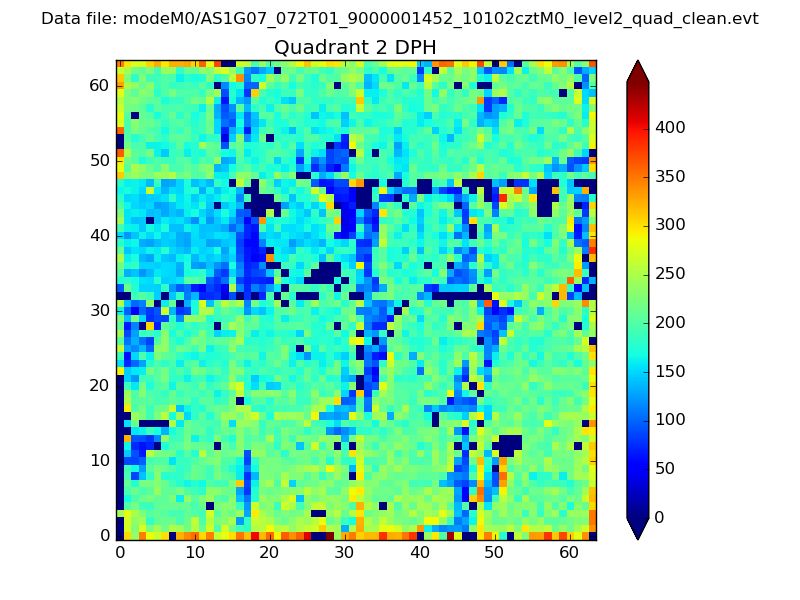 |
Quadrant C |
| Plot type | Count rate plots | Images |
|---|---|---|
| Comparison with Poisson distribution Blue bars denote a histogram of data divided into 1 sec bins. Red curve is a Poisson curve with rate = median count rate of data. |
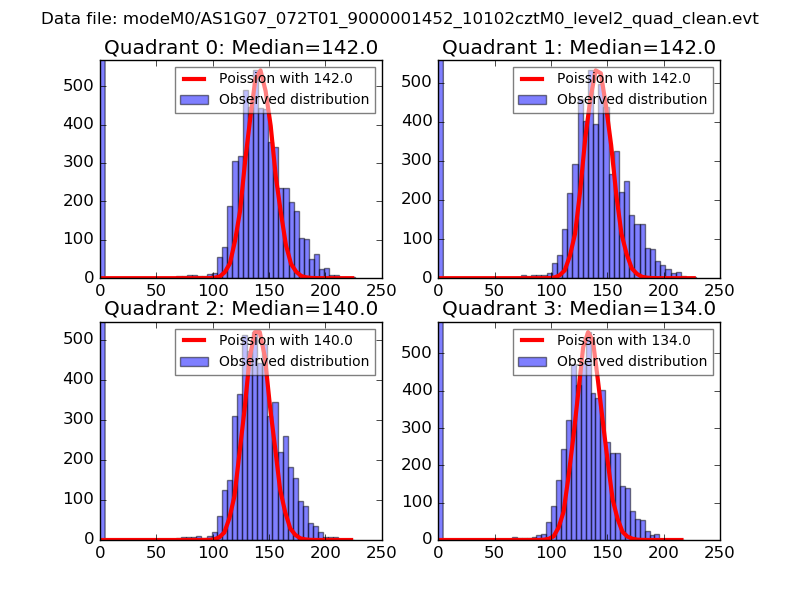 |
 |
| Quadrant-wise count rates Data is divided into 100 sec bins |
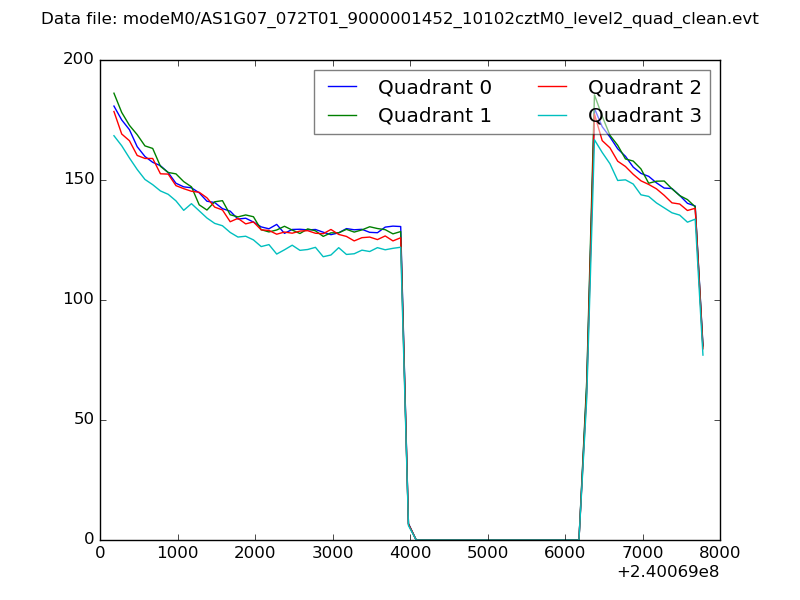 |
|
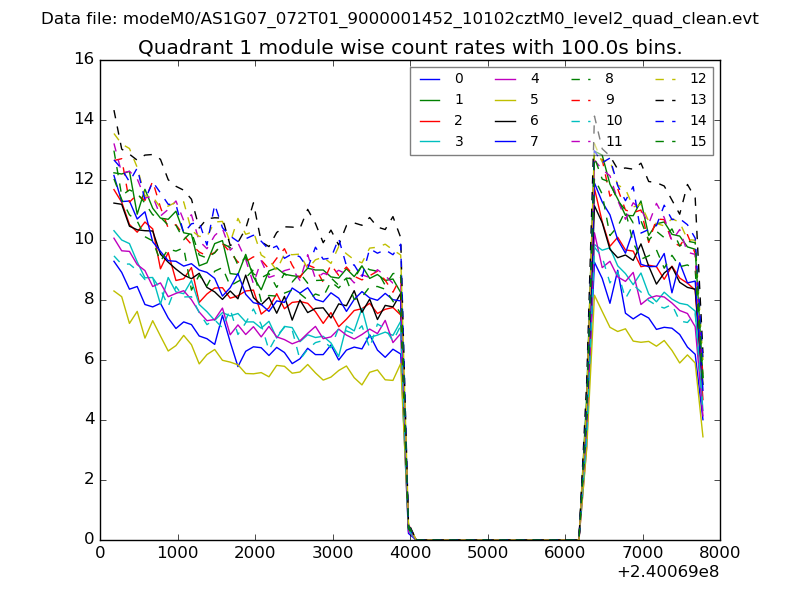
| Module-wise count rates for Quadrant A Data is divided into 100 sec bins |
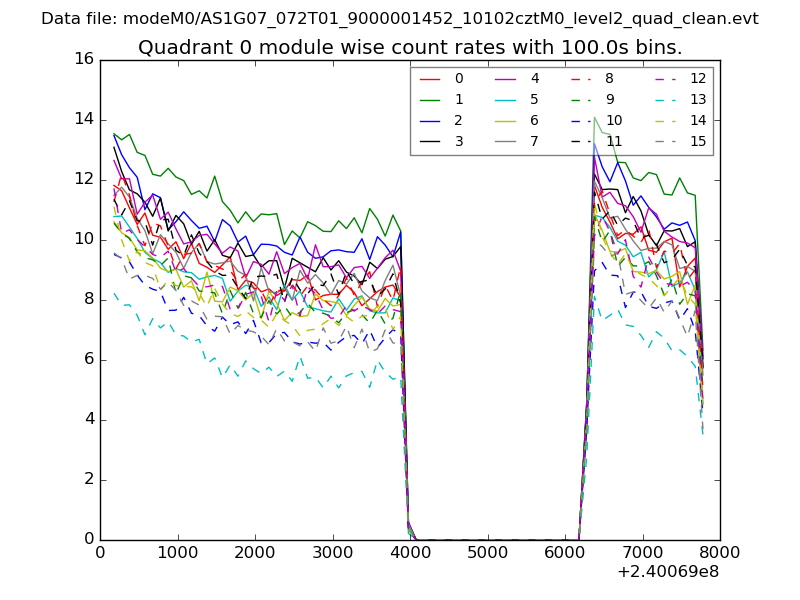 |
 |
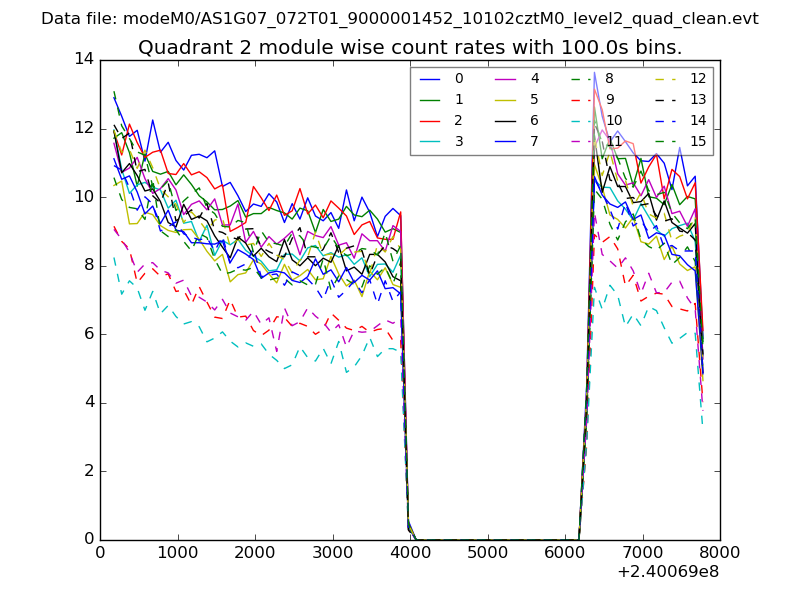
| Module-wise count rates for Quadrant B Data is divided into 100 sec bins |
 |
 |
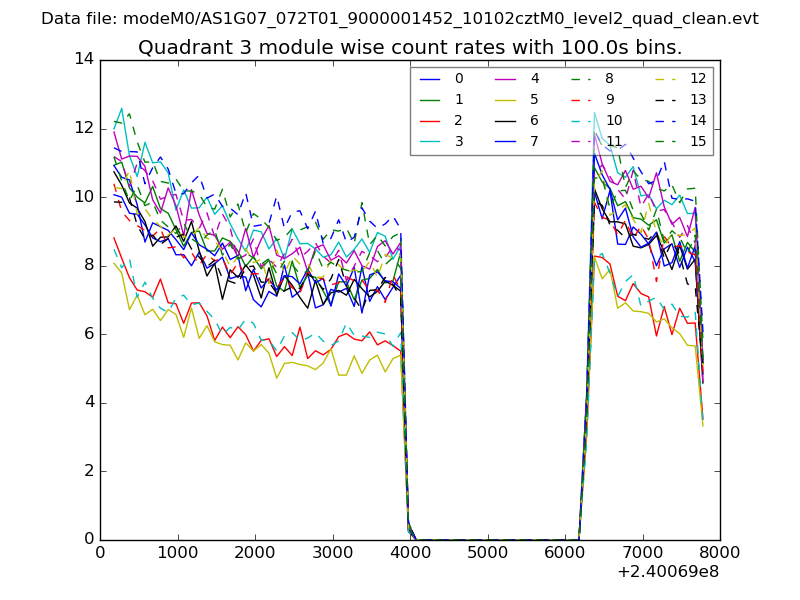
| Module-wise count rates for Quadrant C Data is divided into 100 sec bins |
 |
 |
| Module-wise count rates for Quadrant D Data is divided into 100 sec bins |
 |
 |
| Parameter | Plot |
|---|---|
| CZT HV Monitor | 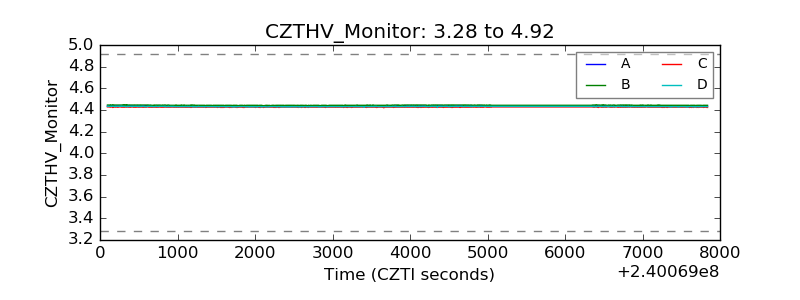 |
| D_VDD | 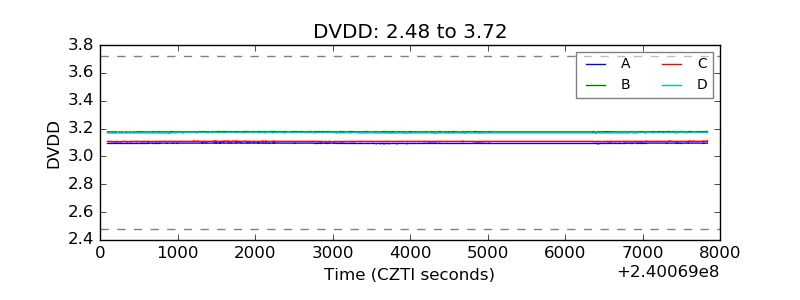 |
| Temperature 1 | 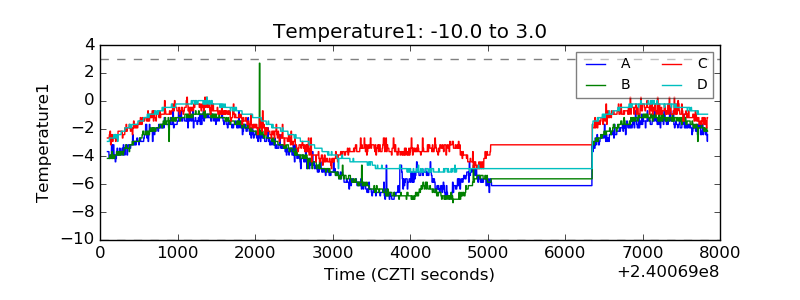 |
| Veto HV Monitor | 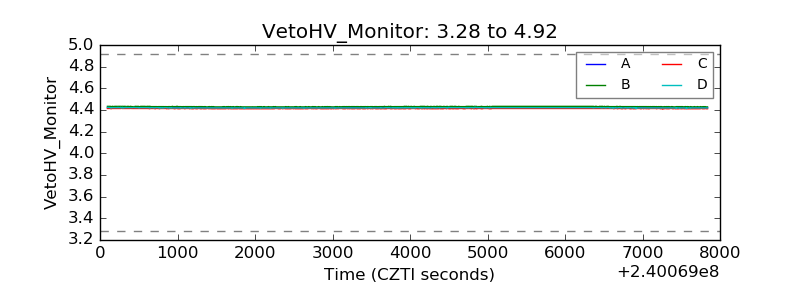 |
| Veto LLD | 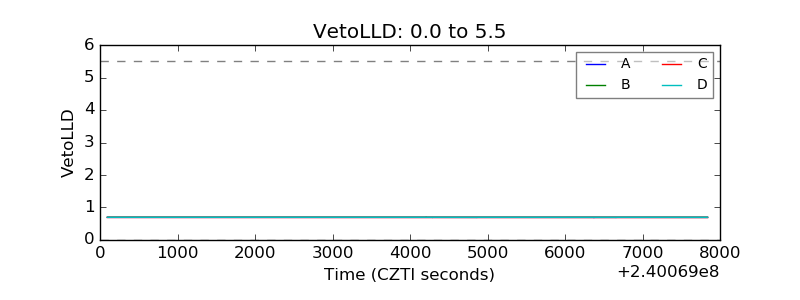 |
| Alpha Counter | 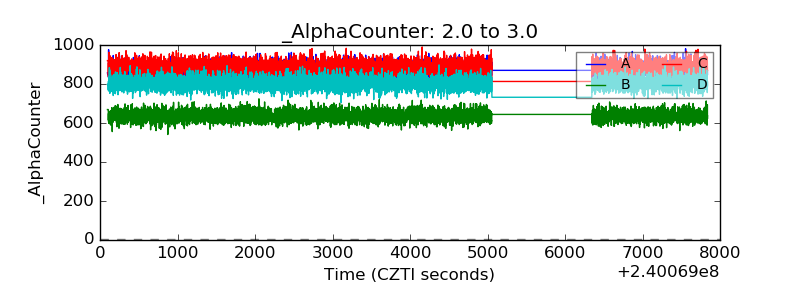 |
| _CPM_Rate | 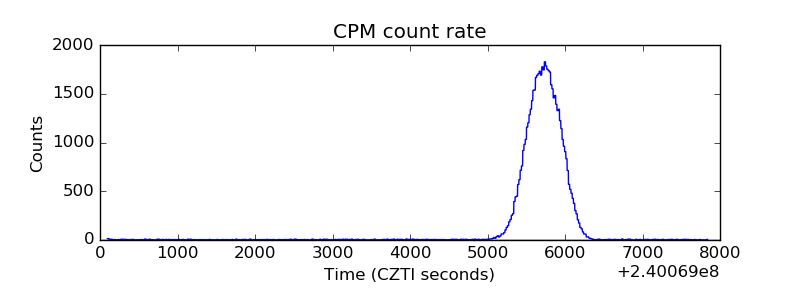 |
| CZT Counter | 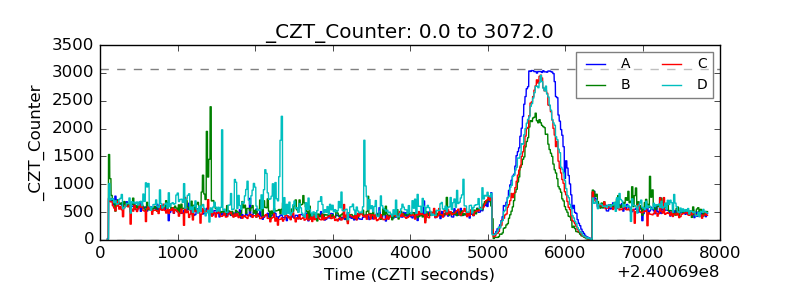 |
| +2.5 Volts monitor |  |
| +5 Volts monitor |  |
| _ROLL_ROT | 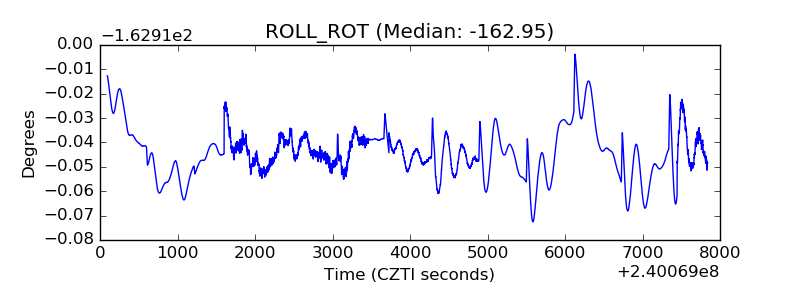 |
| _Roll_DEC | 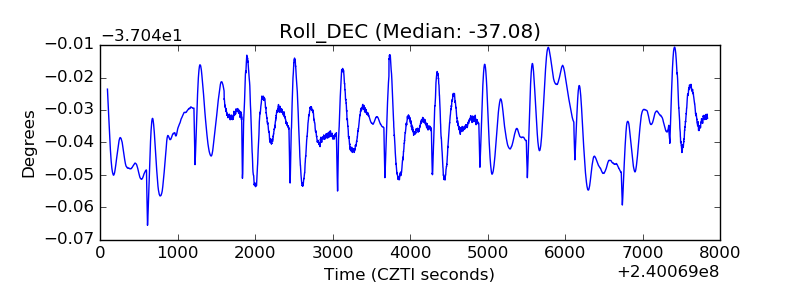 |
| _Roll_RA | 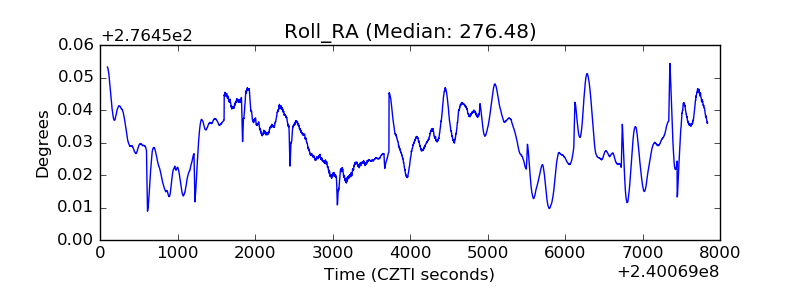 |
| Veto Counter | 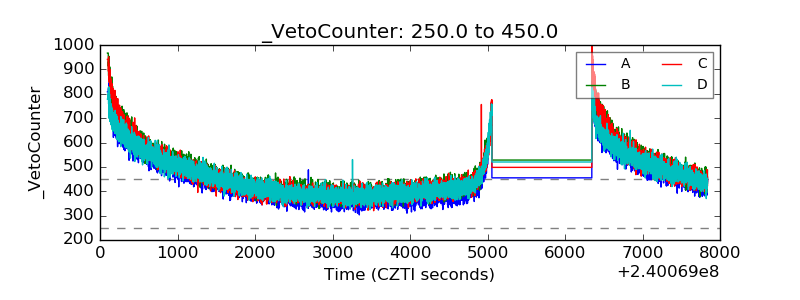 |