| Param | Original file | Final file |
|---|---|---|
| Filename | modeM0/AS1G07_072T01_9000001452_10104cztM0_level2.evt | modeM0/AS1G07_072T01_9000001452_10104cztM0_level2_quad_clean.evt |
| Size (bytes) | 125,971,200 | 35,809,920 |
| Size | 120.1 MB | 34.2 MB |
| Events in quadrant A | 864,916 | 242,772 |
| Events in quadrant B | 919,276 | 247,735 |
| Events in quadrant C | 819,181 | 241,066 |
| Events in quadrant D | 1,091,714 | 226,024 |
| Mode SS | |||
|---|---|---|---|
| Quadrant | BADHDUFLAG | Total packets | Discarded packets |
| A | 0 | 34 | 0 |
| B | 0 | 34 | 0 |
| C | 0 | 34 | 0 |
| D | 0 | 34 | 0 |
| Mode M0 | |||
|---|---|---|---|
| Quadrant | BADHDUFLAG | Total packets | Discarded packets |
| A | 0 | 3623 | 1 |
| B | 0 | 3826 | 1 |
| C | 0 | 3549 | 1 |
| D | 0 | 4360 | 1 |
| Mode M9 | |||
|---|---|---|---|
| Quadrant | BADHDUFLAG | Total packets | Discarded packets |
| A | 0 | 6 | 0 |
| B | 0 | 6 | 0 |
| C | 0 | 6 | 0 |
| D | 0 | 7 | 0 |
| Quadrant | Total seconds | Saturated seconds | Saturation percentage |
|---|---|---|---|
| A | 1726 | 4 | 0.231750% |
| B | 1726 | 10 | 0.579374% |
| C | 1726 | 1 | 0.057937% |
| D | 1726 | 37 | 2.143685% |
Noise dominated data is calculated using 1-second bins in cleaned event files. If a bin has >2000 counts, and if more than 50% of those come from <1% of pixels, then it is considered to be noise-dominated and hence unusable.
| Quadrant | # 1 sec bins | Bins with >0 counts | Bins with >2000 counts | High rate bins dominated by noise | Noise dominated (total time) | Noise dominated (detector-on time) | Marked lightcurve |
|---|---|---|---|---|---|---|---|
| A | 1726 | 1726 | 0 | 0 | 0.00% | 0.00% | 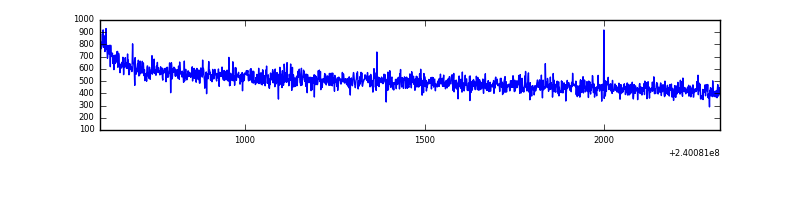 |
| B | 1726 | 1726 | 3 | 3 | 0.17% | 0.17% | 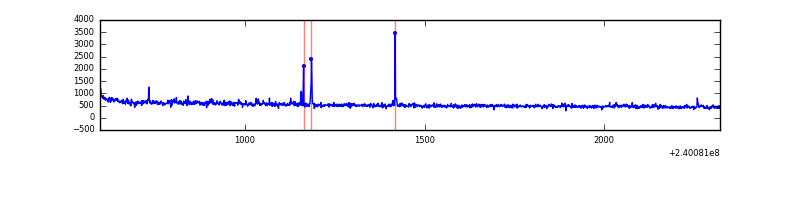 |
| C | 1726 | 1726 | 0 | 0 | 0.00% | 0.00% | 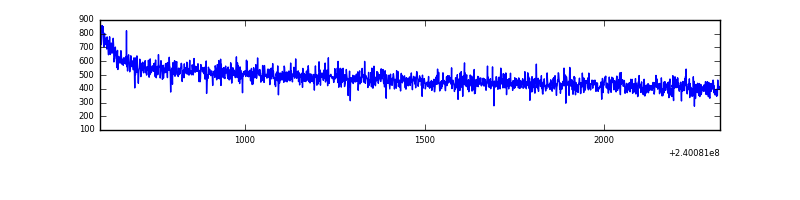 |
| D | 1726 | 1726 | 32 | 32 | 1.85% | 1.85% | 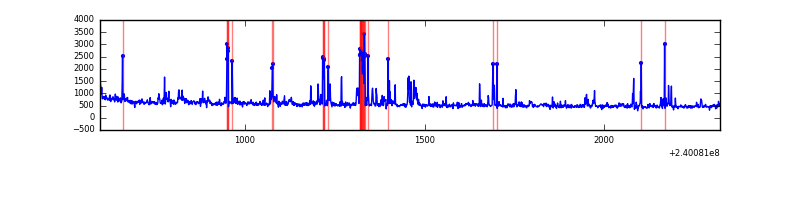 |
Top three noisy pixels from each quadrant. If the there are fewer than three noisy pixels in the level2.evt file, extra rows are filled as -1
| Pixel properties | Quadrant properties | ||||||
|---|---|---|---|---|---|---|---|
| Quadrant | DetID | PixID | Counts | Sigma | Mean | Median | Sigma |
| A | 0 | 226 | 2181 | 41.69 | 224 | 219 | 47.1 |
| A | 12 | 194 | 1982 | 37.46 | 224 | 219 | 47.1 |
| A | 3 | 1 | 931 | 15.13 | 224 | 219 | 47.1 |
| B | 0 | 246 | 15989 | 359.2 | 221 | 217 | 43.9 |
| B | 0 | 214 | 12237 | 273.75 | 221 | 217 | 43.9 |
| B | 0 | 219 | 10871 | 242.64 | 221 | 217 | 43.9 |
| C | 4 | 175 | 2811 | 52.72 | 208 | 209 | 49.4 |
| C | 13 | 61 | 1559 | 27.35 | 208 | 209 | 49.4 |
| C | 14 | 67 | 1454 | 25.23 | 208 | 209 | 49.4 |
| D | 1 | 52 | 122056 | 2265.95 | 210 | 204 | 53.8 |
| D | 8 | 195 | 86462 | 1604.05 | 210 | 204 | 53.8 |
| D | 7 | 71 | 35334 | 653.27 | 210 | 204 | 53.8 |
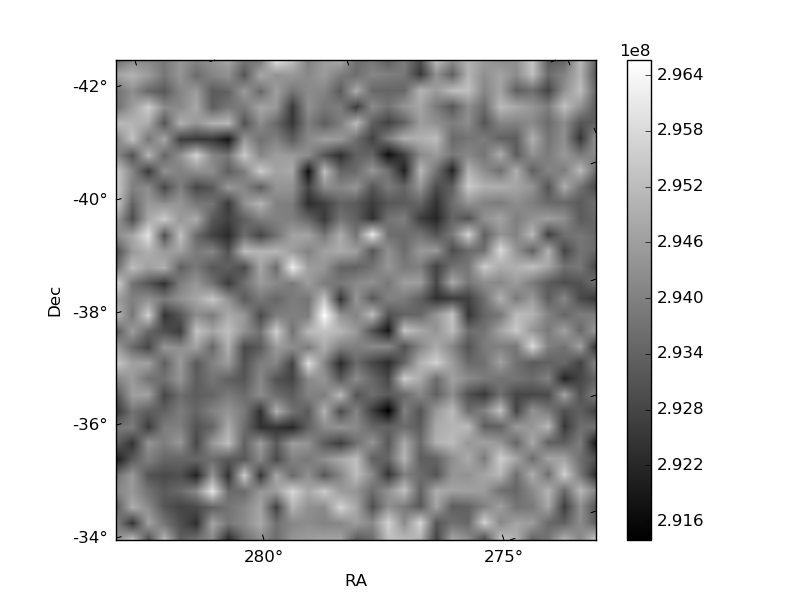
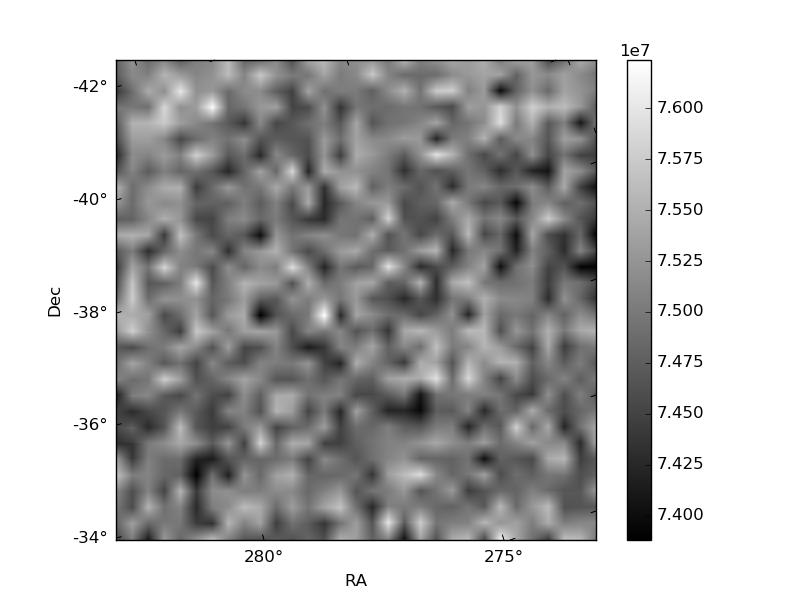
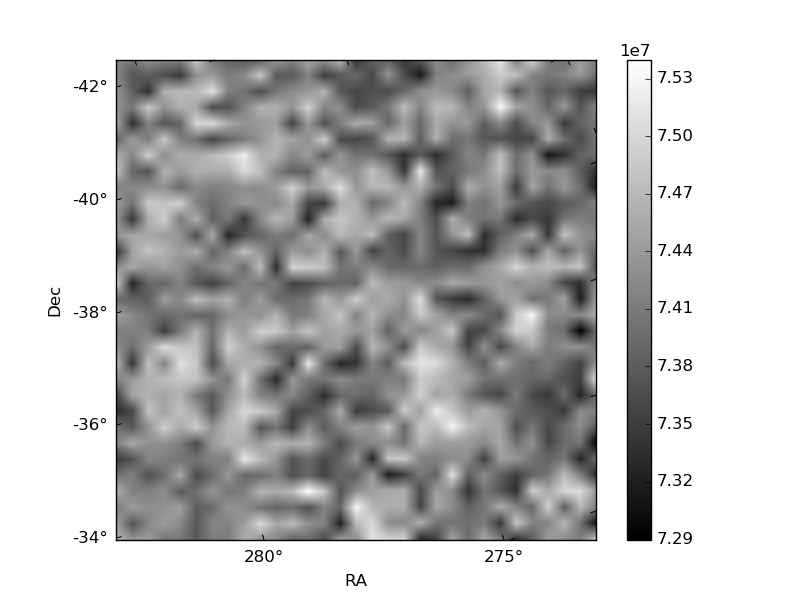
Histogram calculated using DETX and DETY for each event in the final _common_clean file
| Quadrant A | 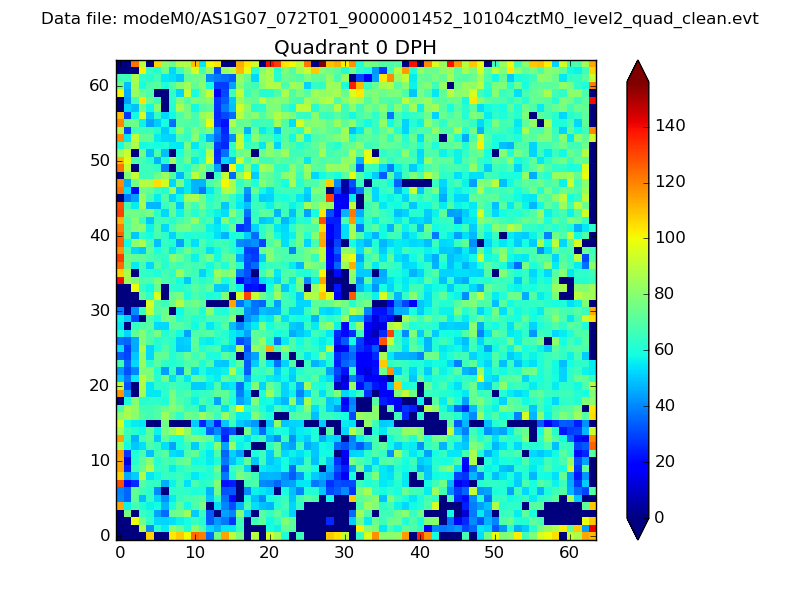 |
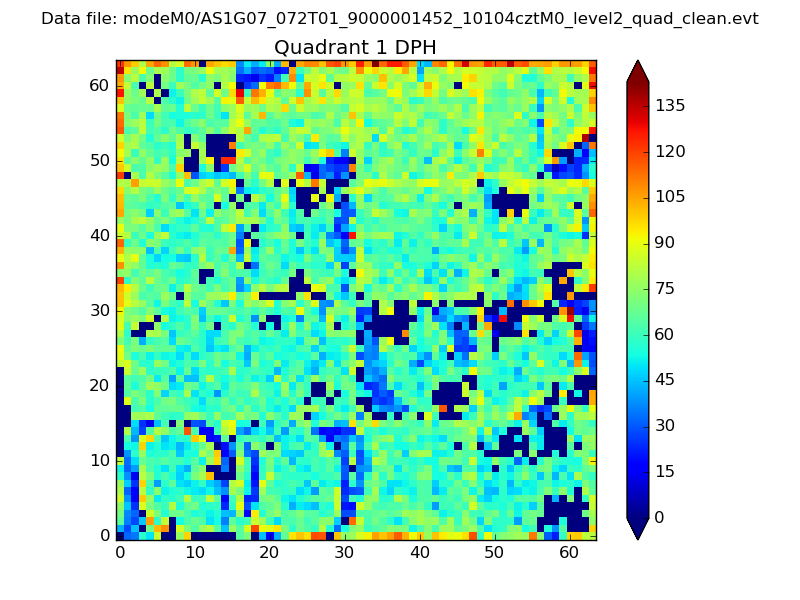 |
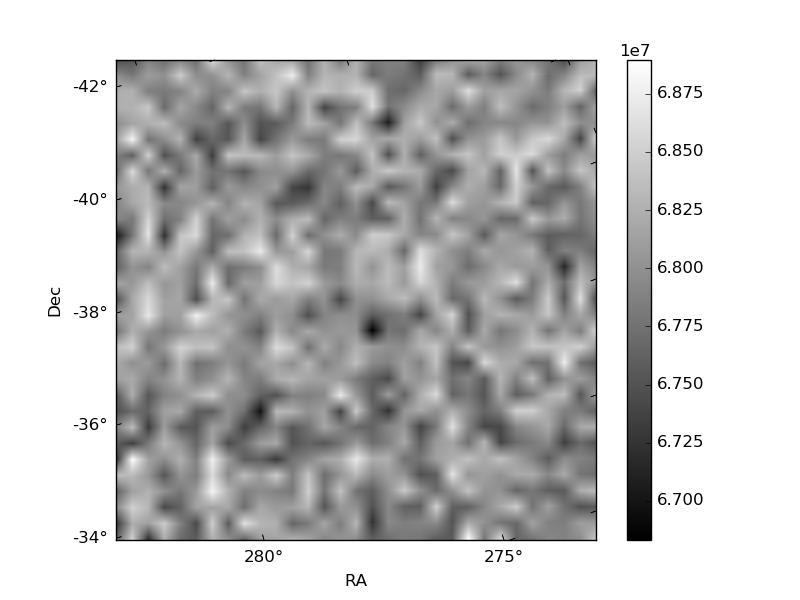
Quadrant B |
|---|---|---|---|
| Quadrant D | 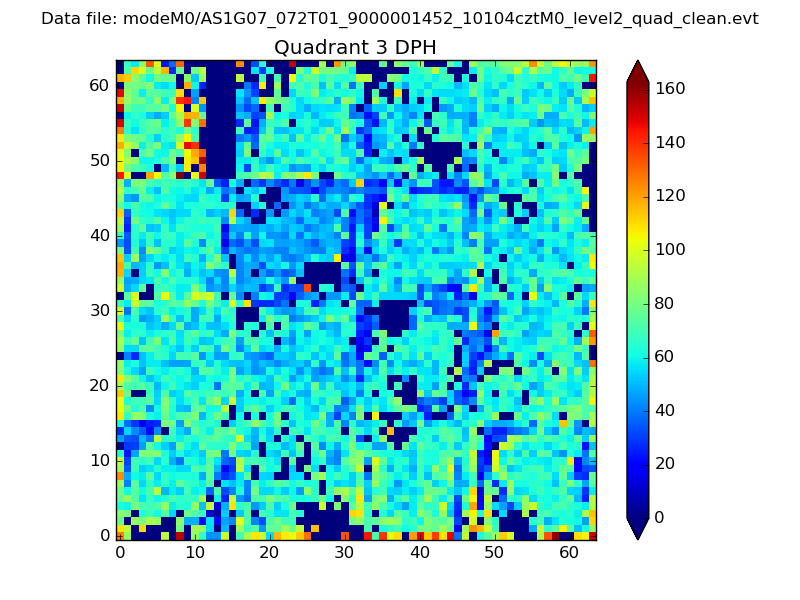 |
 |
Quadrant C |
| Plot type | Count rate plots | Images |
|---|---|---|
| Comparison with Poisson distribution Blue bars denote a histogram of data divided into 1 sec bins. Red curve is a Poisson curve with rate = median count rate of data. |
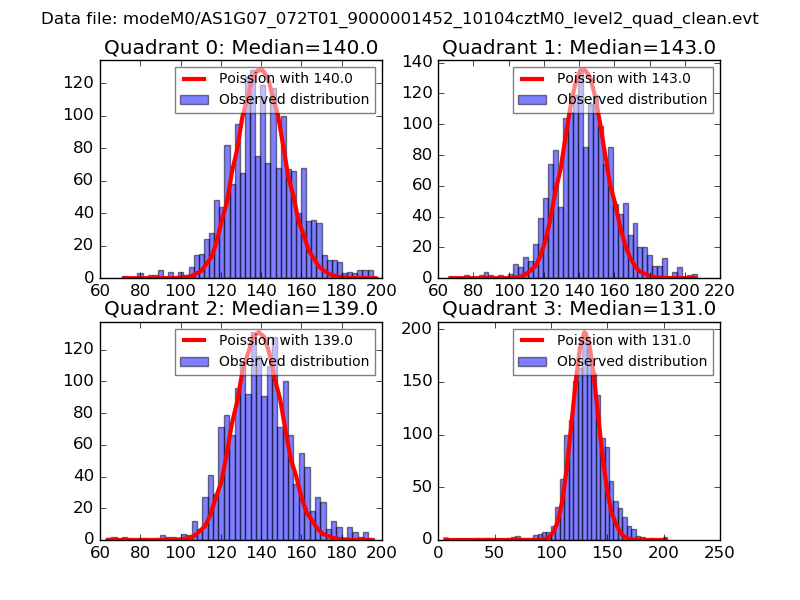 |
 |
| Quadrant-wise count rates Data is divided into 100 sec bins |
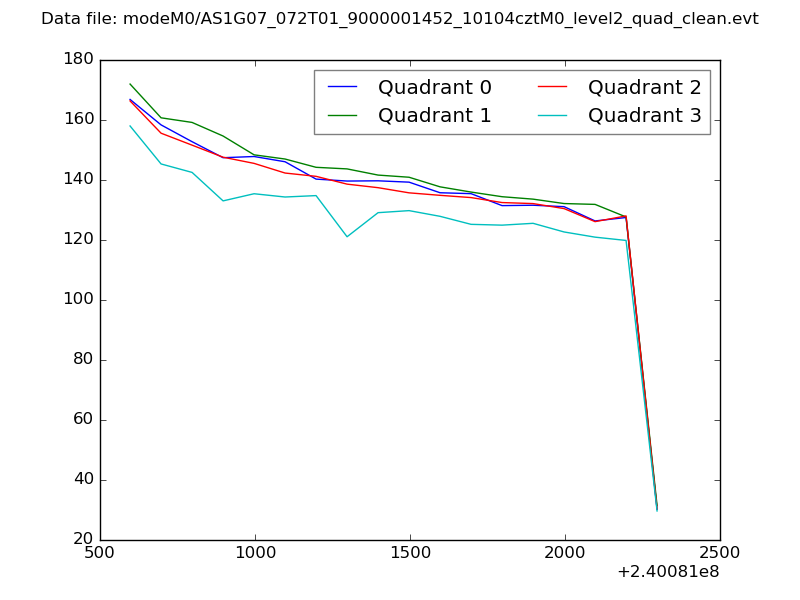 |
|
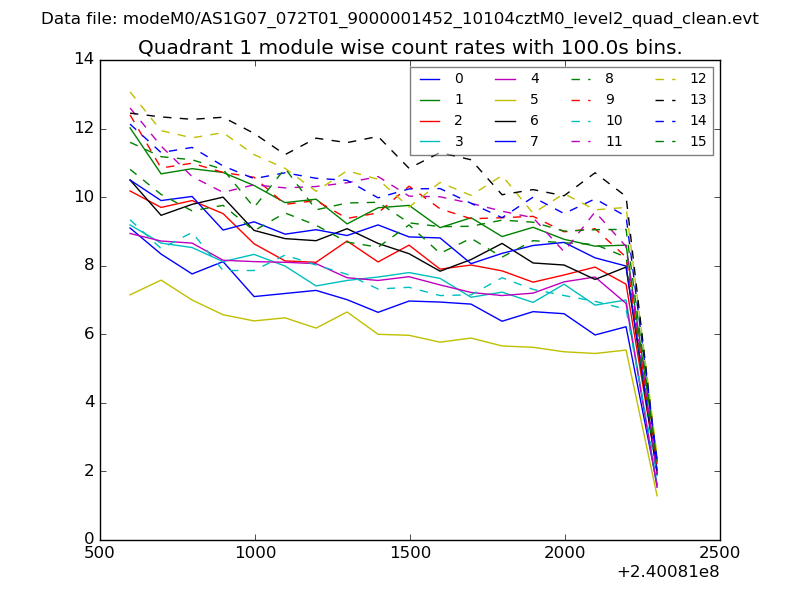
| Module-wise count rates for Quadrant A Data is divided into 100 sec bins |
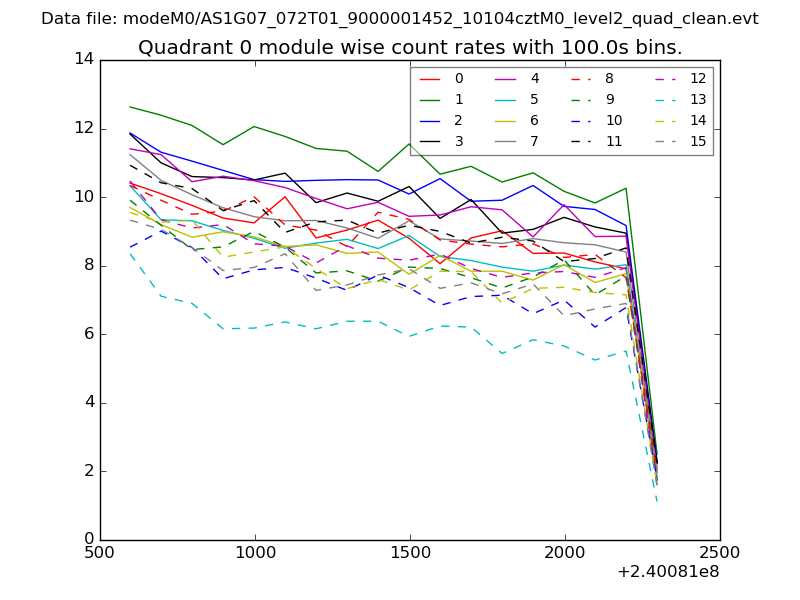 |
 |
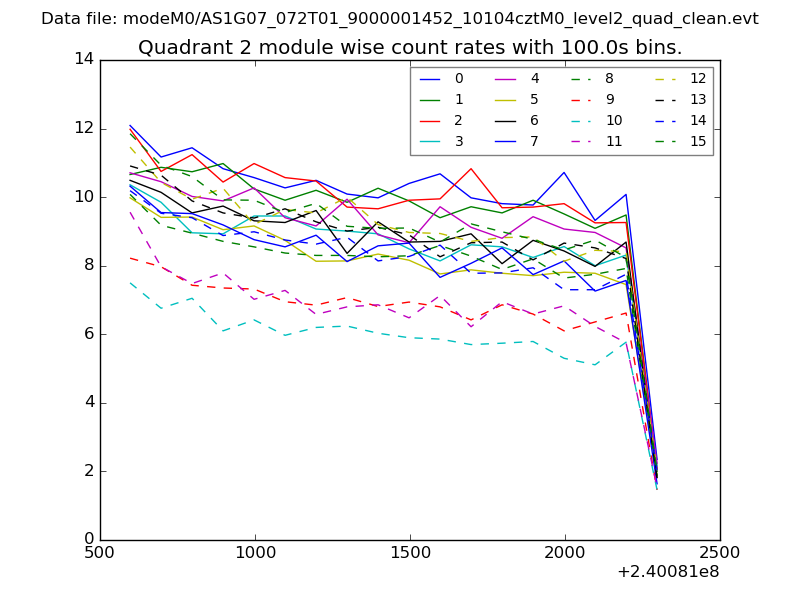
| Module-wise count rates for Quadrant B Data is divided into 100 sec bins |
 |
 |
| Module-wise count rates for Quadrant C Data is divided into 100 sec bins |
 |
 |
| Module-wise count rates for Quadrant D Data is divided into 100 sec bins |
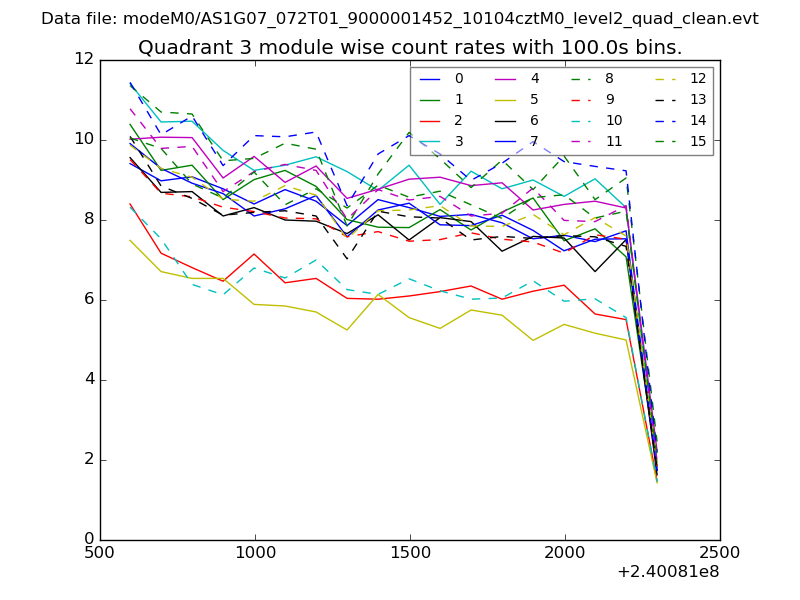 |
 |
| Parameter | Plot |
|---|---|
| CZT HV Monitor | 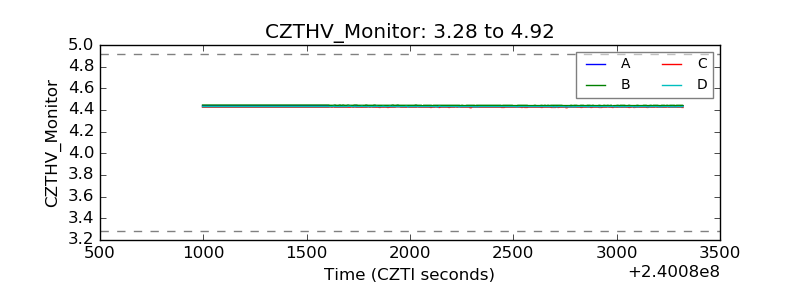 |
| D_VDD | 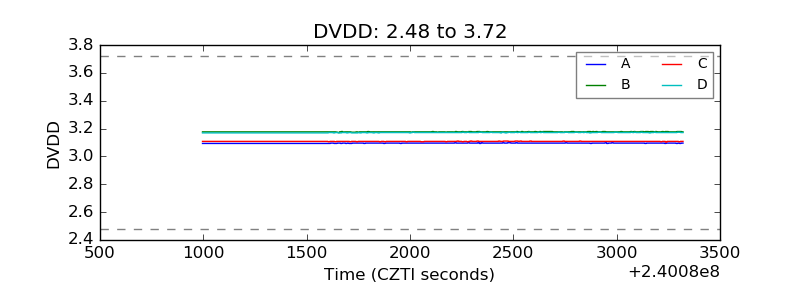 |
| Temperature 1 | 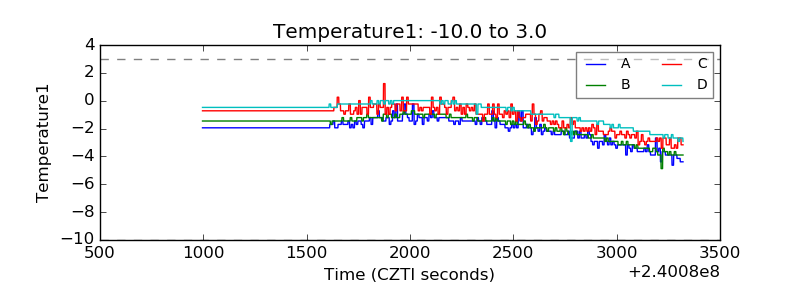 |
| Veto HV Monitor | 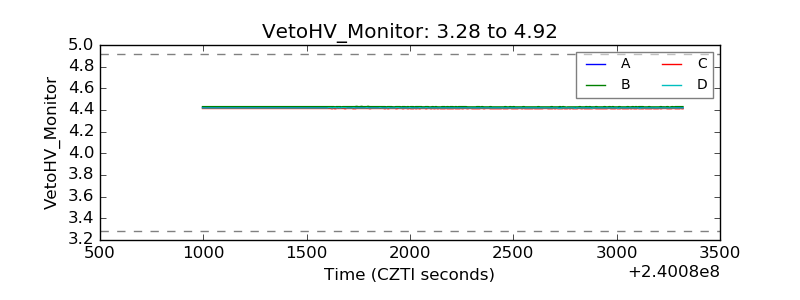 |
| Veto LLD | 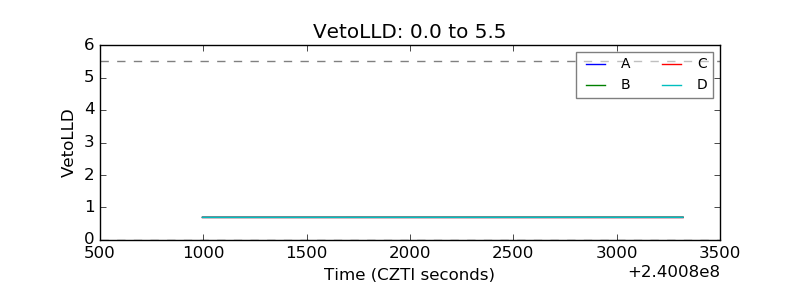 |
| Alpha Counter | 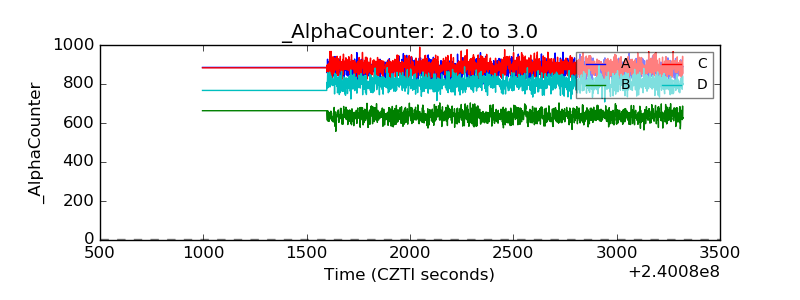 |
| _CPM_Rate | 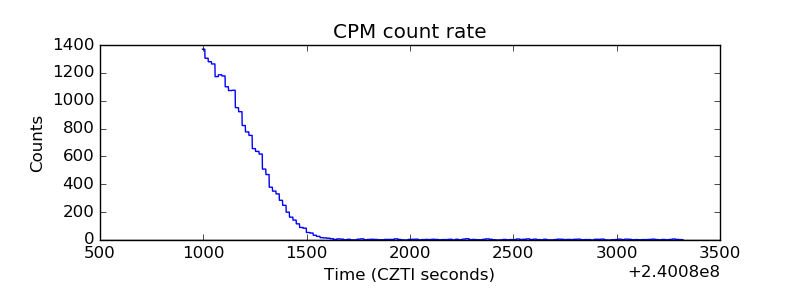 |
| CZT Counter |  |
| +2.5 Volts monitor |  |
| +5 Volts monitor |  |
| _ROLL_ROT | 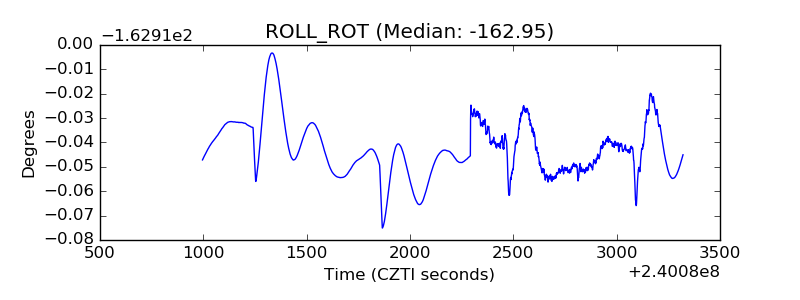 |
| _Roll_DEC | 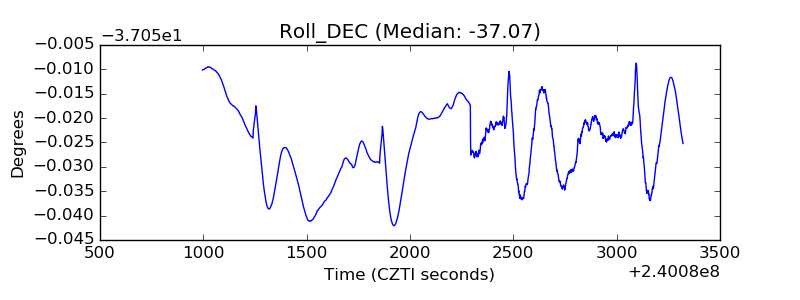 |
| _Roll_RA | 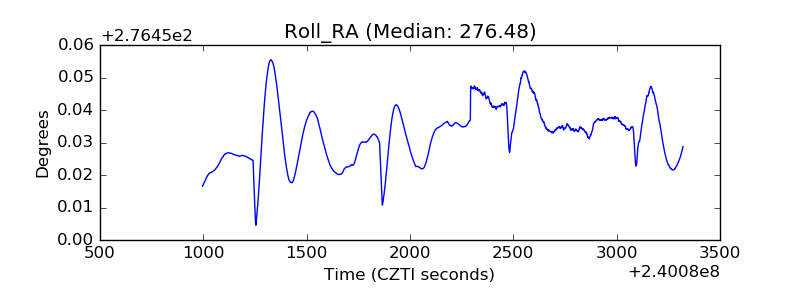 |
| Veto Counter | 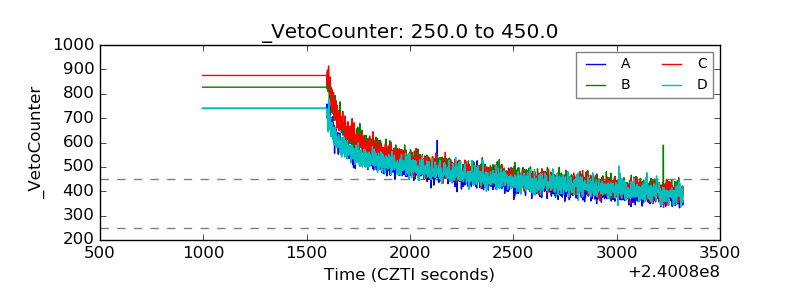 |