| Param | Original file | Final file |
|---|---|---|
| Filename | modeM0/AS1G07_065T01_9000001454cztM0_level2.fits | modeM0/AS1G07_065T01_9000001454cztM0_level2_quad_clean.evt |
| Size (bytes) | 710,058,240 | 689,437,440 |
| Size | 677.2 MB | 657.5 MB |
| Events in quadrant A | 4,344,690 | 4,181,046 |
| Events in quadrant B | 4,185,852 | 4,205,161 |
| Events in quadrant C | 4,240,990 | 3,959,908 |
| Events in quadrant D | 3,588,326 | 3,390,605 |
| Mode M0 | |||
|---|---|---|---|
| Quadrant | BADHDUFLAG | Total packets | Discarded packets |
| A | 0 | 161761 | 0 |
| B | 0 | 160605 | 0 |
| C | 0 | 153970 | 0 |
| D | 0 | 193353 | 0 |
| Mode M9 | |||
|---|---|---|---|
| Quadrant | BADHDUFLAG | Total packets | Discarded packets |
| A | 0 | 122 | 0 |
| B | 0 | 122 | 0 |
| C | 0 | 122 | 0 |
| D | 0 | 122 | 0 |
| Mode SS | |||
|---|---|---|---|
| Quadrant | BADHDUFLAG | Total packets | Discarded packets |
| A | 0 | 1530 | 0 |
| B | 0 | 1538 | 0 |
| C | 0 | 1528 | 0 |
| D | 0 | 1534 | 0 |
| Quadrant | Total seconds | Saturated seconds | Saturation percentage |
|---|---|---|---|
| A | 75002 | 815 | 1.086638% |
| B | 75003 | 976 | 1.301281% |
| C | 74980 | 540 | 0.720192% |
| D | 74981 | 3712 | 4.950587% |
Noise dominated data is calculated using 1-second bins in cleaned event files. If a bin has >2000 counts, and if more than 50% of those come from <1% of pixels, then it is considered to be noise-dominated and hence unusable.
| Quadrant | # 1 sec bins | Bins with >0 counts | Bins with >2000 counts | High rate bins dominated by noise | Noise dominated (total time) | Noise dominated (detector-on time) | Marked lightcurve |
|---|---|---|---|---|---|---|---|
| A | 87635 | 75214 | 0 | 0 | 0.00% | 0.00% |  |
| B | 87635 | 75202 | 0 | 0 | 0.00% | 0.00% | 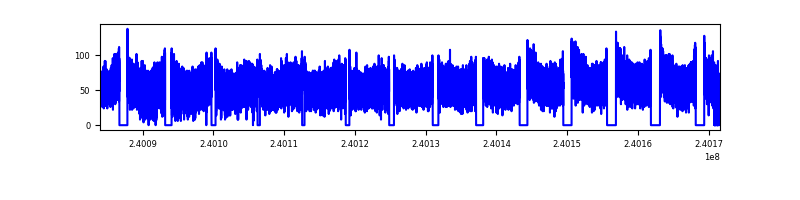 |
| C | 87635 | 75213 | 0 | 0 | 0.00% | 0.00% | 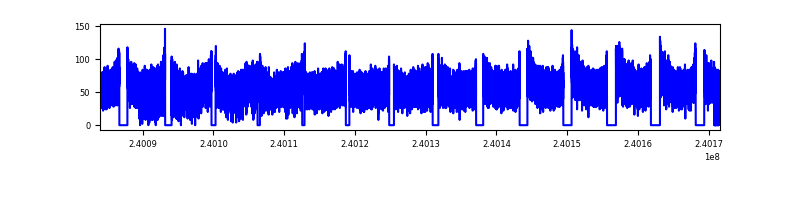 |
| D | 87635 | 75120 | 0 | 0 | 0.00% | 0.00% | 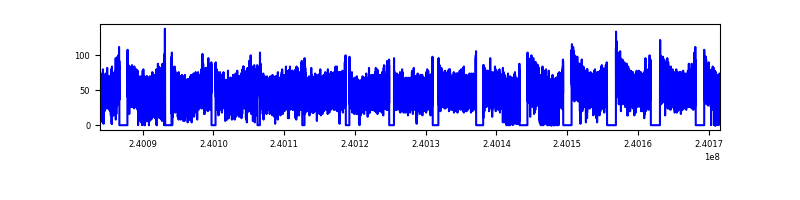 |
Top three noisy pixels from each quadrant. If the there are fewer than three noisy pixels in the level2.evt file, extra rows are filled as -1
| Pixel properties | Quadrant properties | ||||||
|---|---|---|---|---|---|---|---|
| Quadrant | DetID | PixID | Counts | Sigma | Mean | Median | Sigma |
| A | 0 | 29 | 4222 | 11.01 | 1131 | 1055 | 287.6 |
| A | 7 | 110 | 3572 | 8.75 | 1131 | 1055 | 287.6 |
| A | 9 | 19 | 3197 | 7.45 | 1131 | 1055 | 287.6 |
| B | 2 | 9 | 3589 | 11.38 | 1104 | 1047 | 223.2 |
| B | 12 | 226 | 2759 | 7.67 | 1104 | 1047 | 223.2 |
| B | 2 | 8 | 2755 | 7.65 | 1104 | 1047 | 223.2 |
| C | 1 | 80 | 3159 | 7.17 | 1120 | 1036 | 296.3 |
| C | 1 | 81 | 3018 | 6.69 | 1120 | 1036 | 296.3 |
| C | 12 | 241 | 2983 | 6.57 | 1120 | 1036 | 296.3 |
| D | 6 | 231 | 2653 | 6.31 | 1022 | 929 | 273.4 |
| D | 3 | 14 | 2608 | 6.14 | 1022 | 929 | 273.4 |
| D | 1 | 19 | 2570 | 6.0 | 1022 | 929 | 273.4 |
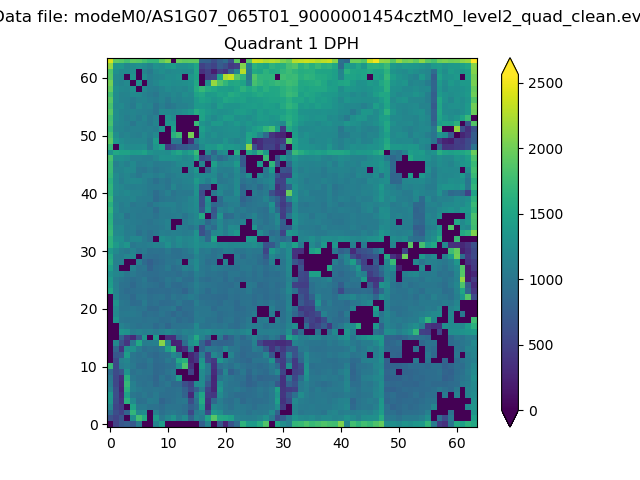
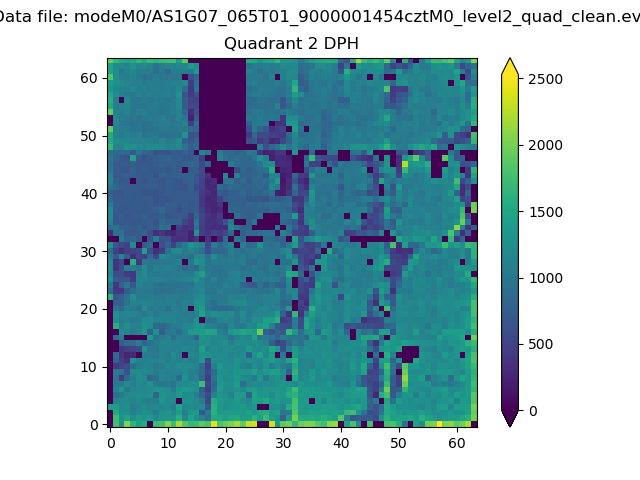
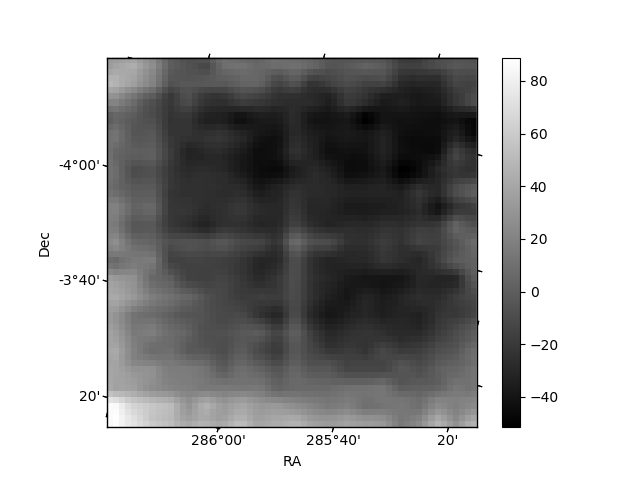
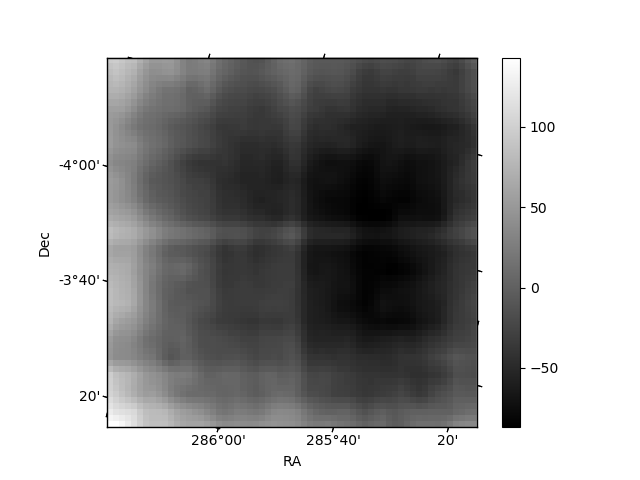
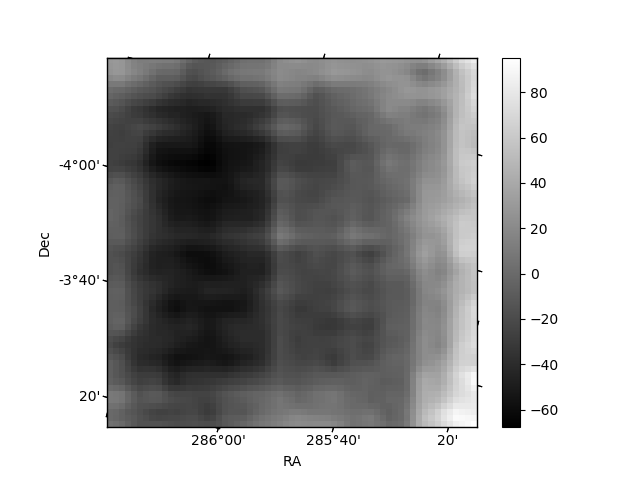
Histogram calculated using DETX and DETY for each event in the final _common_clean file
| Quadrant A | 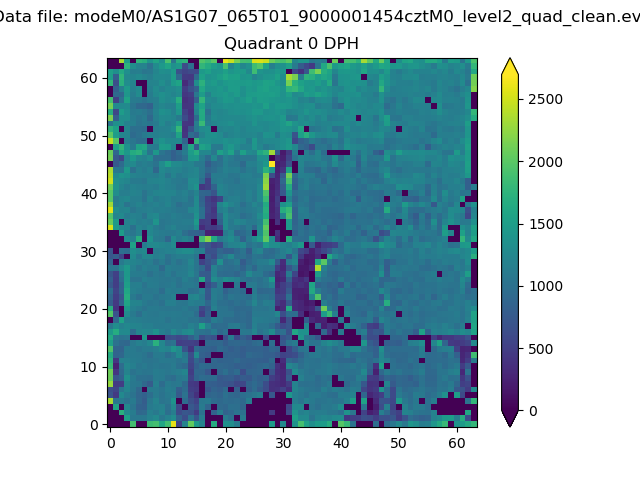 |
 |
Quadrant B |
|---|---|---|---|
| Quadrant D |  |
 |
Quadrant C |
| Plot type | Count rate plots | Images |
|---|---|---|
| Comparison with Poisson distribution Blue bars denote a histogram of data divided into 1 sec bins. Red curve is a Poisson curve with rate = median count rate of data. |
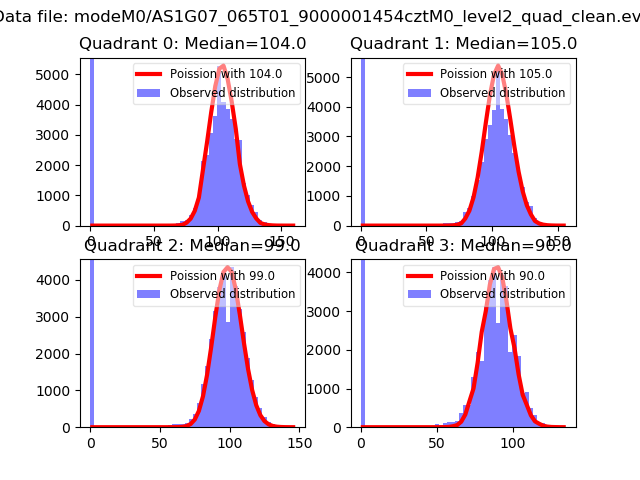 |
 |
| Quadrant-wise count rates Data is divided into 100 sec bins |
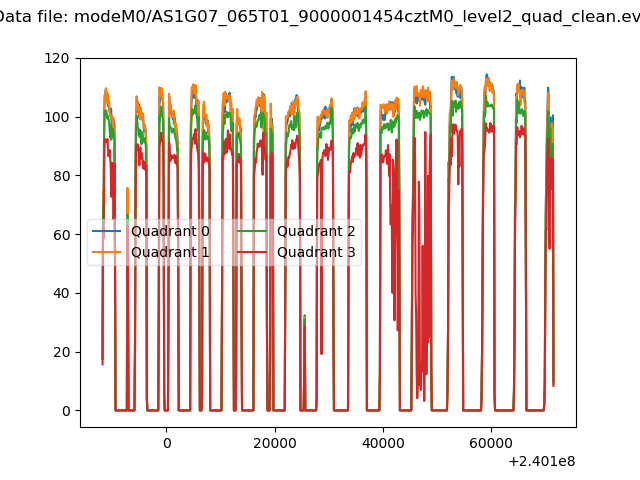 |
|
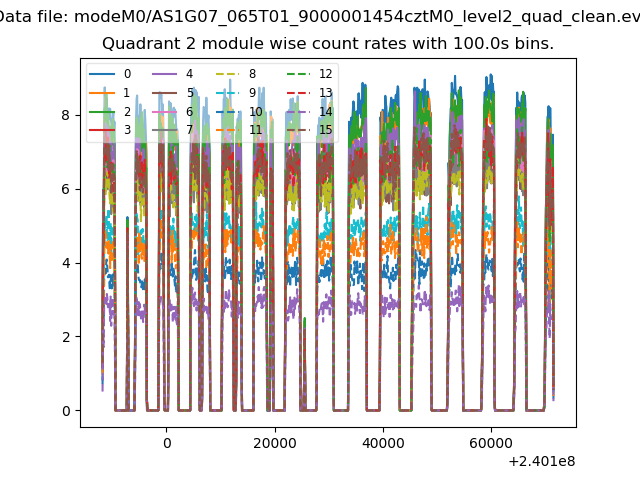
| Module-wise count rates for Quadrant A Data is divided into 100 sec bins |
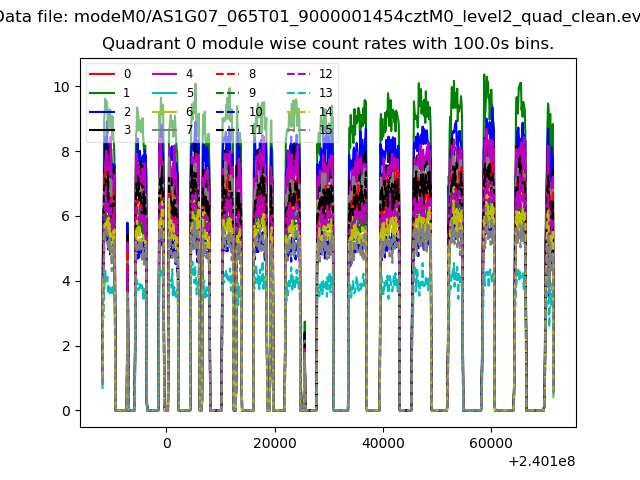 |
 |
| Module-wise count rates for Quadrant B Data is divided into 100 sec bins |
 |
 |
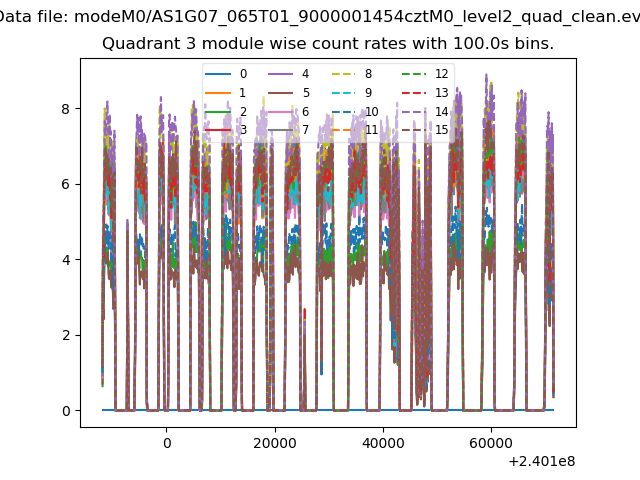
| Module-wise count rates for Quadrant C Data is divided into 100 sec bins |
 |
 |
| Module-wise count rates for Quadrant D Data is divided into 100 sec bins |
 |
 |
| Parameter | Plot |
|---|---|
| CZT HV Monitor | 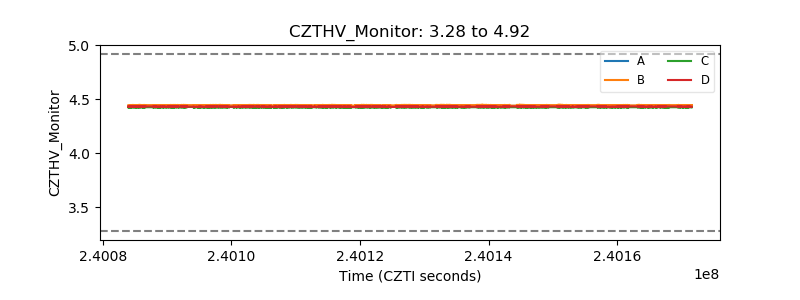 |
| D_VDD | 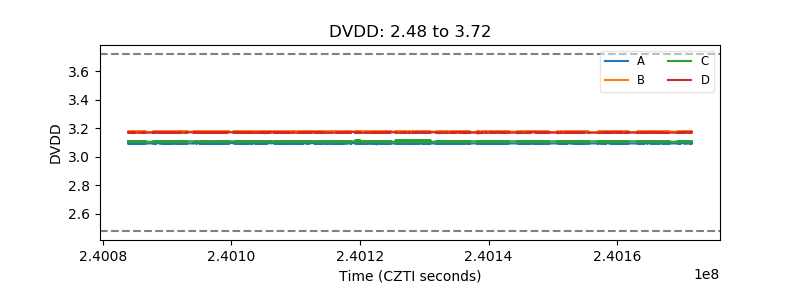 |
| Temperature 1 | 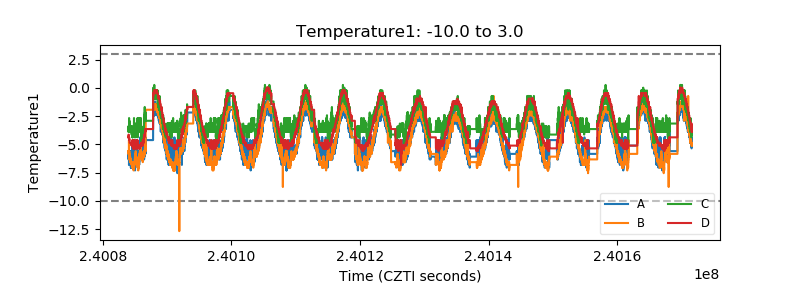 |
| Veto HV Monitor | 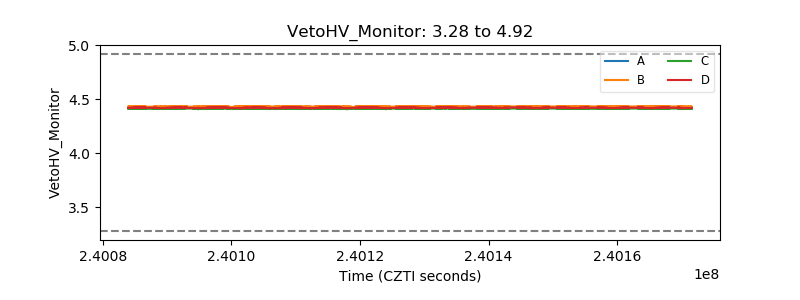 |
| Veto LLD | 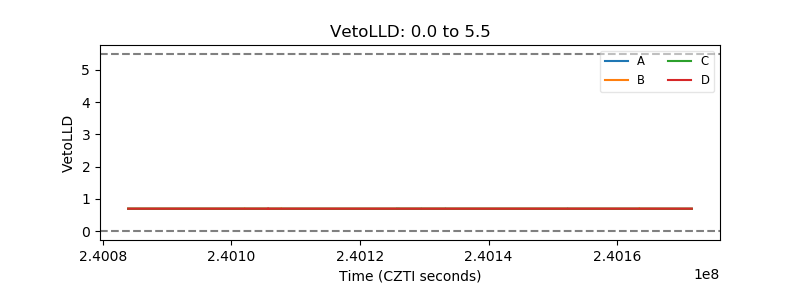 |
| Alpha Counter | 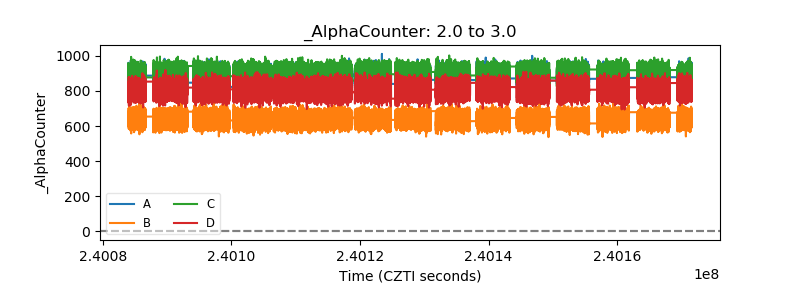 |
| _CPM_Rate | 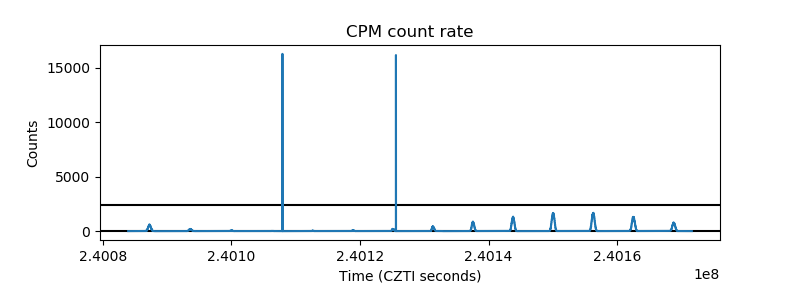 |
| CZT Counter | 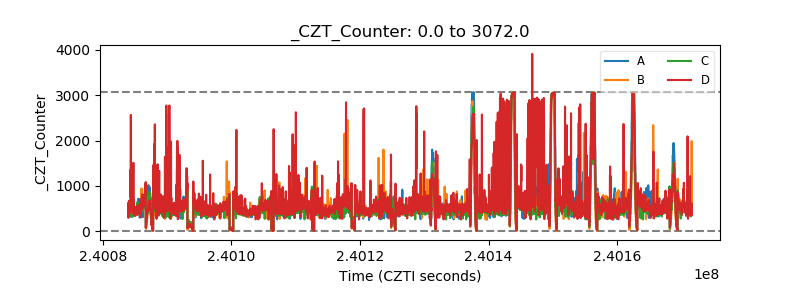 |
| +2.5 Volts monitor | 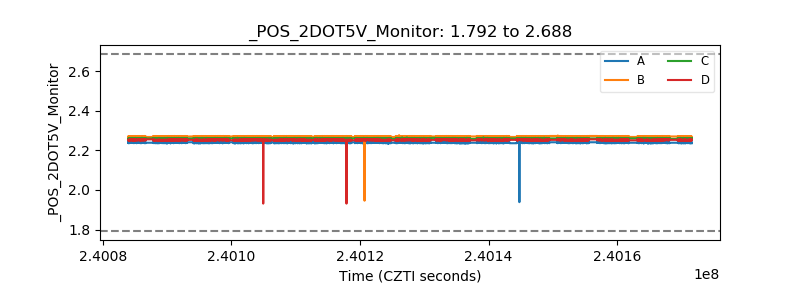 |
| +5 Volts monitor | 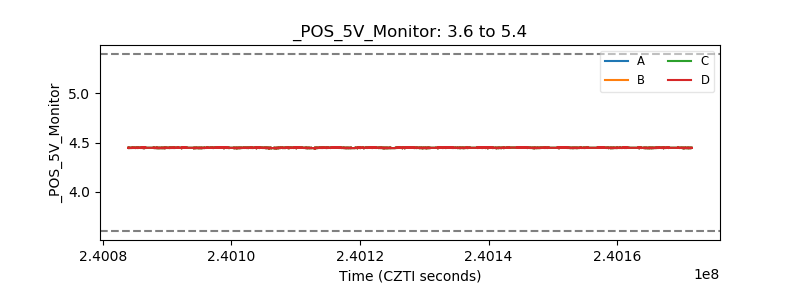 |
| _ROLL_ROT | 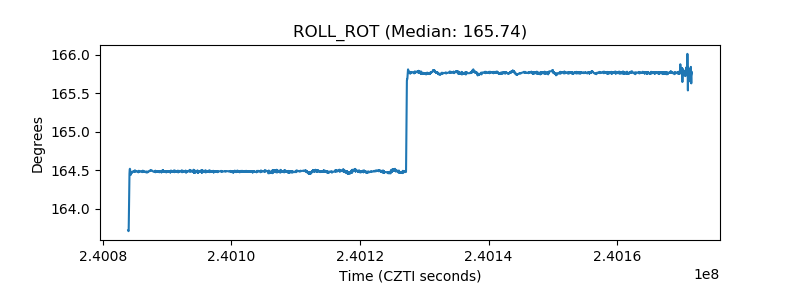 |
| _Roll_DEC | 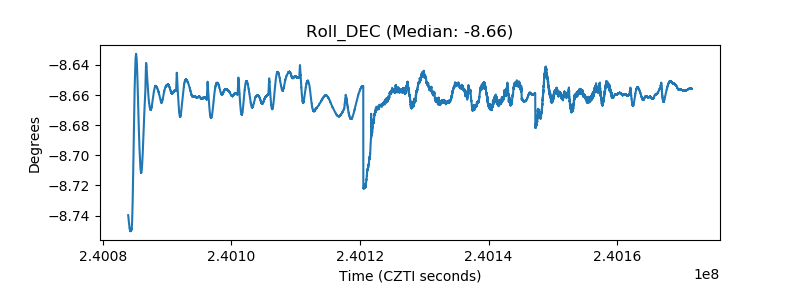 |
| _Roll_RA | 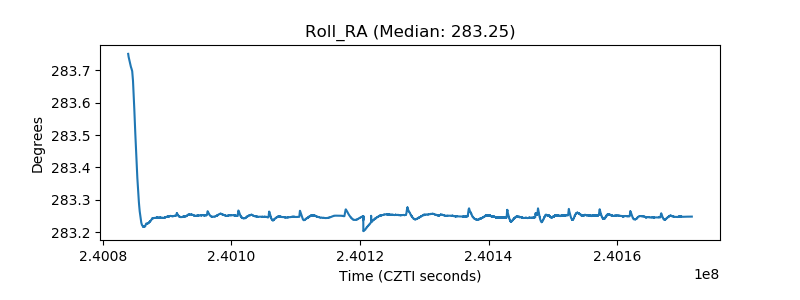 |
| Veto Counter | 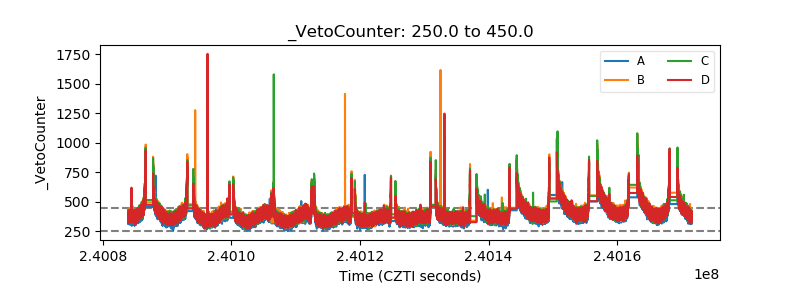 |