| Param | Original file | Final file |
|---|---|---|
| Filename | modeM0/AS1G07_065T01_9000001454_10104cztM0_level2.evt | modeM0/AS1G07_065T01_9000001454_10104cztM0_level2_quad_clean.evt |
| Size (bytes) | 305,043,840 | 48,945,600 |
| Size | 290.9 MB | 46.7 MB |
| Events in quadrant A | 2,076,749 | 301,701 |
| Events in quadrant B | 2,207,559 | 305,285 |
| Events in quadrant C | 2,015,915 | 296,517 |
| Events in quadrant D | 2,647,389 | 278,333 |
| Mode M0 | |||
|---|---|---|---|
| Quadrant | BADHDUFLAG | Total packets | Discarded packets |
| A | 0 | 9025 | 2 |
| B | 0 | 9356 | 1 |
| C | 0 | 8963 | 1 |
| D | 0 | 10615 | 1 |
| Mode M9 | |||
|---|---|---|---|
| Quadrant | BADHDUFLAG | Total packets | Discarded packets |
| A | 0 | 12 | 0 |
| B | 0 | 12 | 0 |
| C | 0 | 12 | 0 |
| D | 0 | 12 | 0 |
| Mode SS | |||
|---|---|---|---|
| Quadrant | BADHDUFLAG | Total packets | Discarded packets |
| A | 0 | 86 | 0 |
| B | 0 | 86 | 0 |
| C | 0 | 86 | 0 |
| D | 0 | 86 | 0 |
| Quadrant | Total seconds | Saturated seconds | Saturation percentage |
|---|---|---|---|
| A | 4262 | 107 | 2.510558% |
| B | 4262 | 112 | 2.627874% |
| C | 4262 | 81 | 1.900516% |
| D | 4262 | 155 | 3.636790% |
Noise dominated data is calculated using 1-second bins in cleaned event files. If a bin has >2000 counts, and if more than 50% of those come from <1% of pixels, then it is considered to be noise-dominated and hence unusable.
| Quadrant | # 1 sec bins | Bins with >0 counts | Bins with >2000 counts | High rate bins dominated by noise | Noise dominated (total time) | Noise dominated (detector-on time) | Marked lightcurve |
|---|---|---|---|---|---|---|---|
| A | 5407 | 4262 | 0 | 0 | 0.00% | 0.00% | 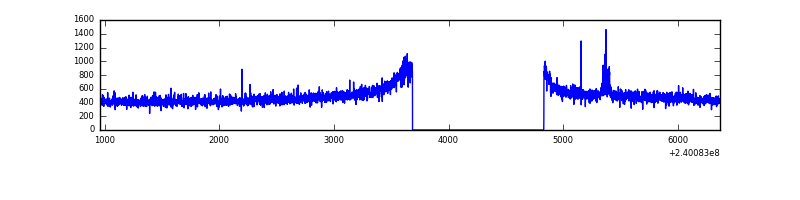 |
| B | 5407 | 4262 | 1 | 1 | 0.02% | 0.02% | 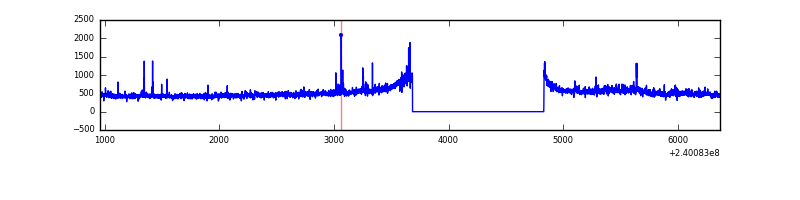 |
| C | 5407 | 4262 | 0 | 0 | 0.00% | 0.00% |  |
| D | 5407 | 4263 | 67 | 67 | 1.24% | 1.57% | 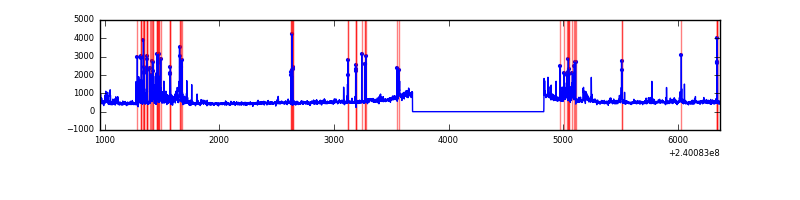 |
Top three noisy pixels from each quadrant. If the there are fewer than three noisy pixels in the level2.evt file, extra rows are filled as -1
| Pixel properties | Quadrant properties | ||||||
|---|---|---|---|---|---|---|---|
| Quadrant | DetID | PixID | Counts | Sigma | Mean | Median | Sigma |
| A | 15 | 223 | 16688 | 146.57 | 534 | 522 | 110.3 |
| A | 0 | 226 | 4918 | 39.86 | 534 | 522 | 110.3 |
| A | 12 | 194 | 4422 | 35.36 | 534 | 522 | 110.3 |
| B | 0 | 219 | 41801 | 395.65 | 536 | 523 | 104.3 |
| B | 4 | 81 | 16813 | 156.14 | 536 | 523 | 104.3 |
| B | 4 | 80 | 16193 | 150.2 | 536 | 523 | 104.3 |
| C | 13 | 61 | 3850 | 27.45 | 516 | 519 | 121.3 |
| C | 4 | 175 | 2210 | 13.94 | 516 | 519 | 121.3 |
| C | 8 | 222 | 1964 | 11.91 | 516 | 519 | 121.3 |
| D | 1 | 52 | 210436 | 1685.12 | 510 | 497 | 124.6 |
| D | 12 | 233 | 181556 | 1453.31 | 510 | 497 | 124.6 |
| D | 8 | 195 | 156885 | 1255.28 | 510 | 497 | 124.6 |
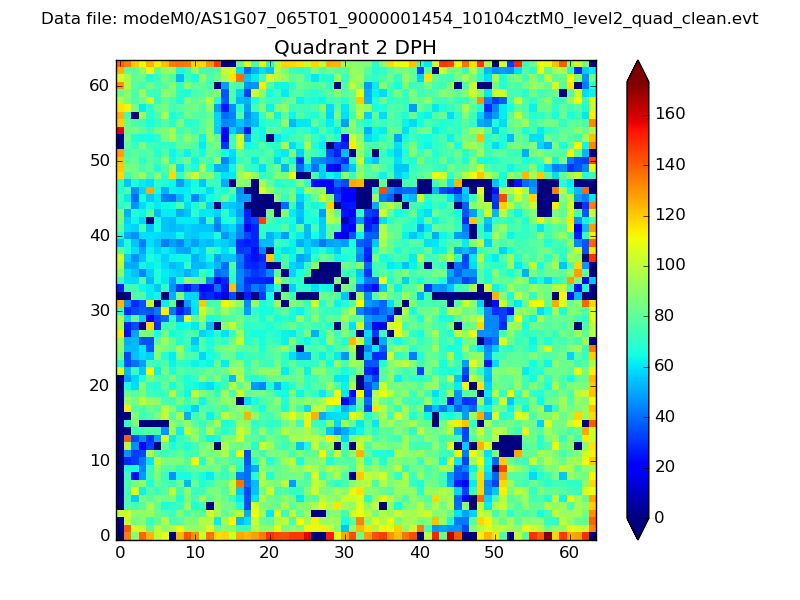
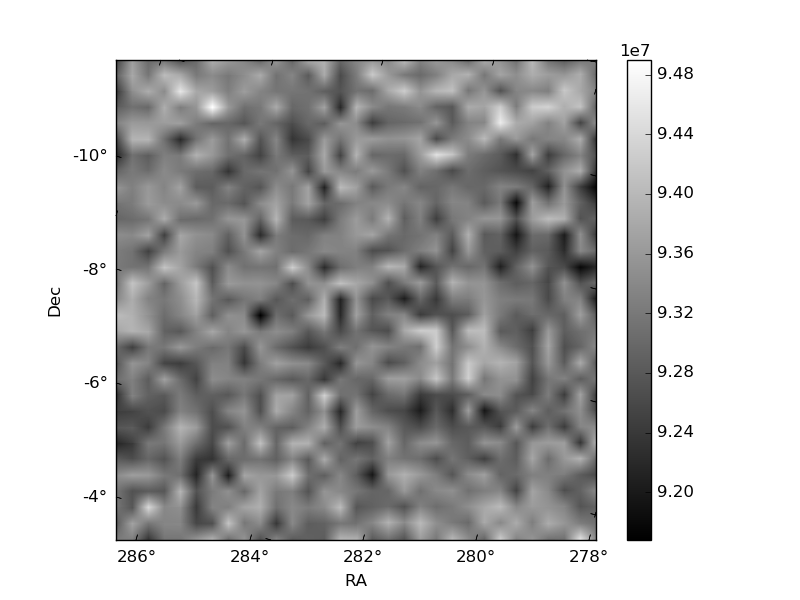
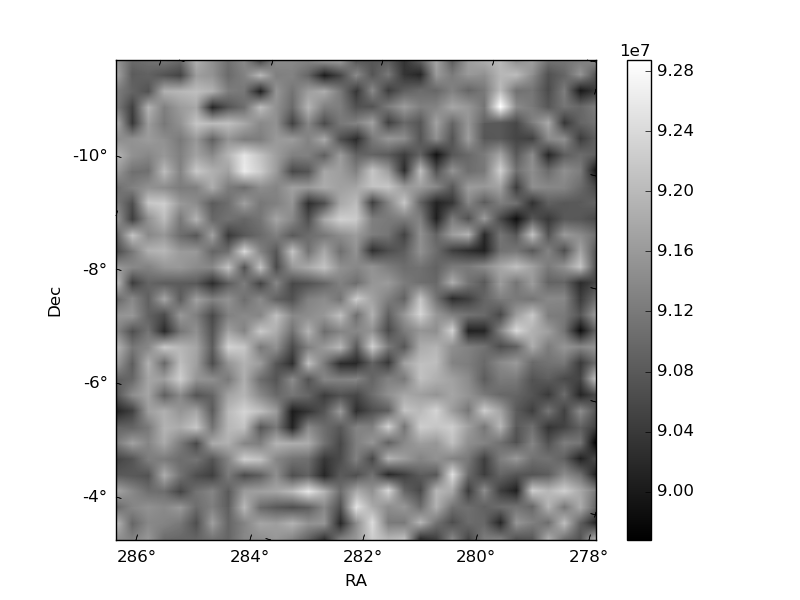
Histogram calculated using DETX and DETY for each event in the final _common_clean file
| Quadrant A | 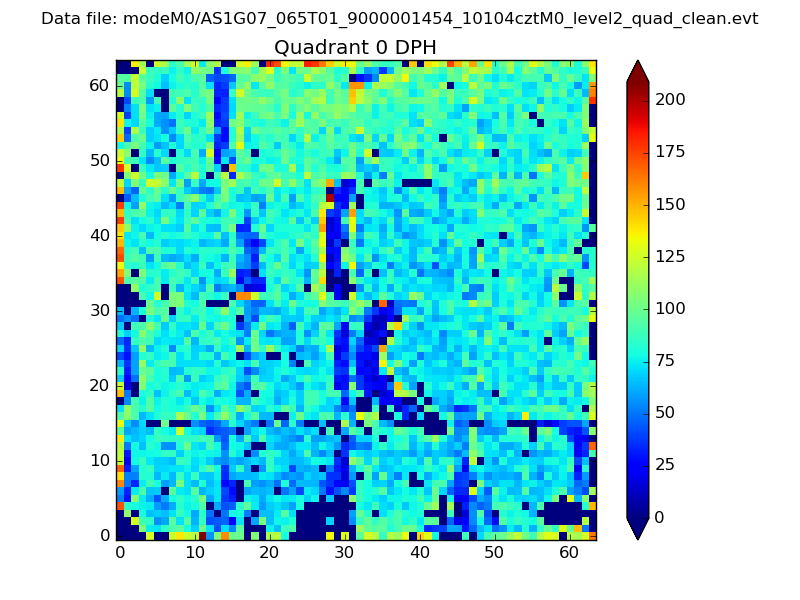 |
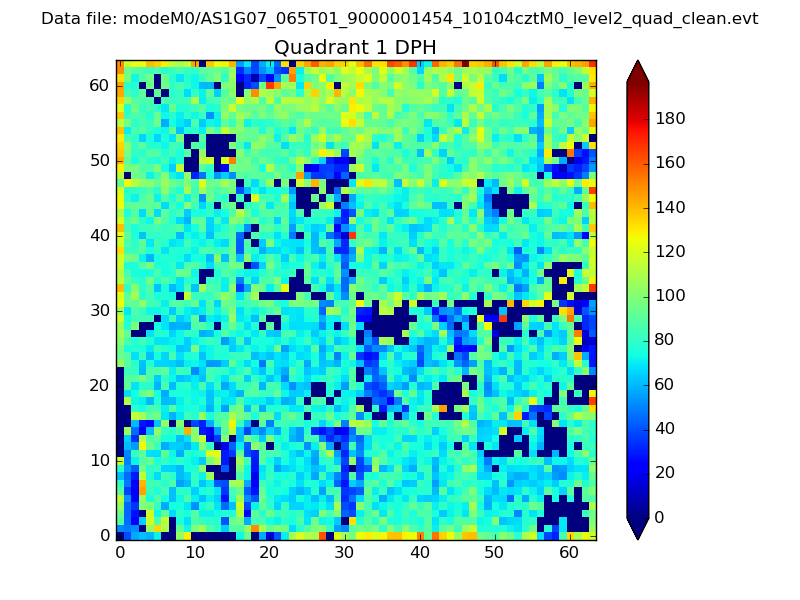 |
Quadrant B |
|---|---|---|---|
| Quadrant D | 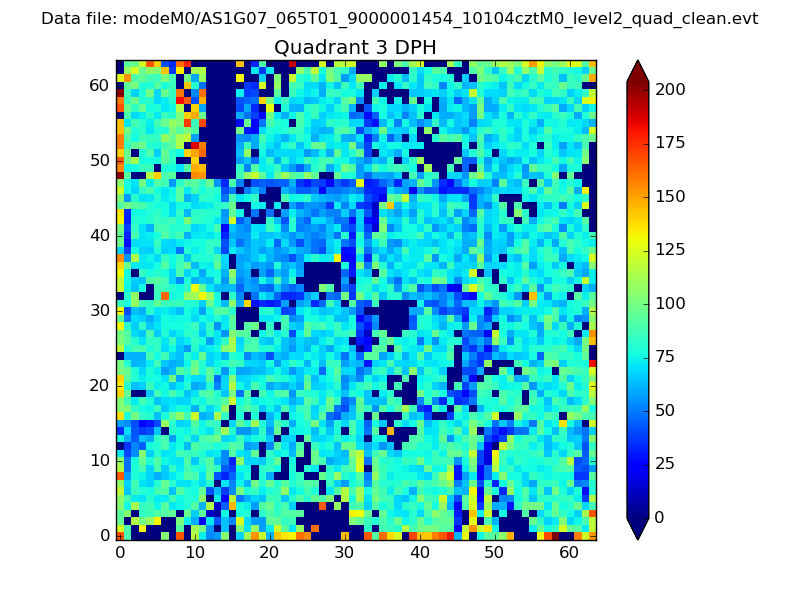 |
 |
Quadrant C |
| Plot type | Count rate plots | Images |
|---|---|---|
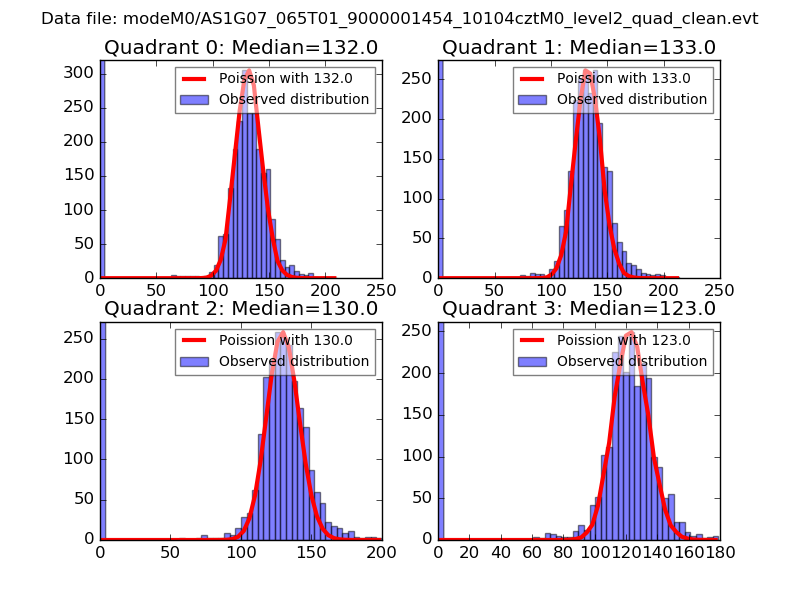
| Comparison with Poisson distribution Blue bars denote a histogram of data divided into 1 sec bins. Red curve is a Poisson curve with rate = median count rate of data. |
 |
 |
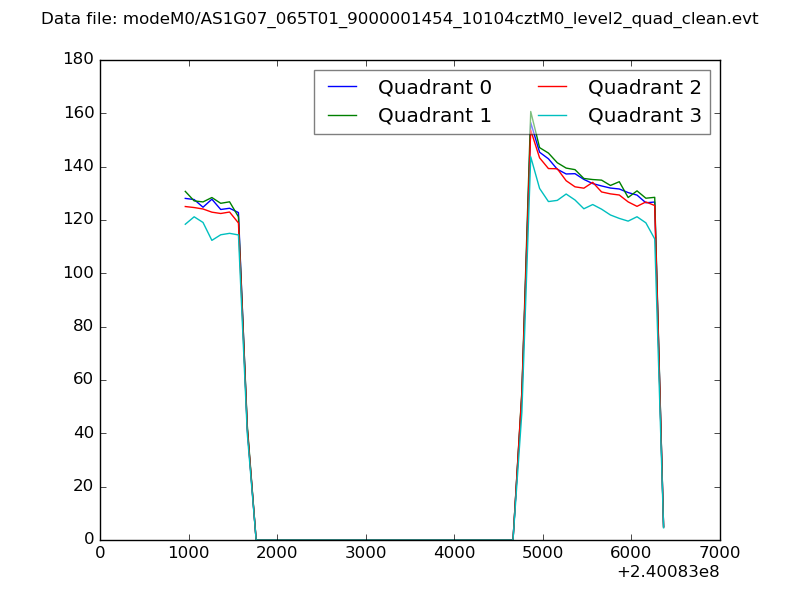
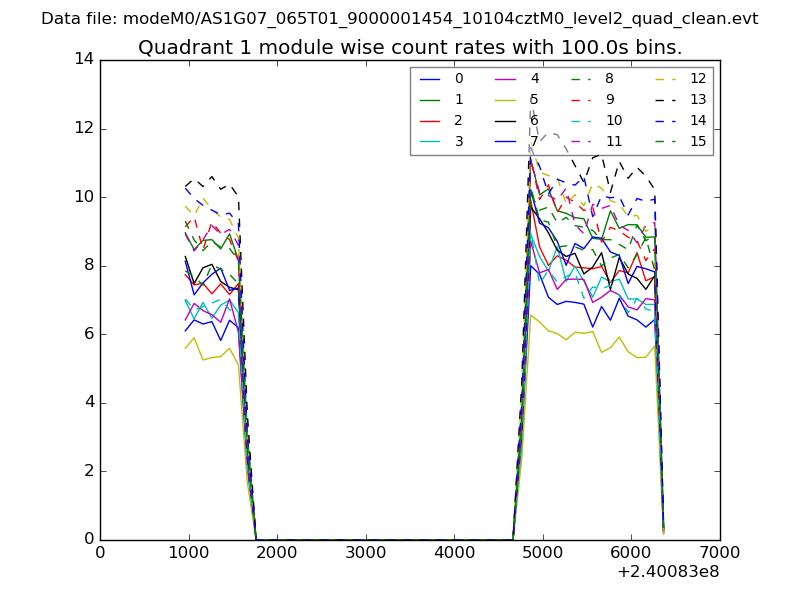
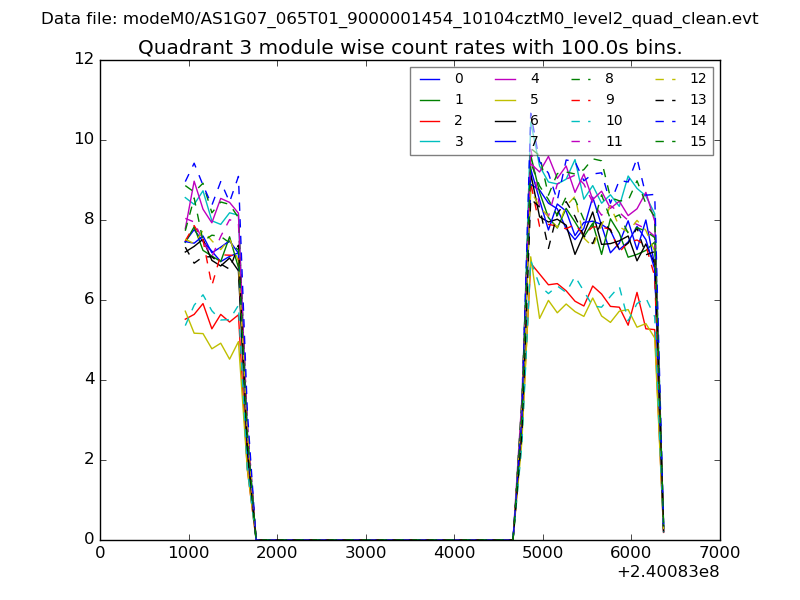
| Quadrant-wise count rates Data is divided into 100 sec bins |
 |
|
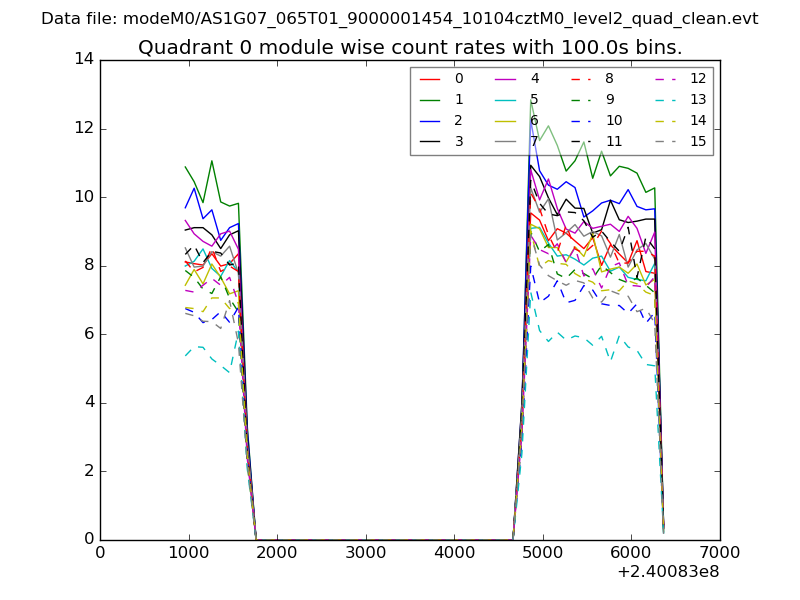
| Module-wise count rates for Quadrant A Data is divided into 100 sec bins |
 |
 |
| Module-wise count rates for Quadrant B Data is divided into 100 sec bins |
 |
 |
| Module-wise count rates for Quadrant C Data is divided into 100 sec bins |
 |
 |
| Module-wise count rates for Quadrant D Data is divided into 100 sec bins |
 |
 |
| Parameter | Plot |
|---|---|
| CZT HV Monitor | 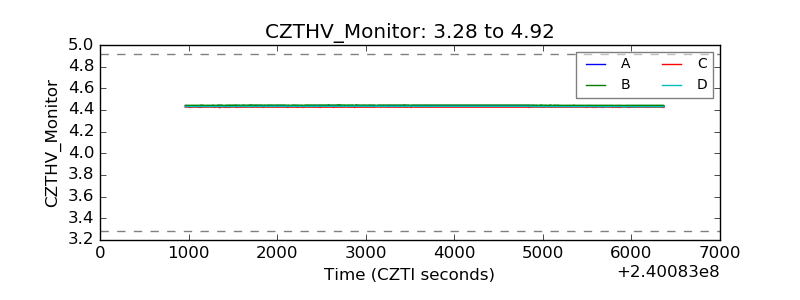 |
| D_VDD | 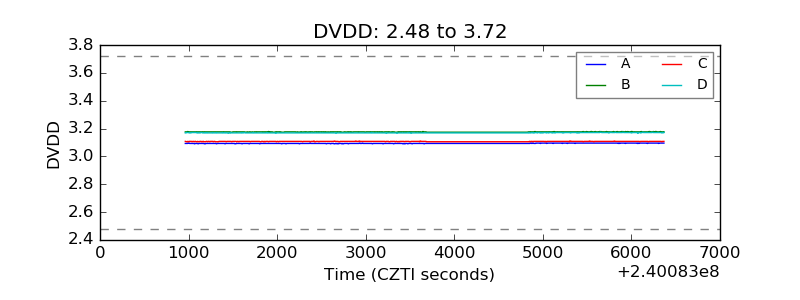 |
| Temperature 1 | 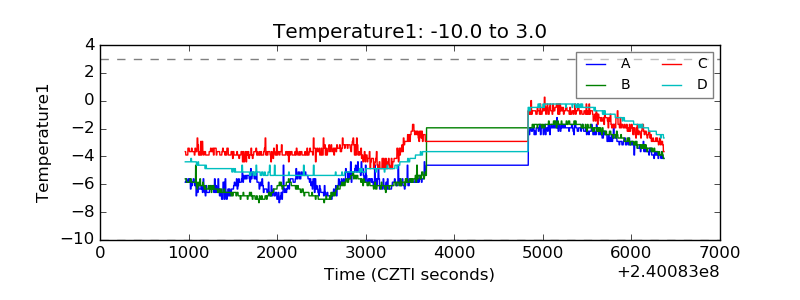 |
| Veto HV Monitor | 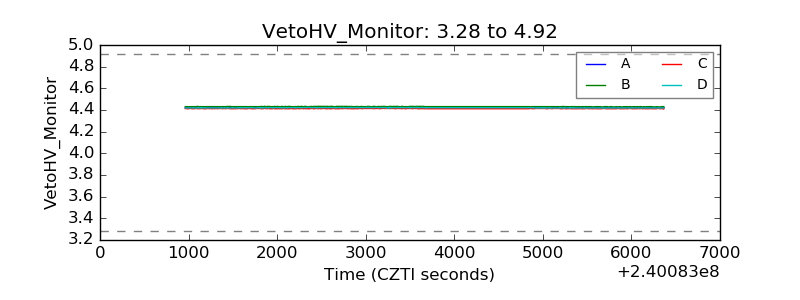 |
| Veto LLD | 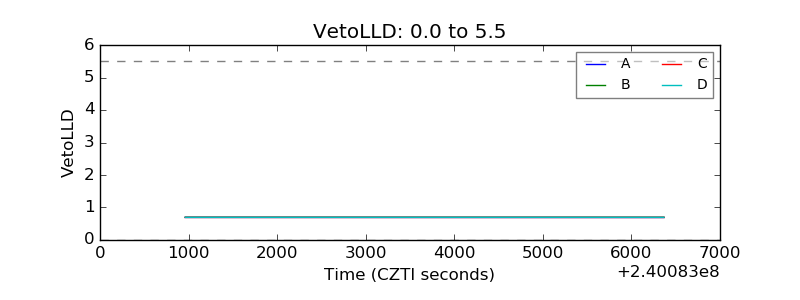 |
| Alpha Counter | 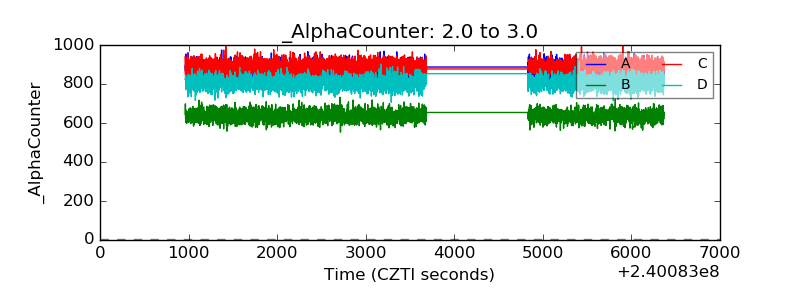 |
| _CPM_Rate | 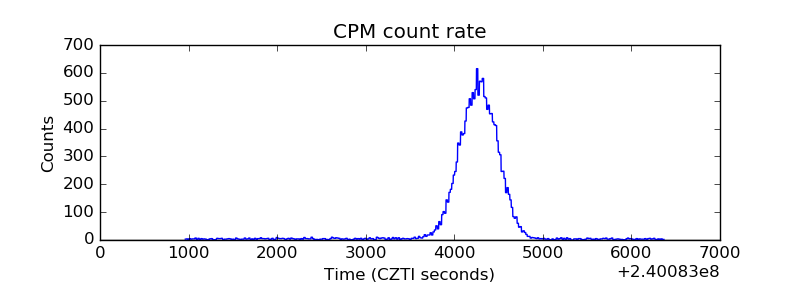 |
| CZT Counter | 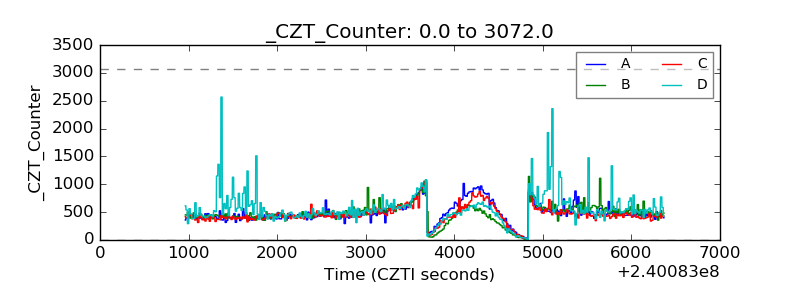 |
| +2.5 Volts monitor |  |
| +5 Volts monitor |  |
| _ROLL_ROT | 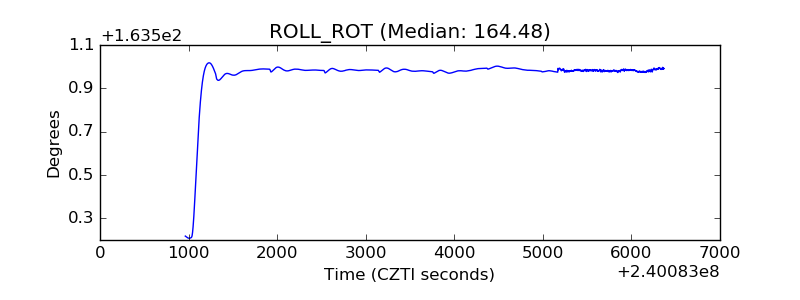 |
| _Roll_DEC | 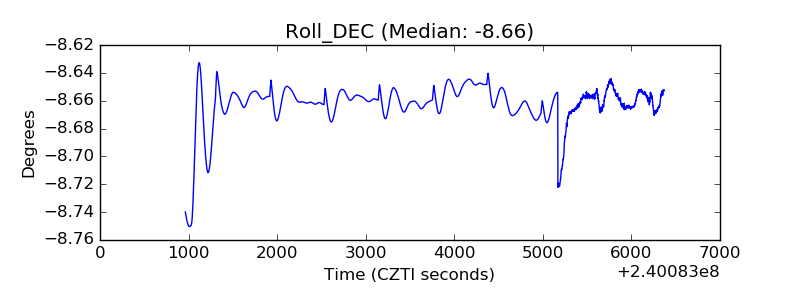 |
| _Roll_RA |  |
| Veto Counter | 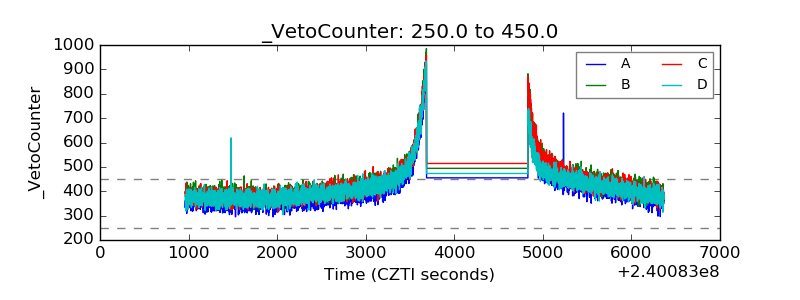 |