| Param | Original file | Final file |
|---|---|---|
| Filename | modeM0/AS1G07_065T01_9000001454_10105cztM0_level2.evt | modeM0/AS1G07_065T01_9000001454_10105cztM0_level2_quad_clean.evt |
| Size (bytes) | 455,906,880 | 85,944,960 |
| Size | 434.8 MB | 82.0 MB |
| Events in quadrant A | 3,040,966 | 549,957 |
| Events in quadrant B | 3,247,177 | 557,055 |
| Events in quadrant C | 2,952,072 | 541,855 |
| Events in quadrant D | 4,131,319 | 506,753 |
| Mode M0 | |||
|---|---|---|---|
| Quadrant | BADHDUFLAG | Total packets | Discarded packets |
| A | 0 | 13685 | 273 |
| B | 0 | 14063 | 289 |
| C | 0 | 13546 | 291 |
| D | 0 | 16748 | 486 |
| Mode M9 | |||
|---|---|---|---|
| Quadrant | BADHDUFLAG | Total packets | Discarded packets |
| A | 0 | 10 | 0 |
| B | 0 | 10 | 0 |
| C | 0 | 10 | 0 |
| D | 0 | 11 | 0 |
| Mode SS | |||
|---|---|---|---|
| Quadrant | BADHDUFLAG | Total packets | Discarded packets |
| A | 0 | 132 | 0 |
| B | 0 | 132 | 0 |
| C | 0 | 132 | 2 |
| D | 0 | 132 | 2 |
| Quadrant | Total seconds | Saturated seconds | Saturation percentage |
|---|---|---|---|
| A | 6415 | 57 | 0.888542% |
| B | 6411 | 79 | 1.232257% |
| C | 6404 | 37 | 0.577764% |
| D | 6378 | 138 | 2.163688% |
Noise dominated data is calculated using 1-second bins in cleaned event files. If a bin has >2000 counts, and if more than 50% of those come from <1% of pixels, then it is considered to be noise-dominated and hence unusable.
| Quadrant | # 1 sec bins | Bins with >0 counts | Bins with >2000 counts | High rate bins dominated by noise | Noise dominated (total time) | Noise dominated (detector-on time) | Marked lightcurve |
|---|---|---|---|---|---|---|---|
| A | 7462 | 6538 | 0 | 0 | 0.00% | 0.00% | 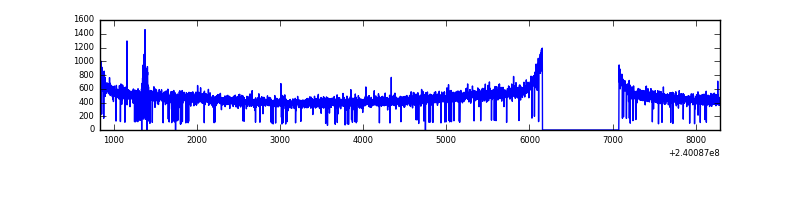 |
| B | 7462 | 6536 | 6 | 6 | 0.08% | 0.09% | 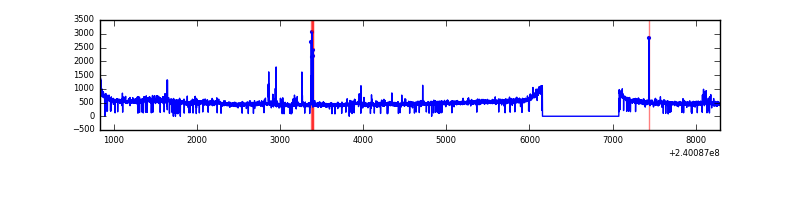 |
| C | 7462 | 6538 | 0 | 0 | 0.00% | 0.00% | 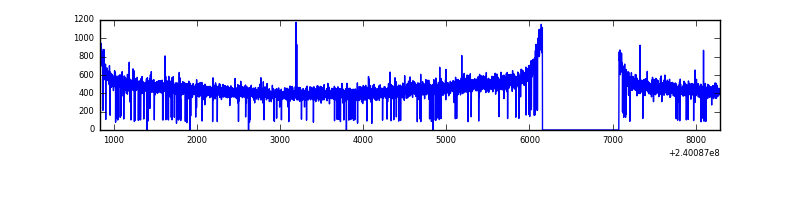 |
| D | 7462 | 6531 | 107 | 107 | 1.43% | 1.64% | 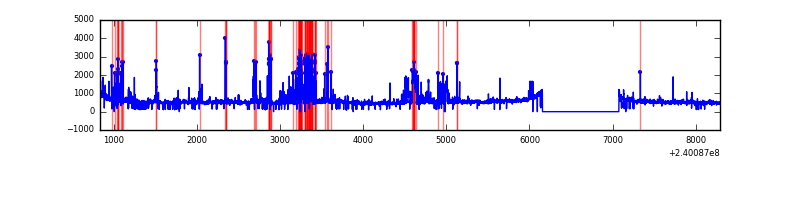 |
Top three noisy pixels from each quadrant. If the there are fewer than three noisy pixels in the level2.evt file, extra rows are filled as -1
| Pixel properties | Quadrant properties | ||||||
|---|---|---|---|---|---|---|---|
| Quadrant | DetID | PixID | Counts | Sigma | Mean | Median | Sigma |
| A | 15 | 223 | 15652 | 92.29 | 785 | 768 | 161.3 |
| A | 0 | 226 | 7200 | 39.88 | 785 | 768 | 161.3 |
| A | 12 | 194 | 6505 | 35.57 | 785 | 768 | 161.3 |
| B | 0 | 219 | 45895 | 298.8 | 786 | 768 | 151.0 |
| B | 4 | 239 | 41282 | 268.25 | 786 | 768 | 151.0 |
| B | 4 | 81 | 34253 | 221.71 | 786 | 768 | 151.0 |
| C | 13 | 61 | 5684 | 27.91 | 754 | 758 | 176.5 |
| C | 14 | 67 | 3902 | 17.82 | 754 | 758 | 176.5 |
| C | 14 | 234 | 3563 | 15.9 | 754 | 758 | 176.5 |
| D | 1 | 52 | 655021 | 3312.71 | 741 | 724 | 197.5 |
| D | 8 | 195 | 353414 | 1785.67 | 741 | 724 | 197.5 |
| D | 2 | 152 | 117495 | 591.21 | 741 | 724 | 197.5 |
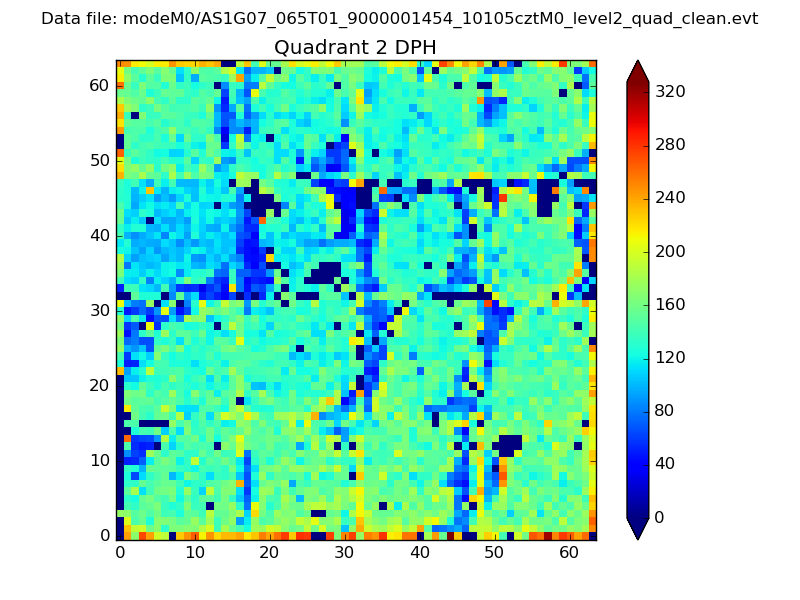
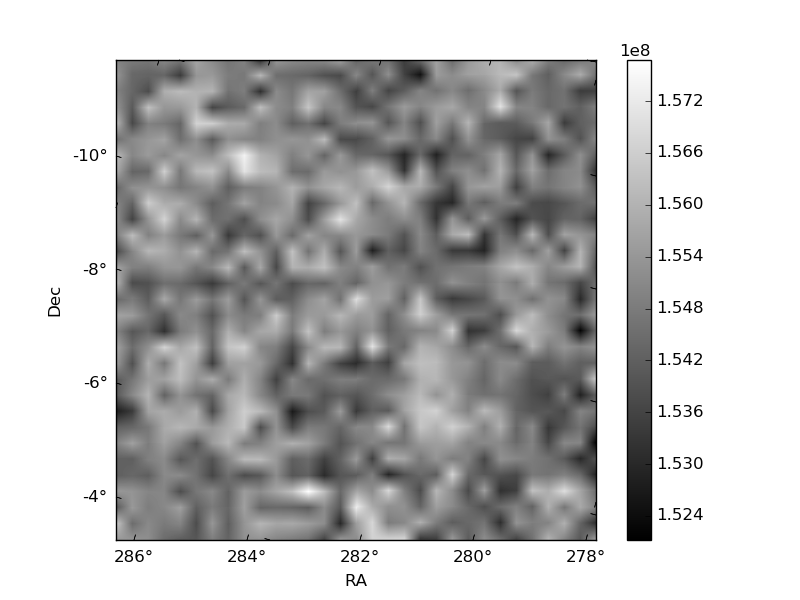
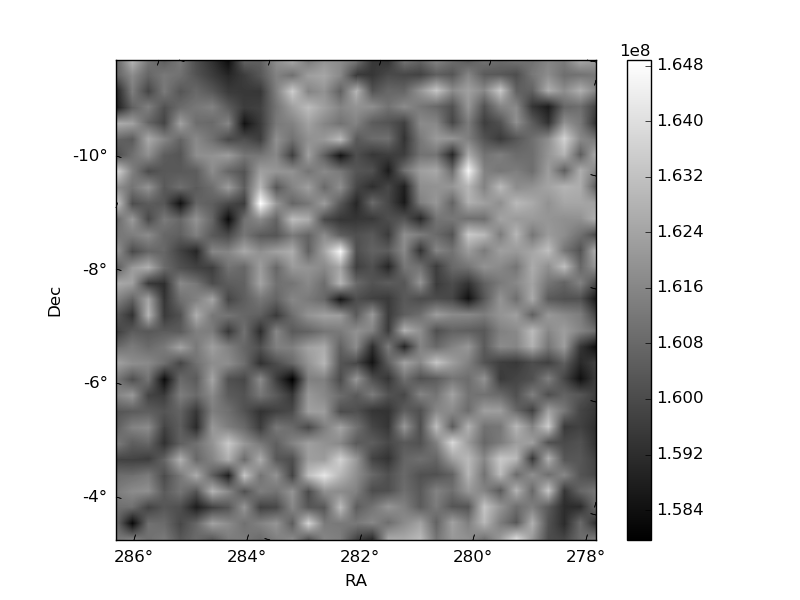
Histogram calculated using DETX and DETY for each event in the final _common_clean file
| Quadrant A | 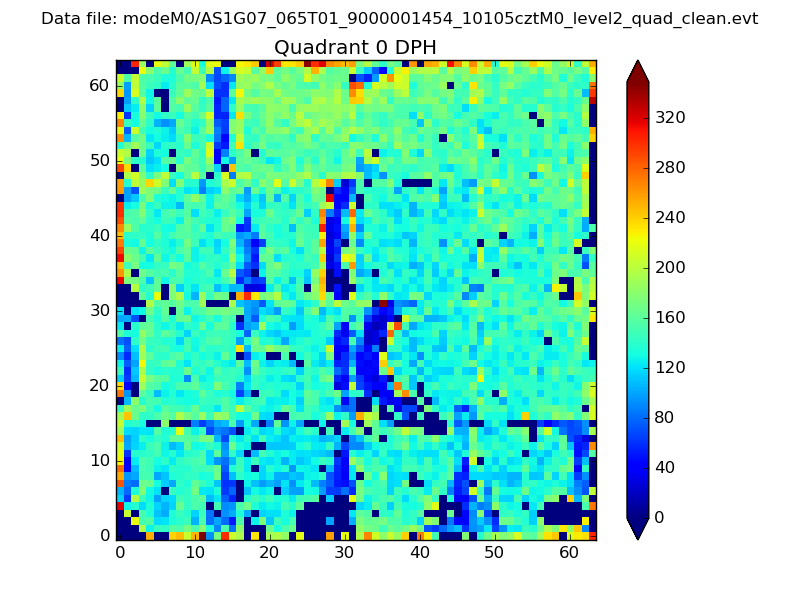 |
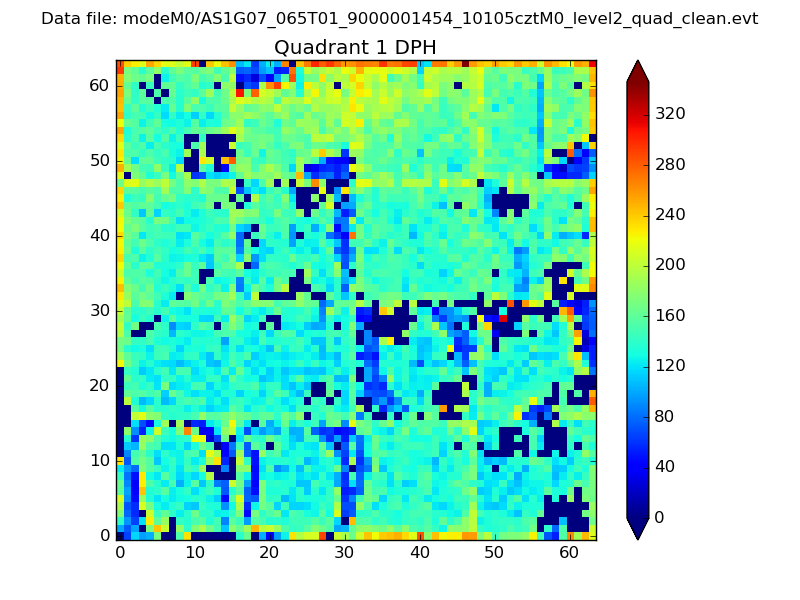 |
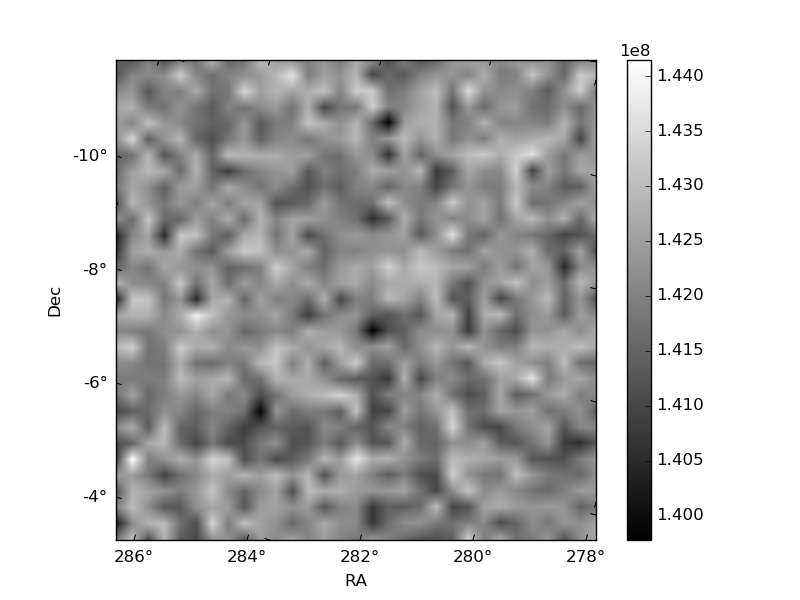
Quadrant B |
|---|---|---|---|
| Quadrant D | 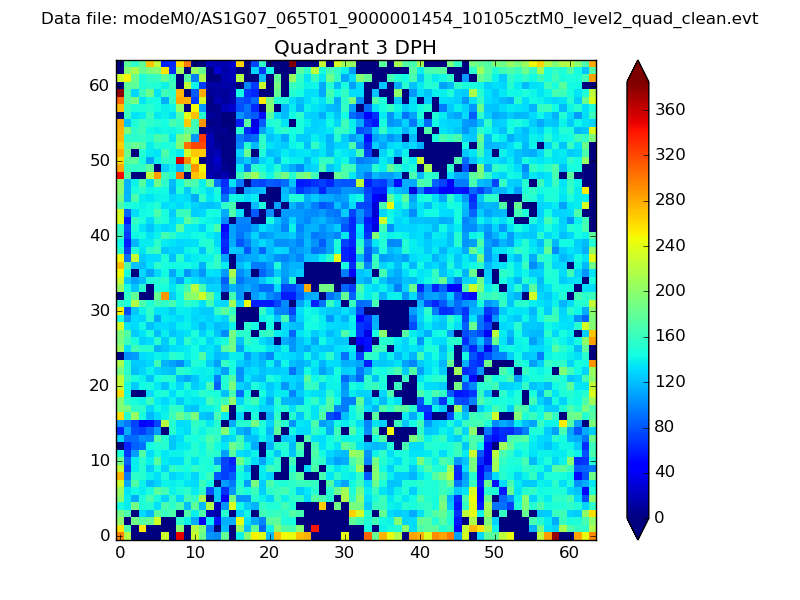 |
 |
Quadrant C |
| Plot type | Count rate plots | Images |
|---|---|---|
| Comparison with Poisson distribution Blue bars denote a histogram of data divided into 1 sec bins. Red curve is a Poisson curve with rate = median count rate of data. |
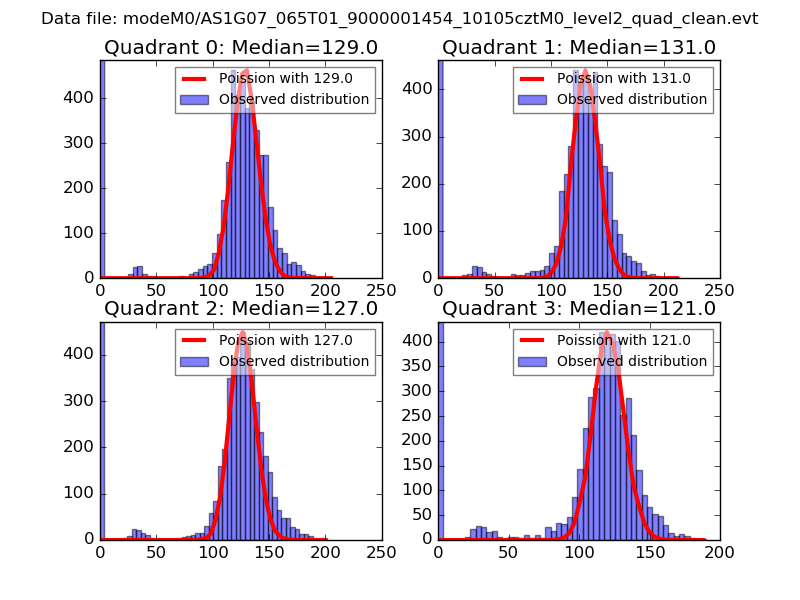 |
 |
| Quadrant-wise count rates Data is divided into 100 sec bins |
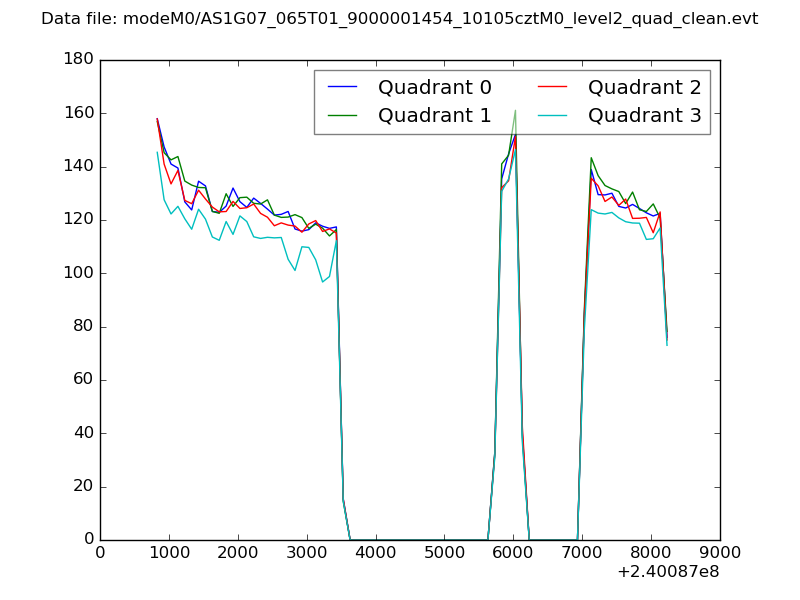 |
|
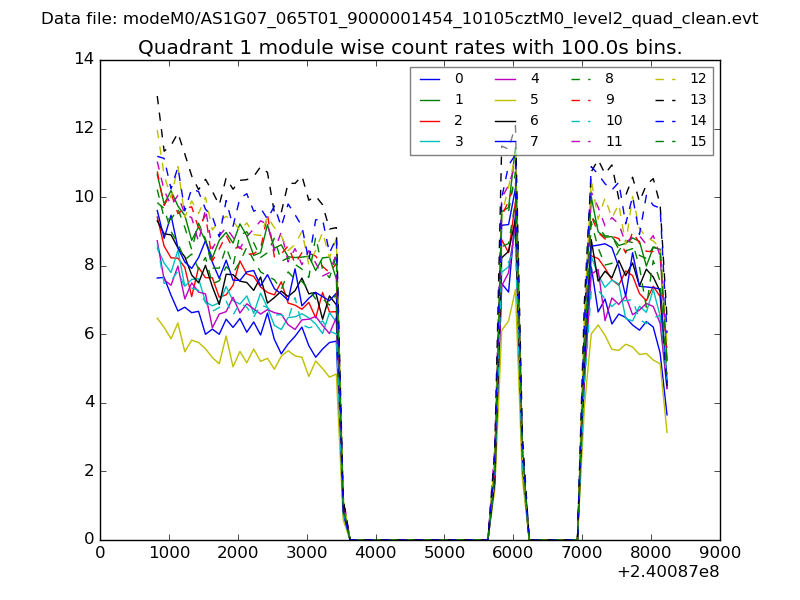
| Module-wise count rates for Quadrant A Data is divided into 100 sec bins |
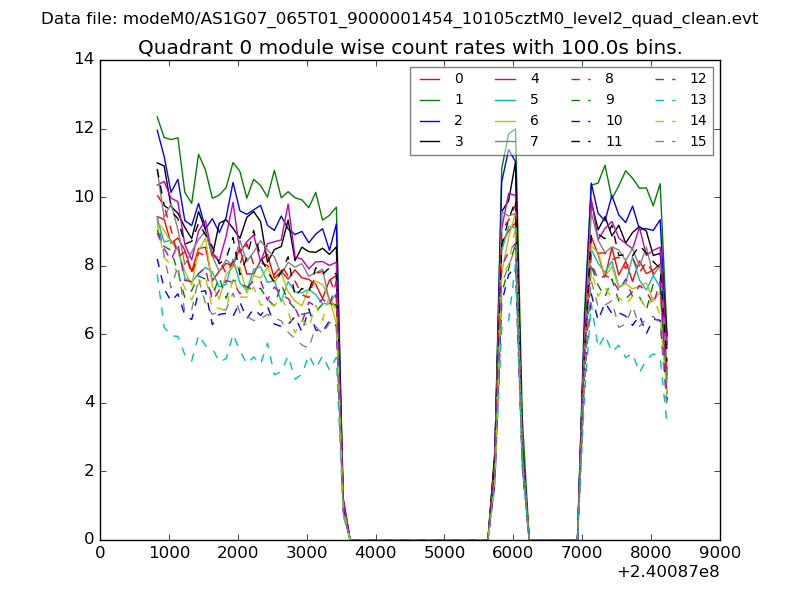 |
 |
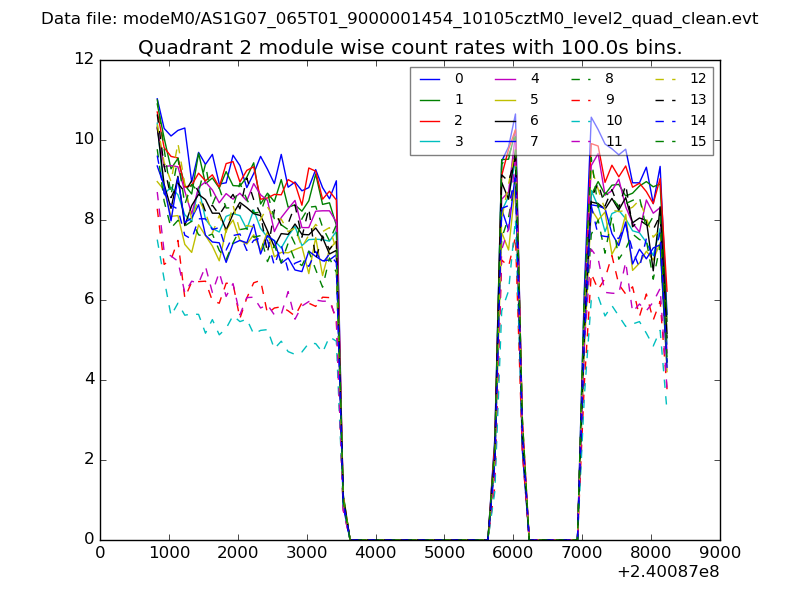
| Module-wise count rates for Quadrant B Data is divided into 100 sec bins |
 |
 |
| Module-wise count rates for Quadrant C Data is divided into 100 sec bins |
 |
 |
| Module-wise count rates for Quadrant D Data is divided into 100 sec bins |
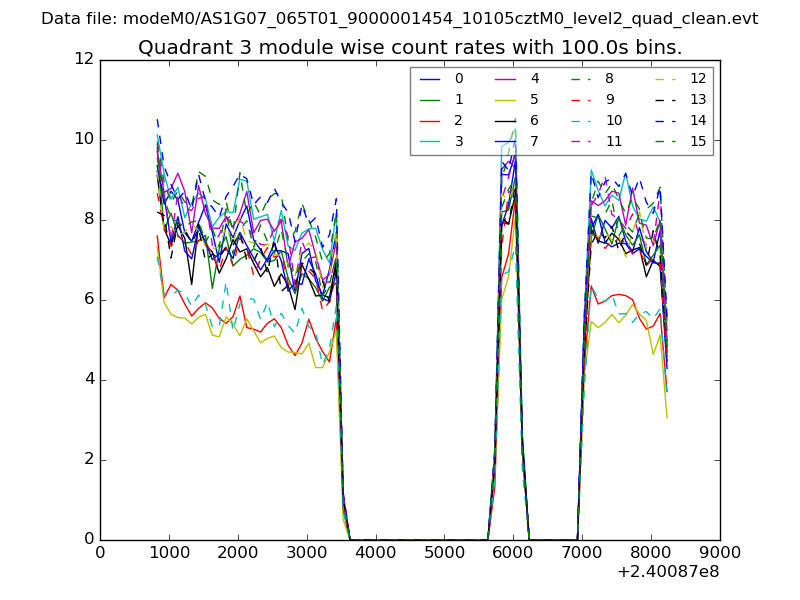 |
 |
| Parameter | Plot |
|---|---|
| CZT HV Monitor | 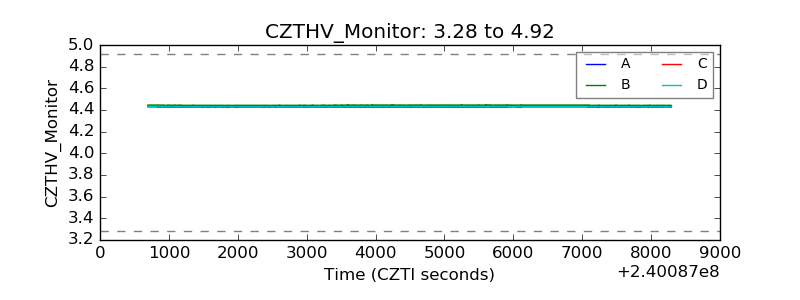 |
| D_VDD |  |
| Temperature 1 | 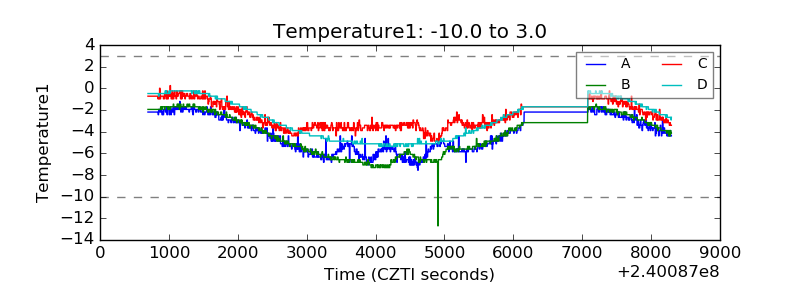 |
| Veto HV Monitor |  |
| Veto LLD | 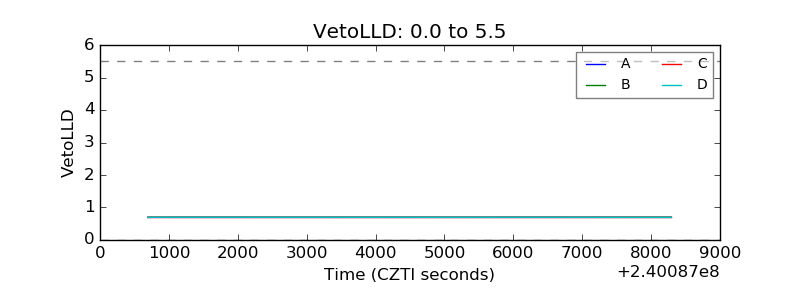 |
| Alpha Counter | 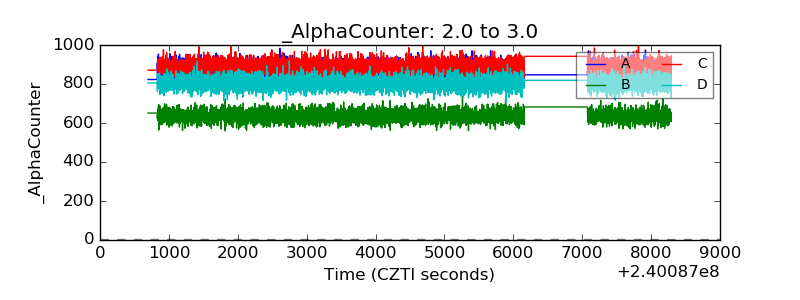 |
| _CPM_Rate | 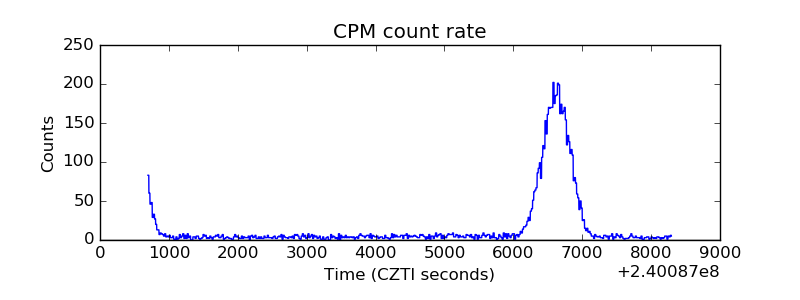 |
| CZT Counter | 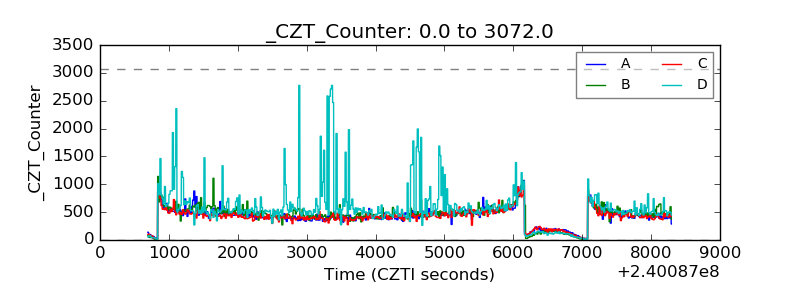 |
| +2.5 Volts monitor |  |
| +5 Volts monitor |  |
| _ROLL_ROT | 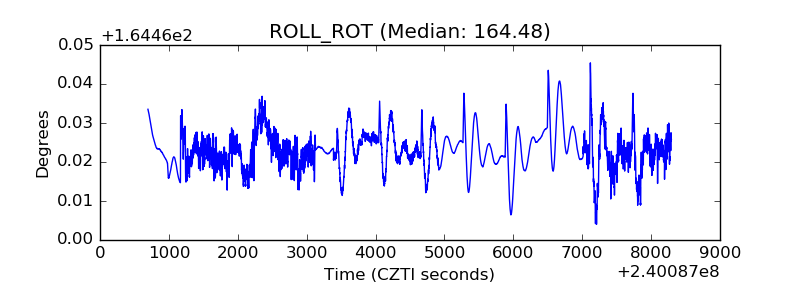 |
| _Roll_DEC | 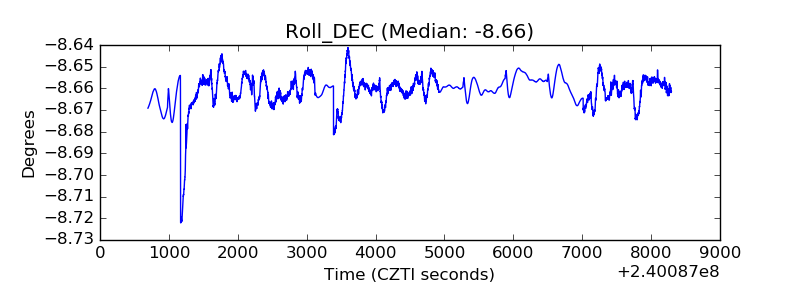 |
| _Roll_RA |  |
| Veto Counter | 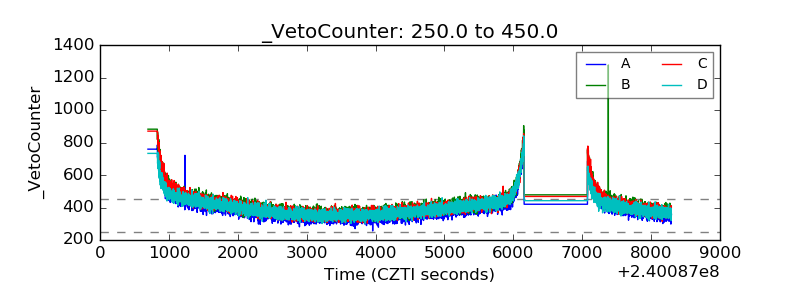 |