| Param | Original file | Final file |
|---|---|---|
| Filename | modeM0/AS1G07_065T01_9000001454_10106cztM0_level2.evt | modeM0/AS1G07_065T01_9000001454_10106cztM0_level2_quad_clean.evt |
| Size (bytes) | 453,723,840 | 93,280,320 |
| Size | 432.7 MB | 89.0 MB |
| Events in quadrant A | 3,198,506 | 593,555 |
| Events in quadrant B | 3,344,062 | 604,770 |
| Events in quadrant C | 3,111,806 | 585,799 |
| Events in quadrant D | 3,616,012 | 558,426 |
| Mode M0 | |||
|---|---|---|---|
| Quadrant | BADHDUFLAG | Total packets | Discarded packets |
| A | 0 | 14331 | 82 |
| B | 0 | 14616 | 80 |
| C | 0 | 14238 | 77 |
| D | 0 | 15318 | 78 |
| Mode M9 | |||
|---|---|---|---|
| Quadrant | BADHDUFLAG | Total packets | Discarded packets |
| A | 0 | 12 | 0 |
| B | 0 | 12 | 0 |
| C | 0 | 12 | 0 |
| D | 0 | 13 | 0 |
| Mode SS | |||
|---|---|---|---|
| Quadrant | BADHDUFLAG | Total packets | Discarded packets |
| A | 0 | 144 | 0 |
| B | 0 | 144 | 0 |
| C | 0 | 144 | 4 |
| D | 0 | 144 | 0 |
| Quadrant | Total seconds | Saturated seconds | Saturation percentage |
|---|---|---|---|
| A | 6913 | 29 | 0.419499% |
| B | 6915 | 45 | 0.650759% |
| C | 6915 | 9 | 0.130152% |
| D | 6915 | 28 | 0.404917% |
Noise dominated data is calculated using 1-second bins in cleaned event files. If a bin has >2000 counts, and if more than 50% of those come from <1% of pixels, then it is considered to be noise-dominated and hence unusable.
| Quadrant | # 1 sec bins | Bins with >0 counts | Bins with >2000 counts | High rate bins dominated by noise | Noise dominated (total time) | Noise dominated (detector-on time) | Marked lightcurve |
|---|---|---|---|---|---|---|---|
| A | 7532 | 6953 | 0 | 0 | 0.00% | 0.00% |  |
| B | 7532 | 6952 | 6 | 6 | 0.08% | 0.09% | 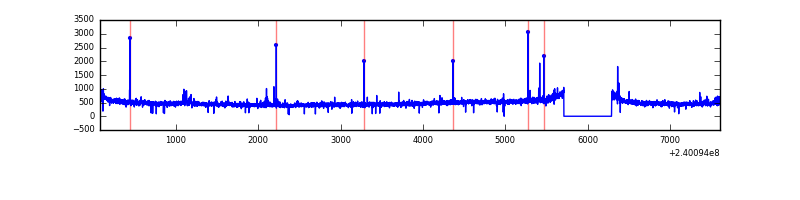 |
| C | 7532 | 6950 | 0 | 0 | 0.00% | 0.00% | 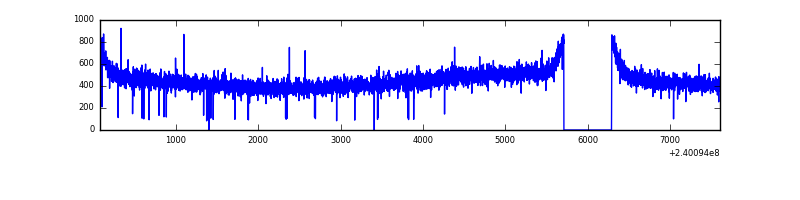 |
| D | 7532 | 6950 | 17 | 17 | 0.23% | 0.24% | 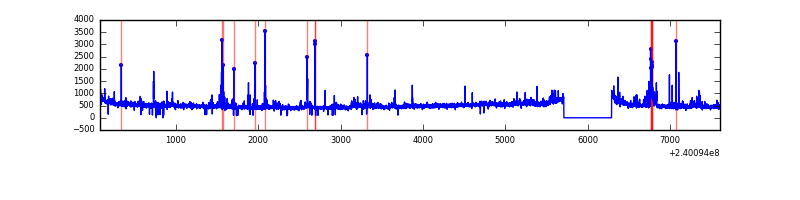 |
Top three noisy pixels from each quadrant. If the there are fewer than three noisy pixels in the level2.evt file, extra rows are filled as -1
| Pixel properties | Quadrant properties | ||||||
|---|---|---|---|---|---|---|---|
| Quadrant | DetID | PixID | Counts | Sigma | Mean | Median | Sigma |
| A | 14 | 223 | 14850 | 82.6 | 827 | 807 | 170.0 |
| A | 0 | 226 | 7628 | 40.12 | 827 | 807 | 170.0 |
| A | 12 | 194 | 6794 | 35.21 | 827 | 807 | 170.0 |
| B | 0 | 214 | 49116 | 300.21 | 830 | 809 | 160.9 |
| B | 0 | 189 | 26210 | 157.86 | 830 | 809 | 160.9 |
| B | 12 | 111 | 16801 | 99.38 | 830 | 809 | 160.9 |
| C | 13 | 61 | 5908 | 27.64 | 796 | 799 | 184.8 |
| C | 8 | 222 | 3395 | 14.05 | 796 | 799 | 184.8 |
| C | 14 | 67 | 2578 | 9.63 | 796 | 799 | 184.8 |
| D | 8 | 195 | 245962 | 1163.25 | 786 | 770 | 210.8 |
| D | 1 | 52 | 160192 | 756.34 | 786 | 770 | 210.8 |
| D | 2 | 152 | 69306 | 325.15 | 786 | 770 | 210.8 |
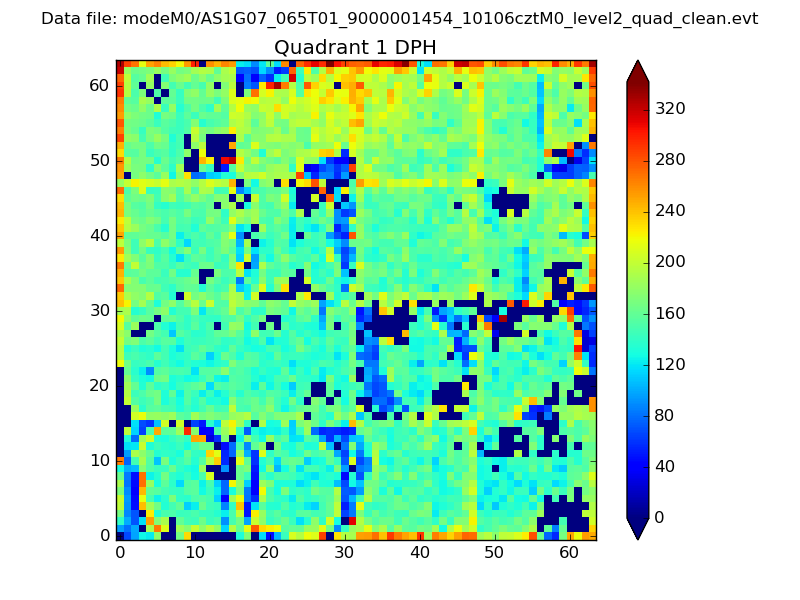
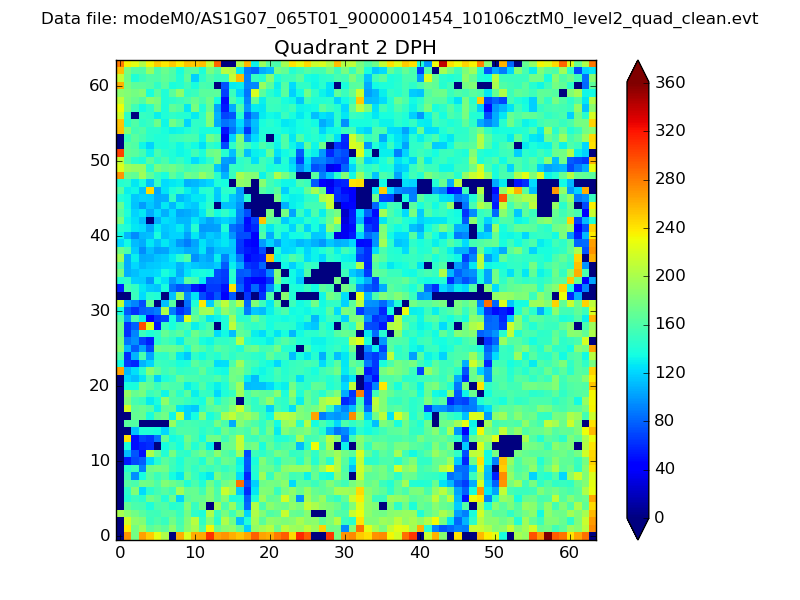
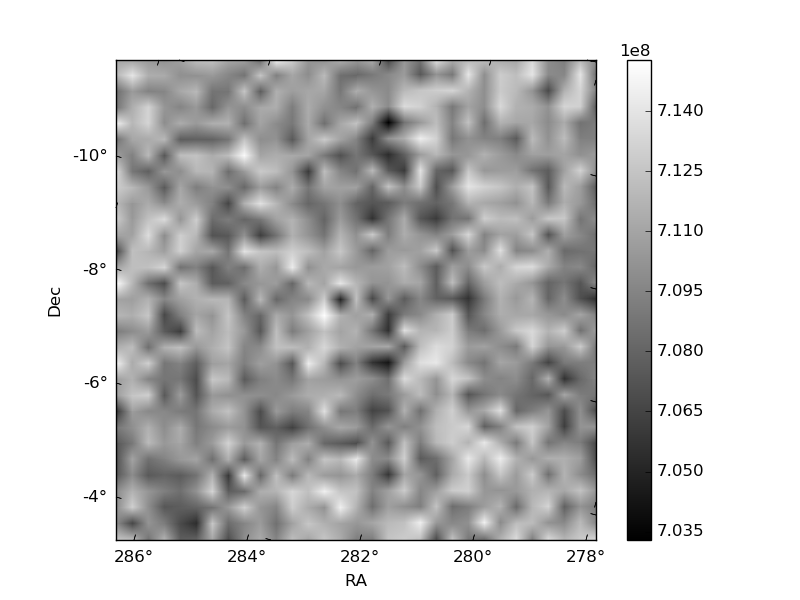
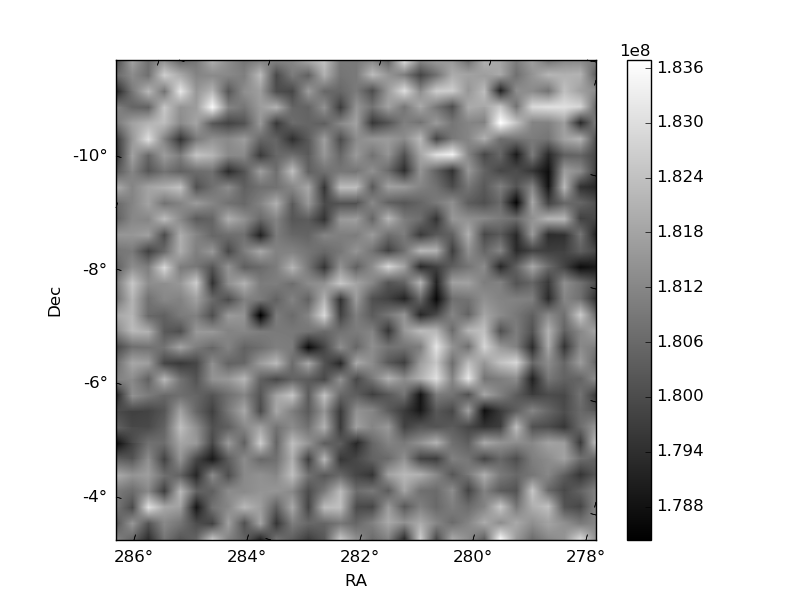
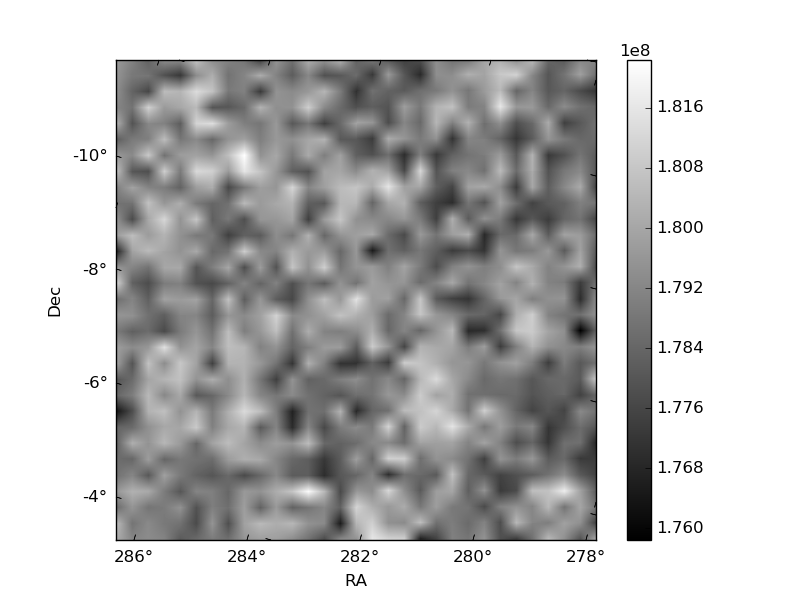
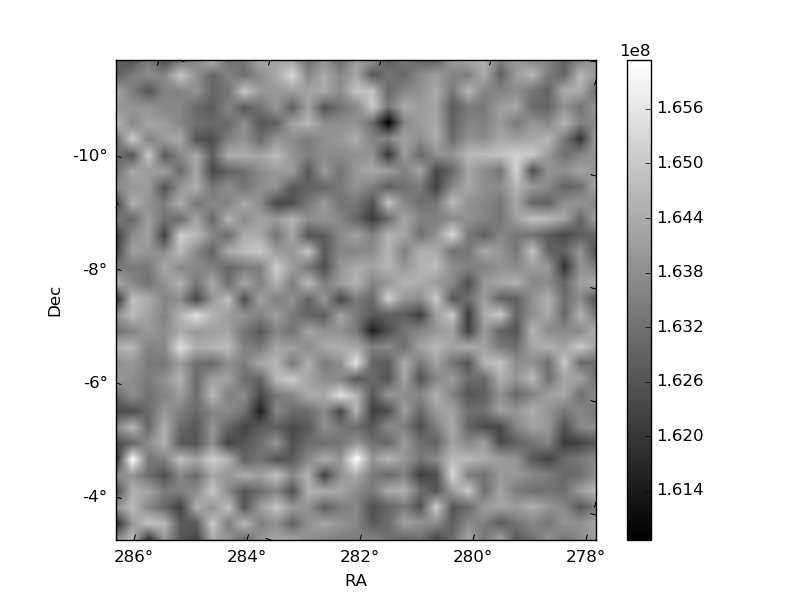
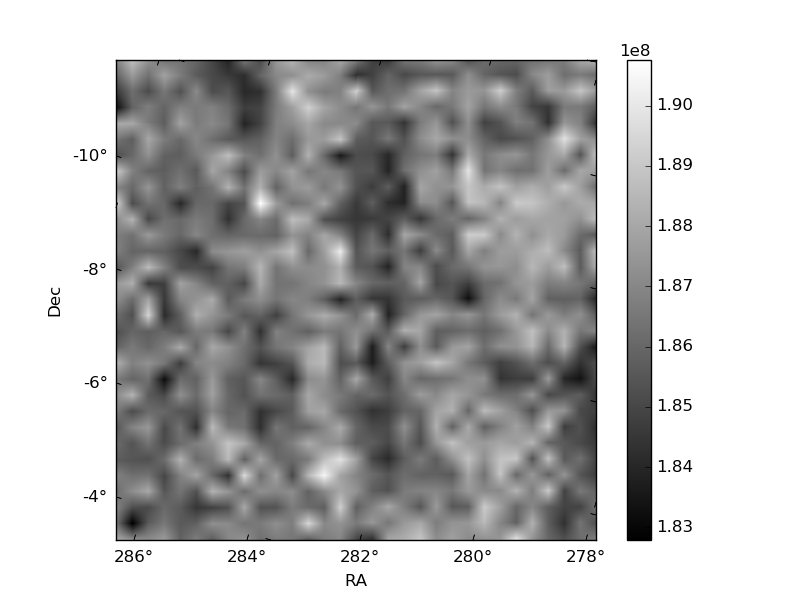
Histogram calculated using DETX and DETY for each event in the final _common_clean file
| Quadrant A | 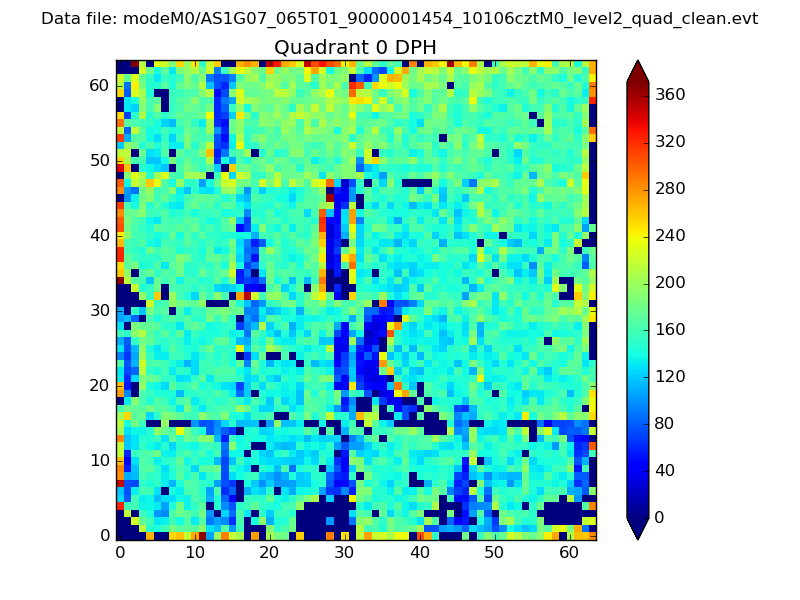 |
 |
Quadrant B |
|---|---|---|---|
| Quadrant D | 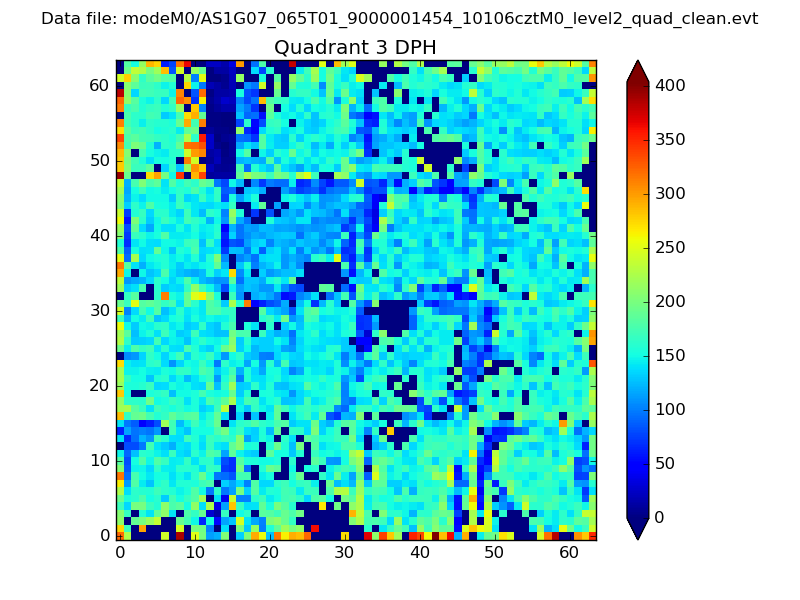 |
 |
Quadrant C |
| Plot type | Count rate plots | Images |
|---|---|---|
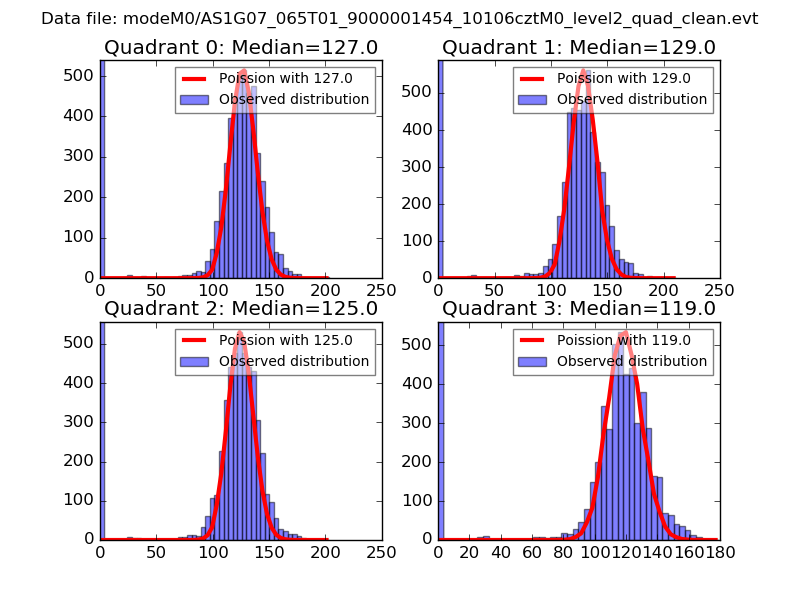
| Comparison with Poisson distribution Blue bars denote a histogram of data divided into 1 sec bins. Red curve is a Poisson curve with rate = median count rate of data. |
 |
 |
| Quadrant-wise count rates Data is divided into 100 sec bins |
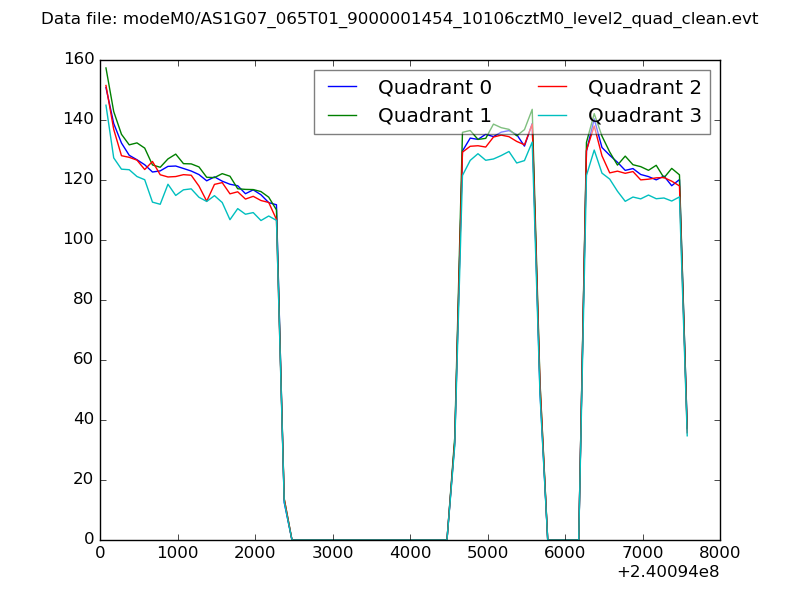 |
|
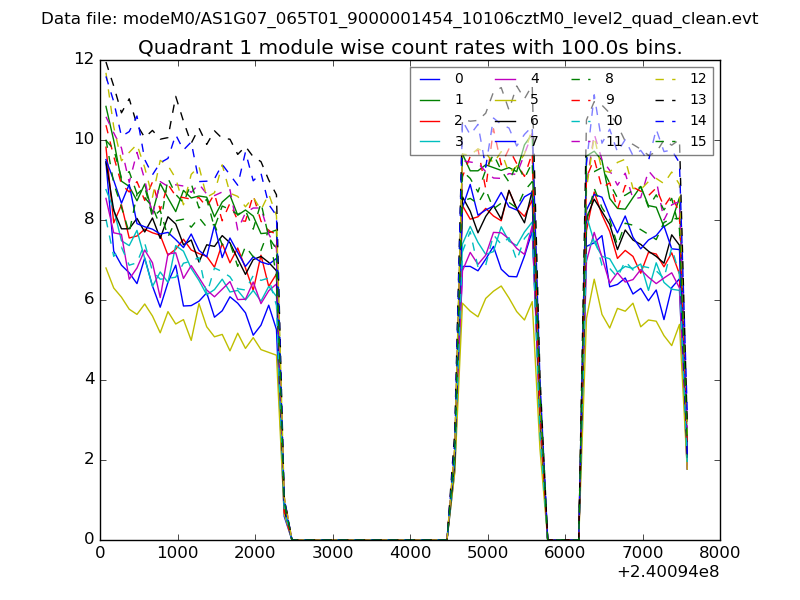
| Module-wise count rates for Quadrant A Data is divided into 100 sec bins |
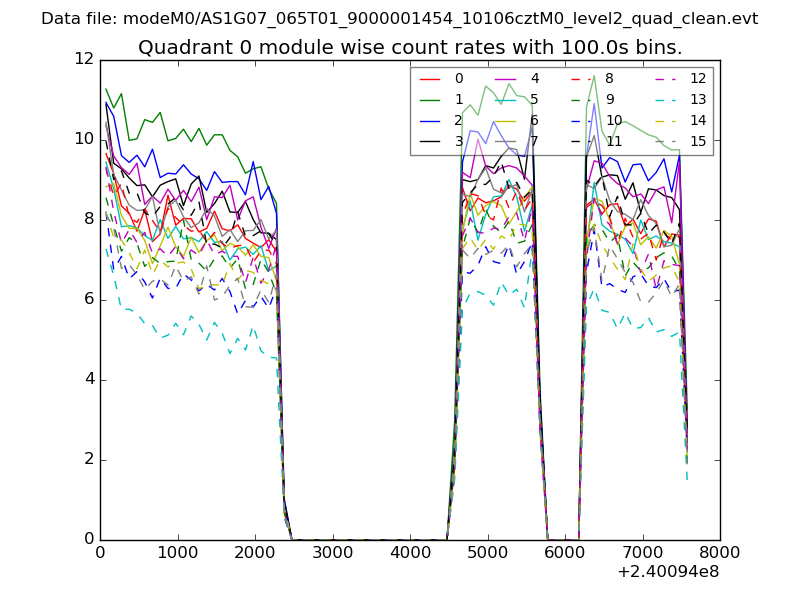 |
 |
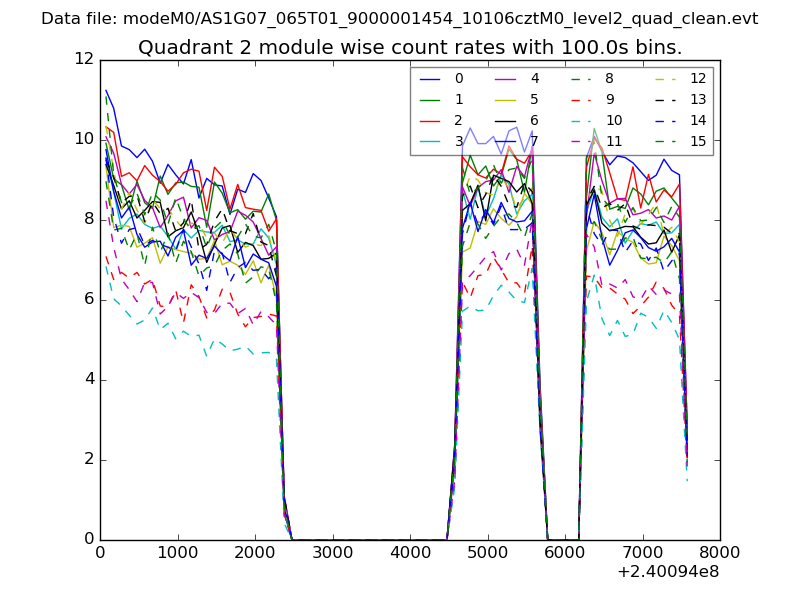
| Module-wise count rates for Quadrant B Data is divided into 100 sec bins |
 |
 |
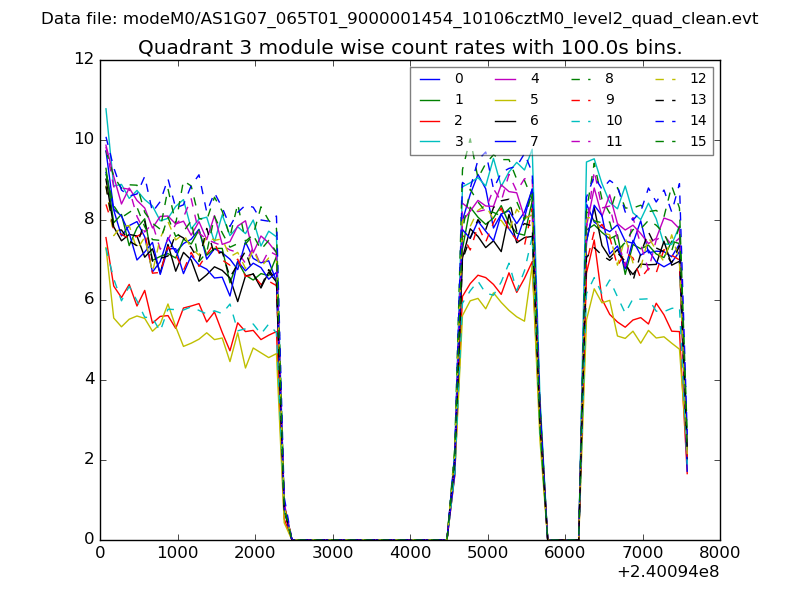
| Module-wise count rates for Quadrant C Data is divided into 100 sec bins |
 |
 |
| Module-wise count rates for Quadrant D Data is divided into 100 sec bins |
 |
 |
| Parameter | Plot |
|---|---|
| CZT HV Monitor | 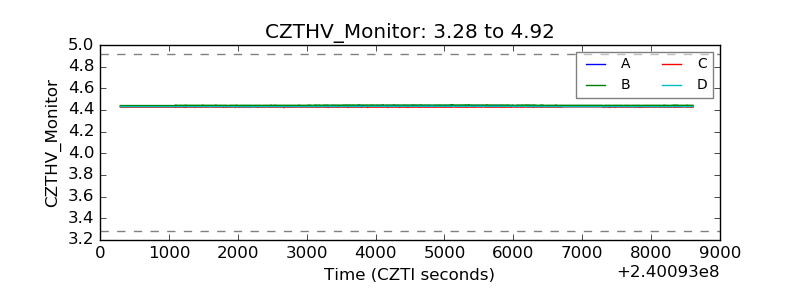 |
| D_VDD | 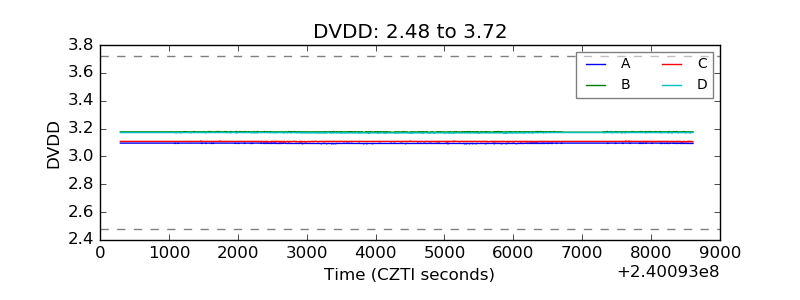 |
| Temperature 1 | 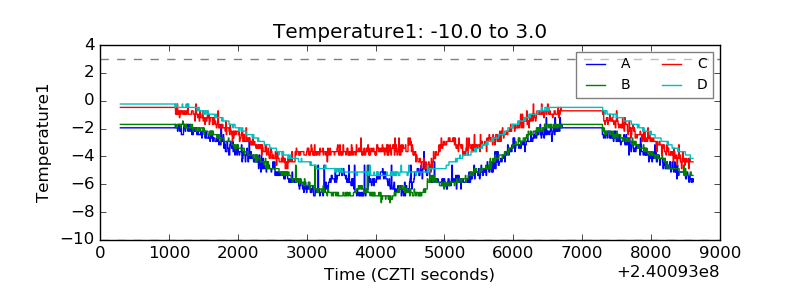 |
| Veto HV Monitor | 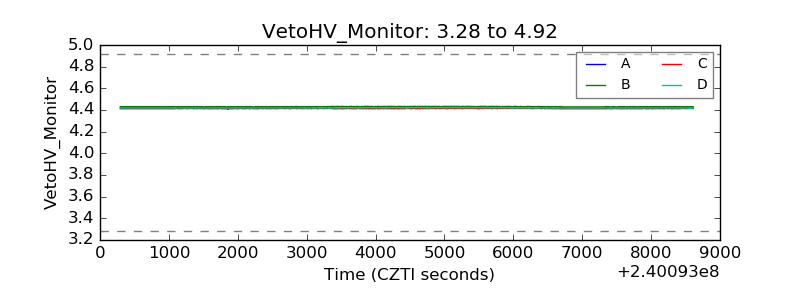 |
| Veto LLD | 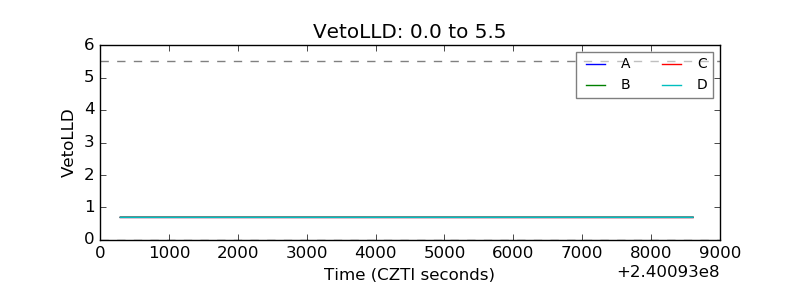 |
| Alpha Counter | 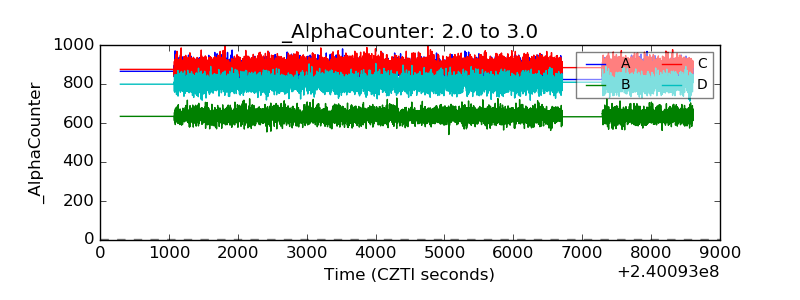 |
| _CPM_Rate | 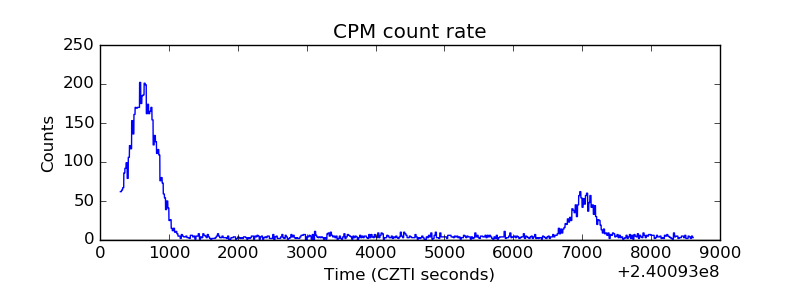 |
| CZT Counter | 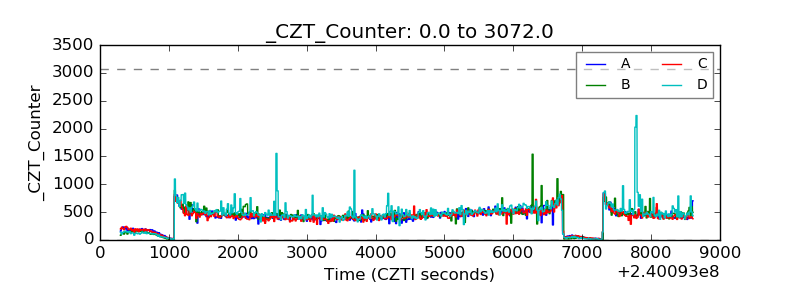 |
| +2.5 Volts monitor |  |
| +5 Volts monitor |  |
| _ROLL_ROT | 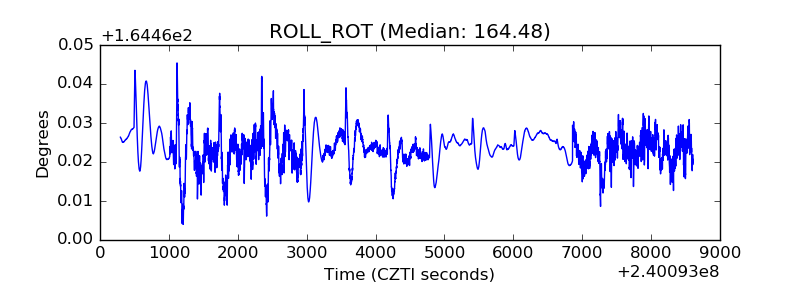 |
| _Roll_DEC | 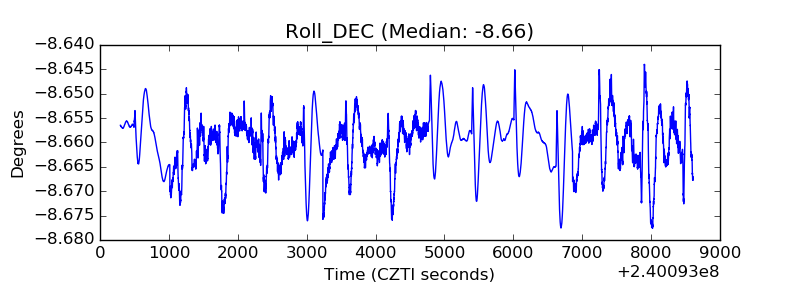 |
| _Roll_RA | 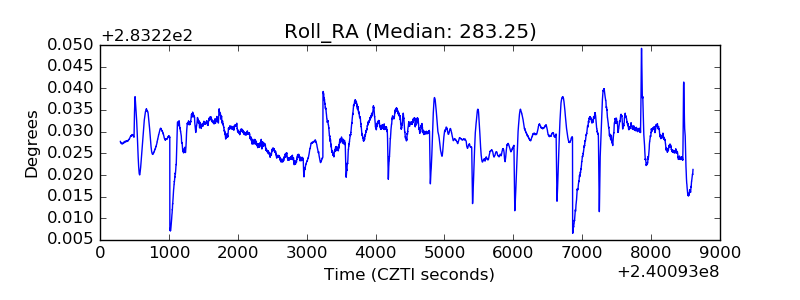 |
| Veto Counter | 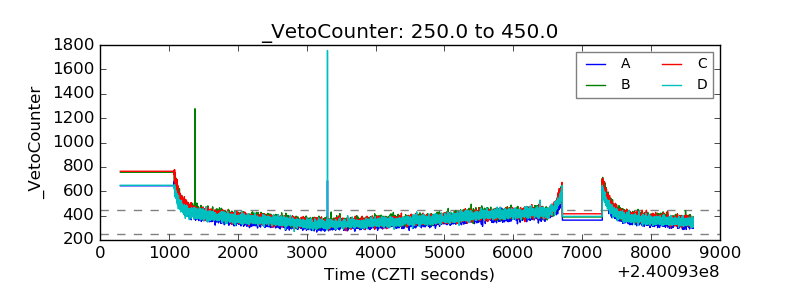 |