| Param | Original file | Final file |
|---|---|---|
| Filename | modeM0/AS1G07_065T01_9000001454_10108cztM0_level2.evt | modeM0/AS1G07_065T01_9000001454_10108cztM0_level2_quad_clean.evt |
| Size (bytes) | 523,494,720 | 98,593,920 |
| Size | 499.2 MB | 94.0 MB |
| Events in quadrant A | 3,570,849 | 621,179 |
| Events in quadrant B | 3,886,161 | 631,781 |
| Events in quadrant C | 3,435,600 | 616,618 |
| Events in quadrant D | 4,441,769 | 583,794 |
| Mode M0 | |||
|---|---|---|---|
| Quadrant | BADHDUFLAG | Total packets | Discarded packets |
| A | 0 | 15927 | 48 |
| B | 0 | 16784 | 54 |
| C | 0 | 15752 | 50 |
| D | 0 | 18311 | 52 |
| Mode M9 | |||
|---|---|---|---|
| Quadrant | BADHDUFLAG | Total packets | Discarded packets |
| A | 0 | 6 | 0 |
| B | 0 | 6 | 0 |
| C | 0 | 6 | 0 |
| D | 0 | 6 | 0 |
| Mode SS | |||
|---|---|---|---|
| Quadrant | BADHDUFLAG | Total packets | Discarded packets |
| A | 0 | 158 | 0 |
| B | 0 | 158 | 2 |
| C | 0 | 158 | 0 |
| D | 0 | 158 | 2 |
| Quadrant | Total seconds | Saturated seconds | Saturation percentage |
|---|---|---|---|
| A | 7653 | 70 | 0.914674% |
| B | 7655 | 117 | 1.528413% |
| C | 7652 | 35 | 0.457397% |
| D | 7656 | 121 | 1.580460% |
Noise dominated data is calculated using 1-second bins in cleaned event files. If a bin has >2000 counts, and if more than 50% of those come from <1% of pixels, then it is considered to be noise-dominated and hence unusable.
| Quadrant | # 1 sec bins | Bins with >0 counts | Bins with >2000 counts | High rate bins dominated by noise | Noise dominated (total time) | Noise dominated (detector-on time) | Marked lightcurve |
|---|---|---|---|---|---|---|---|
| A | 8356 | 7677 | 0 | 0 | 0.00% | 0.00% | 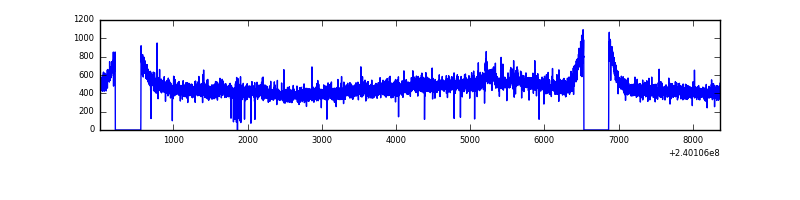 |
| B | 8356 | 7676 | 8 | 8 | 0.10% | 0.10% |  |
| C | 8356 | 7678 | 0 | 0 | 0.00% | 0.00% | 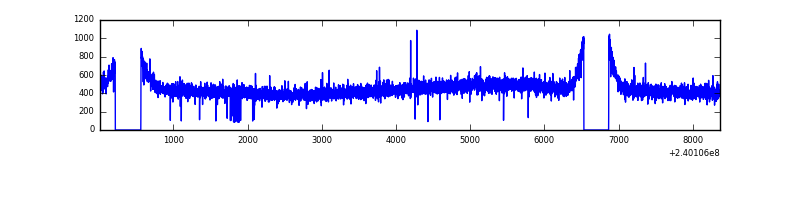 |
| D | 8356 | 7678 | 75 | 75 | 0.90% | 0.98% | 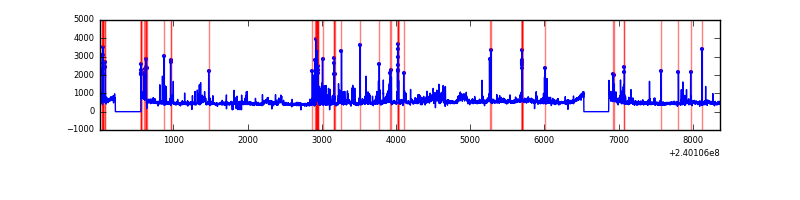 |
Top three noisy pixels from each quadrant. If the there are fewer than three noisy pixels in the level2.evt file, extra rows are filled as -1
| Pixel properties | Quadrant properties | ||||||
|---|---|---|---|---|---|---|---|
| Quadrant | DetID | PixID | Counts | Sigma | Mean | Median | Sigma |
| A | 8 | 15 | 39107 | 204.15 | 908 | 889 | 187.2 |
| A | 15 | 174 | 19862 | 101.35 | 908 | 889 | 187.2 |
| A | 8 | 157 | 10795 | 52.91 | 908 | 889 | 187.2 |
| B | 0 | 214 | 97255 | 544.36 | 914 | 893 | 177.0 |
| B | 4 | 81 | 96425 | 539.67 | 914 | 893 | 177.0 |
| B | 4 | 239 | 92308 | 516.41 | 914 | 893 | 177.0 |
| C | 14 | 67 | 7439 | 31.84 | 878 | 882 | 205.9 |
| C | 13 | 61 | 6563 | 27.59 | 878 | 882 | 205.9 |
| C | 4 | 175 | 2918 | 9.89 | 878 | 882 | 205.9 |
| D | 1 | 52 | 399984 | 1875.35 | 870 | 844 | 212.8 |
| D | 8 | 195 | 318457 | 1492.29 | 870 | 844 | 212.8 |
| D | 12 | 233 | 250692 | 1173.9 | 870 | 844 | 212.8 |
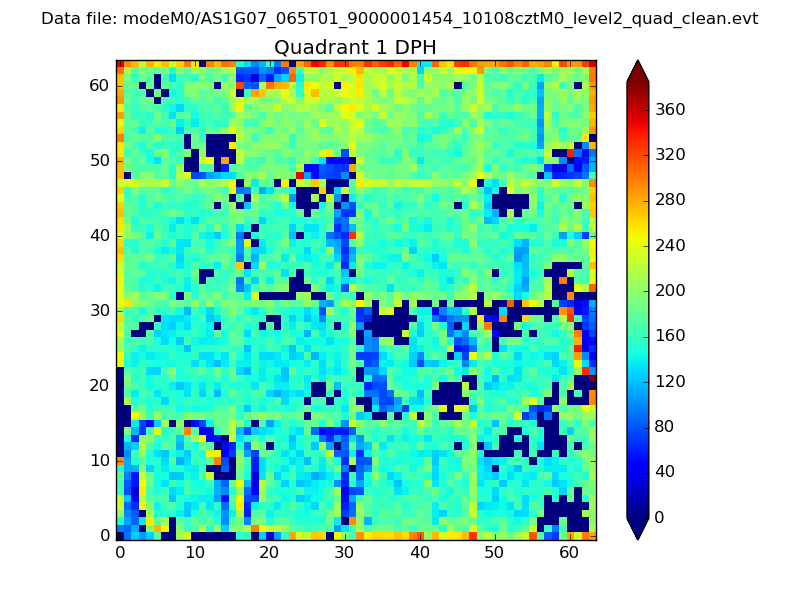
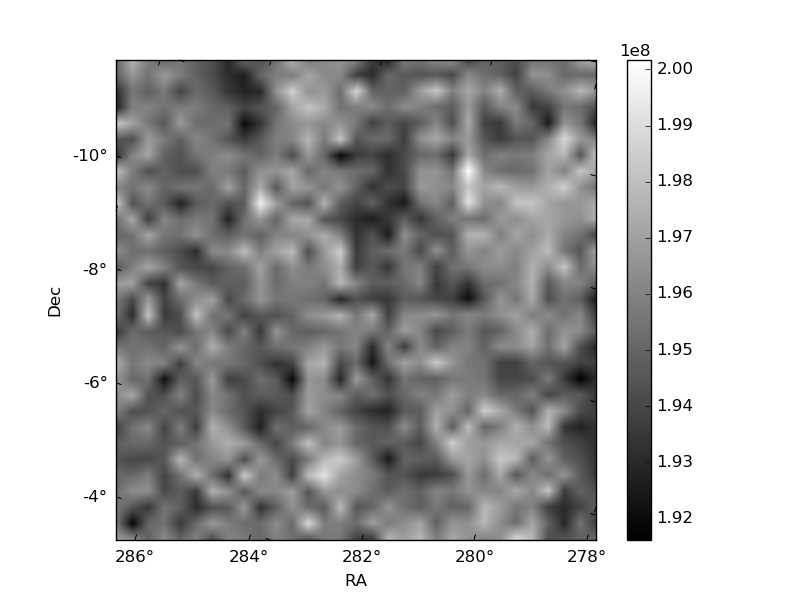
Histogram calculated using DETX and DETY for each event in the final _common_clean file
| Quadrant A |  |
 |
Quadrant B |
|---|---|---|---|
| Quadrant D | 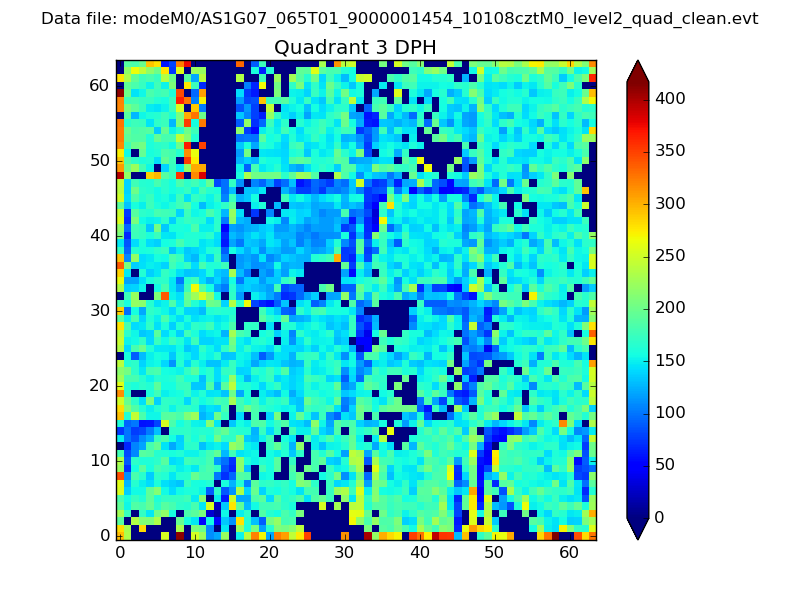 |
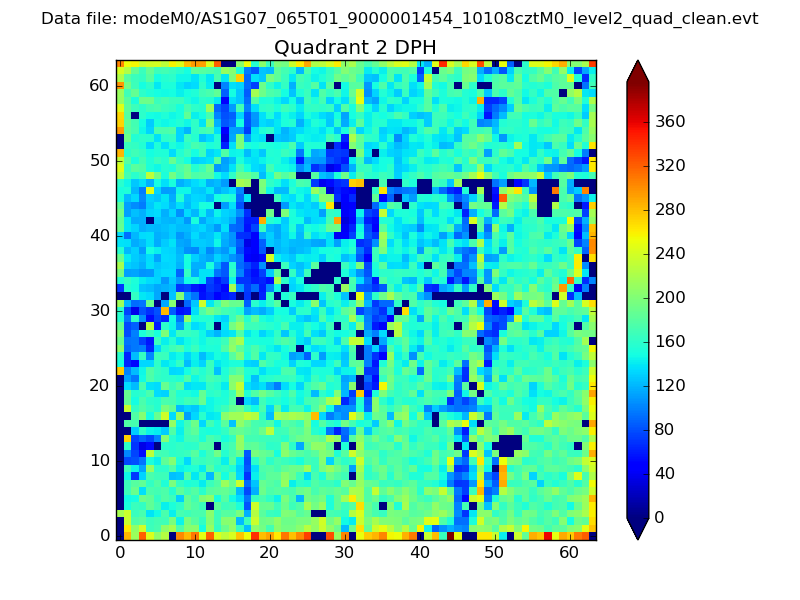 |
Quadrant C |
| Plot type | Count rate plots | Images |
|---|---|---|
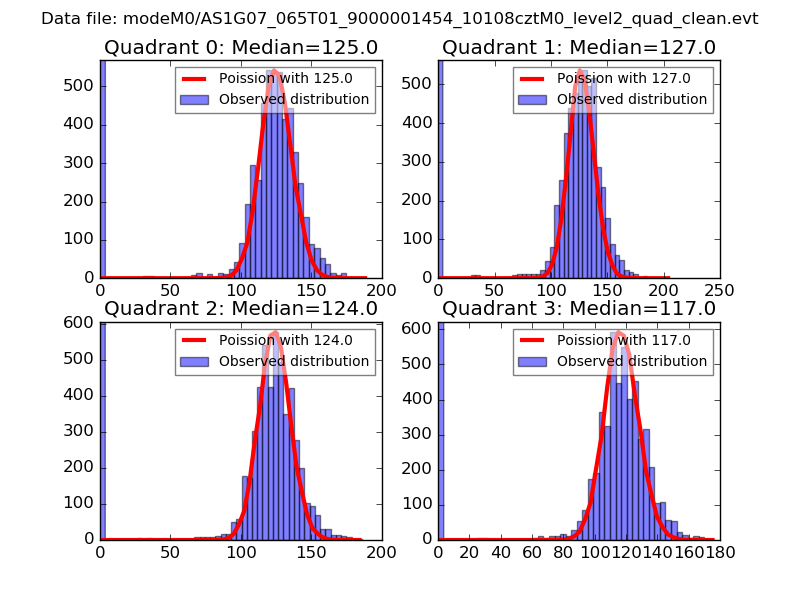
| Comparison with Poisson distribution Blue bars denote a histogram of data divided into 1 sec bins. Red curve is a Poisson curve with rate = median count rate of data. |
 |
 |
| Quadrant-wise count rates Data is divided into 100 sec bins |
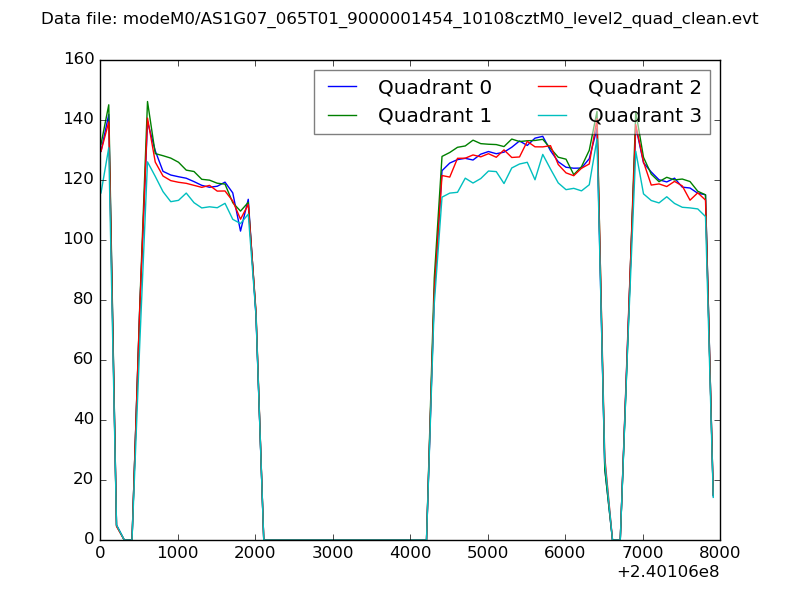 |
|
| Module-wise count rates for Quadrant A Data is divided into 100 sec bins |
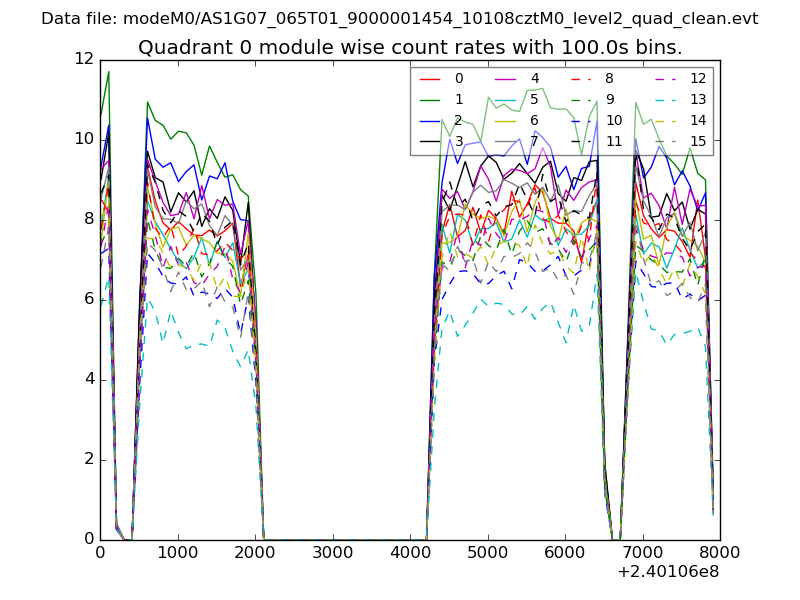 |
 |
| Module-wise count rates for Quadrant B Data is divided into 100 sec bins |
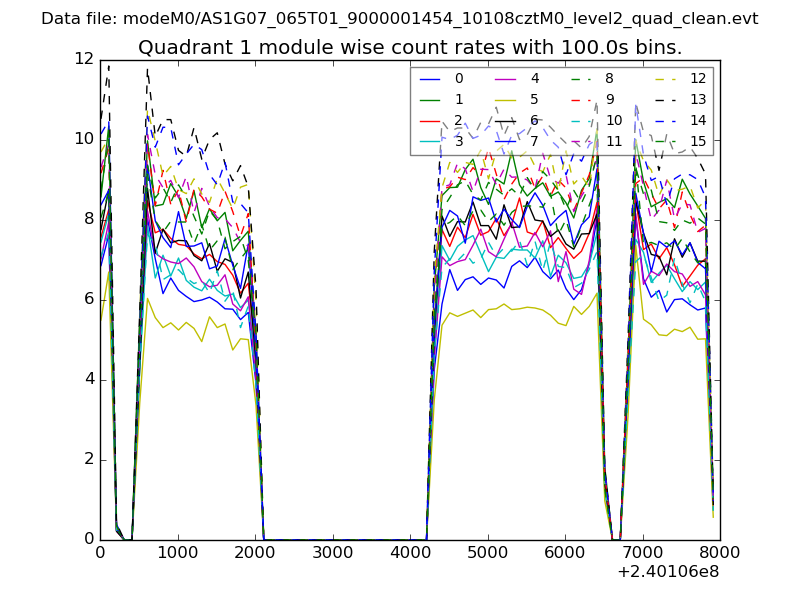 |
 |
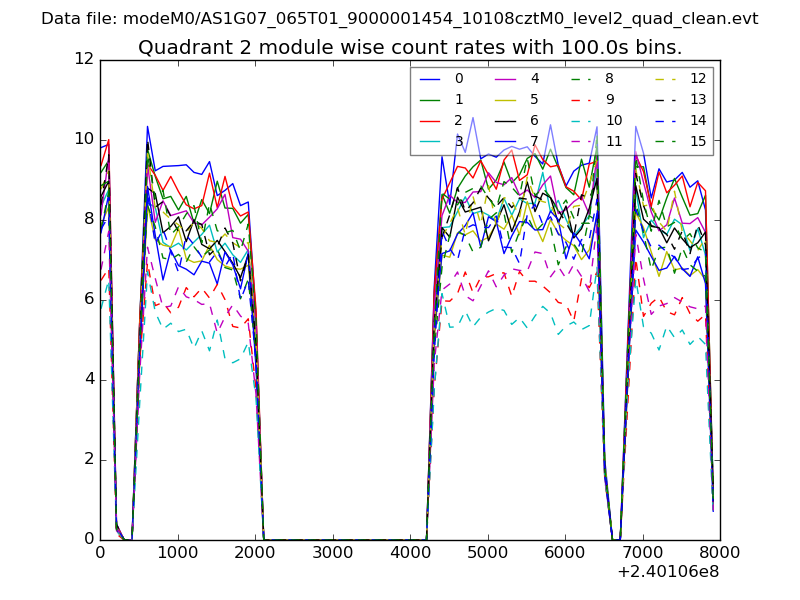
| Module-wise count rates for Quadrant C Data is divided into 100 sec bins |
 |
 |
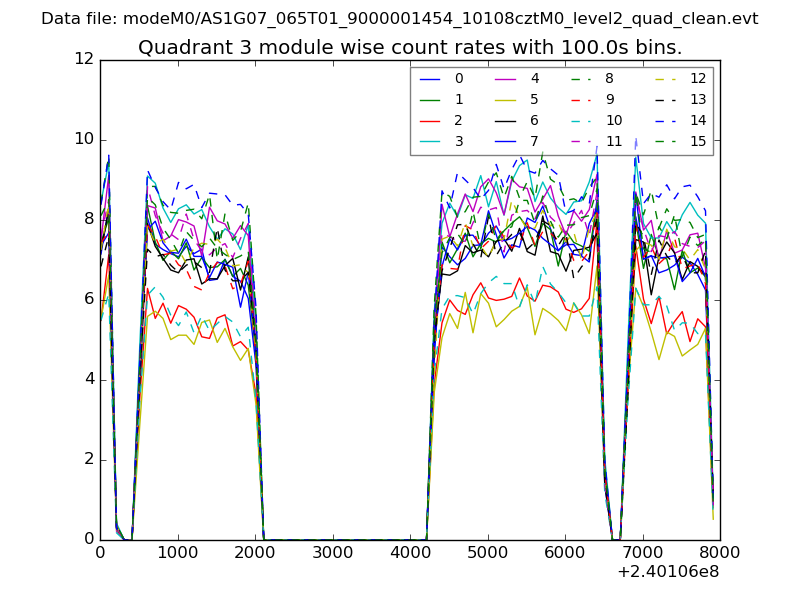
| Module-wise count rates for Quadrant D Data is divided into 100 sec bins |
 |
 |
| Parameter | Plot |
|---|---|
| CZT HV Monitor | 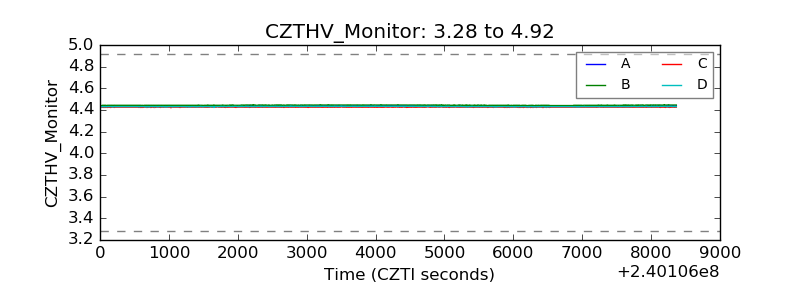 |
| D_VDD | 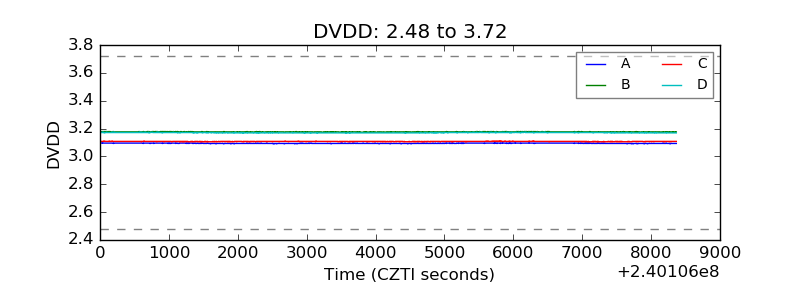 |
| Temperature 1 | 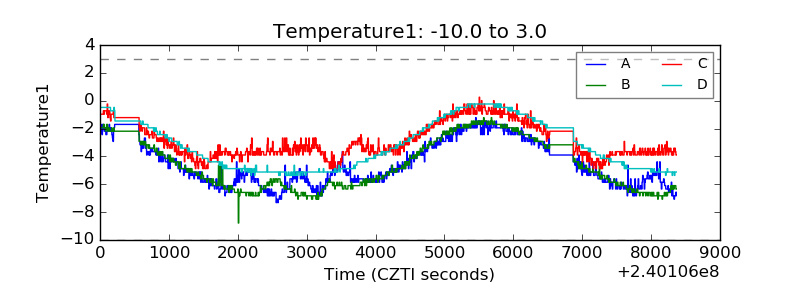 |
| Veto HV Monitor | 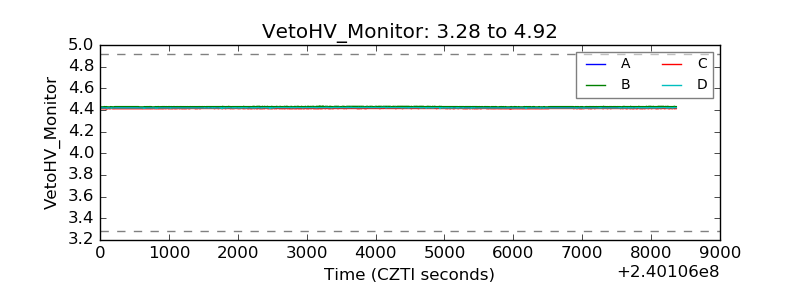 |
| Veto LLD | 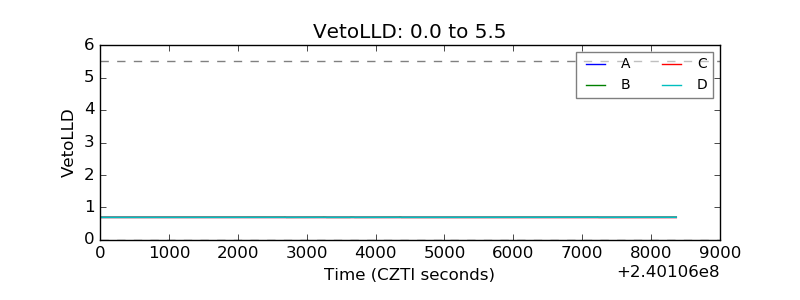 |
| Alpha Counter | 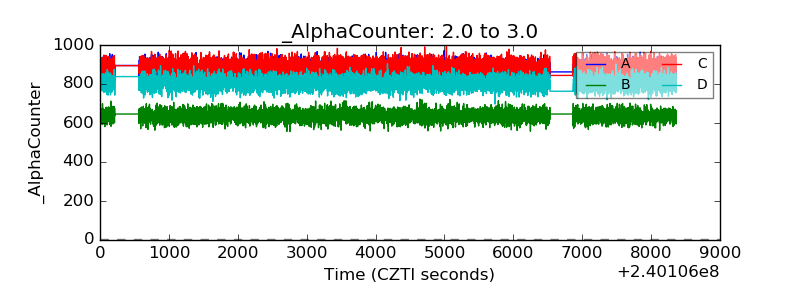 |
| _CPM_Rate | 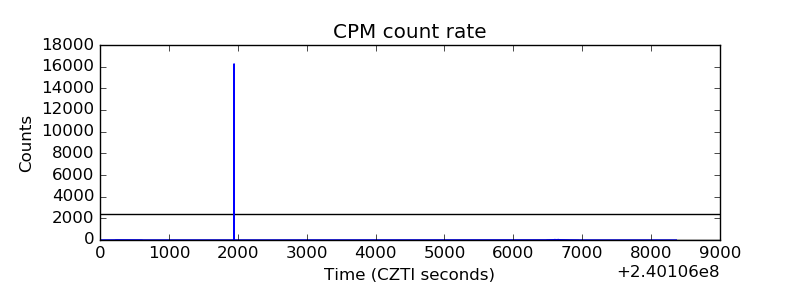 |
| CZT Counter |  |
| +2.5 Volts monitor |  |
| +5 Volts monitor |  |
| _ROLL_ROT | 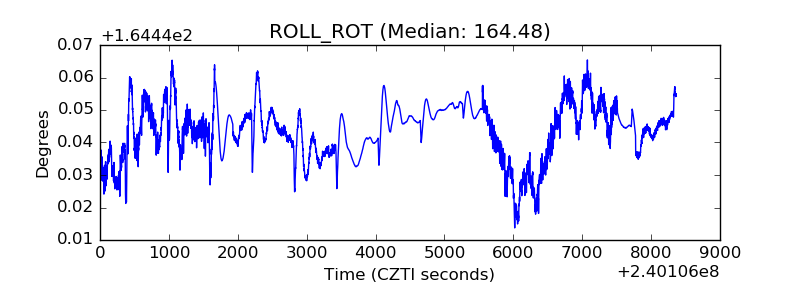 |
| _Roll_DEC | 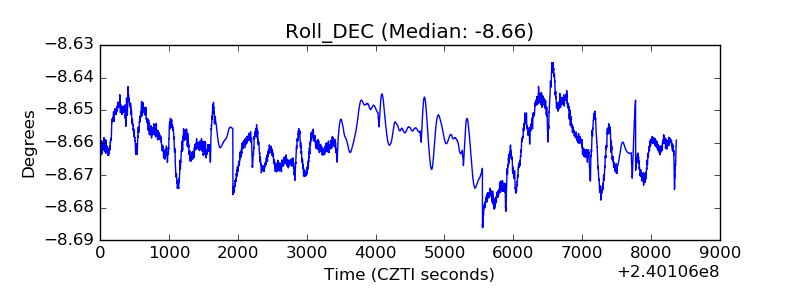 |
| _Roll_RA | 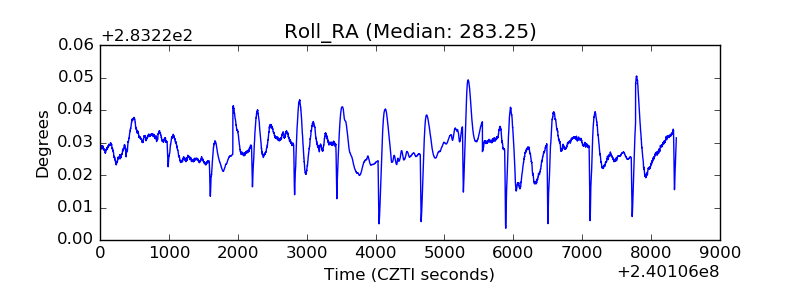 |
| Veto Counter | 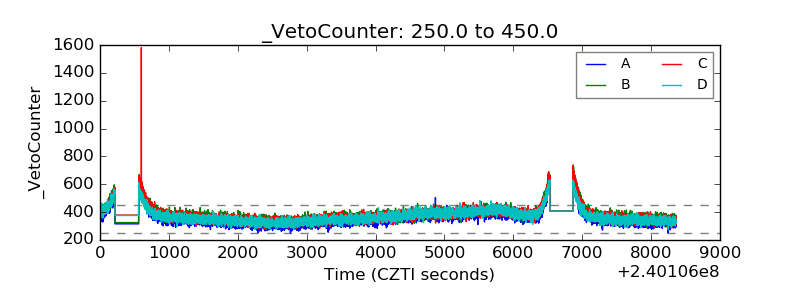 |