| Param | Original file | Final file |
|---|---|---|
| Filename | modeM0/AS1G07_065T01_9000001454_10115cztM0_level2.evt | modeM0/AS1G07_065T01_9000001454_10115cztM0_level2_quad_clean.evt |
| Size (bytes) | 2,606,826,240 | 440,449,920 |
| Size | 2.4 GB | 420.0 MB |
| Events in quadrant A | 17,279,765 | 2,822,039 |
| Events in quadrant B | 17,476,669 | 2,866,315 |
| Events in quadrant C | 15,947,241 | 2,792,855 |
| Events in quadrant D | 25,894,021 | 2,465,481 |
| Mode M0 | |||
|---|---|---|---|
| Quadrant | BADHDUFLAG | Total packets | Discarded packets |
| A | 0 | 74476 | 14 |
| B | 0 | 74056 | 14 |
| C | 0 | 71246 | 18 |
| D | 0 | 98780 | 24 |
| Mode M9 | |||
|---|---|---|---|
| Quadrant | BADHDUFLAG | Total packets | Discarded packets |
| A | 0 | 56 | 1 |
| B | 0 | 56 | 0 |
| C | 0 | 56 | 0 |
| D | 0 | 56 | 0 |
| Mode SS | |||
|---|---|---|---|
| Quadrant | BADHDUFLAG | Total packets | Discarded packets |
| A | 0 | 712 | 0 |
| B | 0 | 712 | 0 |
| C | 0 | 712 | 0 |
| D | 0 | 712 | 0 |
| Quadrant | Total seconds | Saturated seconds | Saturation percentage |
|---|---|---|---|
| A | 34831 | 334 | 0.958916% |
| B | 34830 | 453 | 1.300603% |
| C | 34828 | 224 | 0.643161% |
| D | 34827 | 2965 | 8.513510% |
Noise dominated data is calculated using 1-second bins in cleaned event files. If a bin has >2000 counts, and if more than 50% of those come from <1% of pixels, then it is considered to be noise-dominated and hence unusable.
| Quadrant | # 1 sec bins | Bins with >0 counts | Bins with >2000 counts | High rate bins dominated by noise | Noise dominated (total time) | Noise dominated (detector-on time) | Marked lightcurve |
|---|---|---|---|---|---|---|---|
| A | 40463 | 34835 | 0 | 0 | 0.00% | 0.00% | 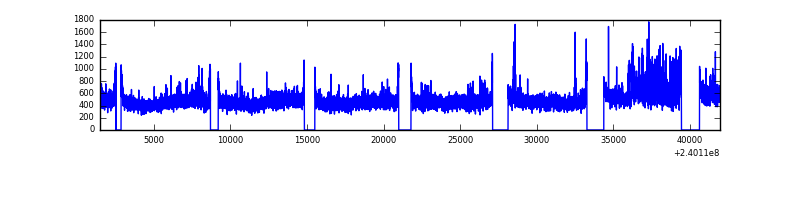 |
| B | 40463 | 34834 | 53 | 53 | 0.13% | 0.15% | 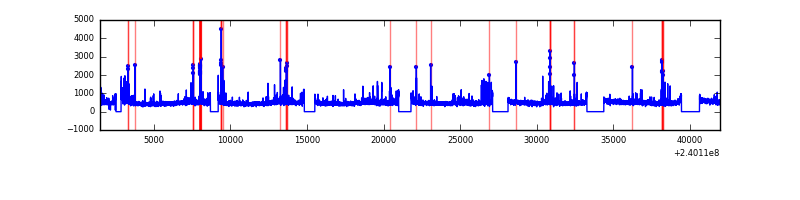 |
| C | 40463 | 34837 | 0 | 0 | 0.00% | 0.00% | 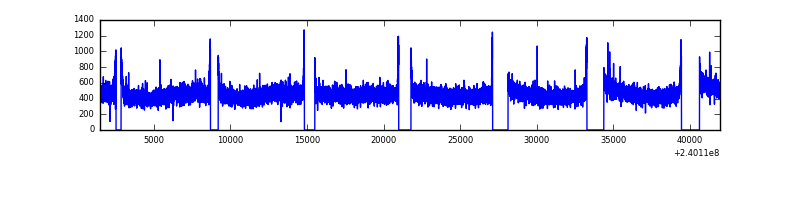 |
| D | 40463 | 34835 | 2689 | 2689 | 6.65% | 7.72% | 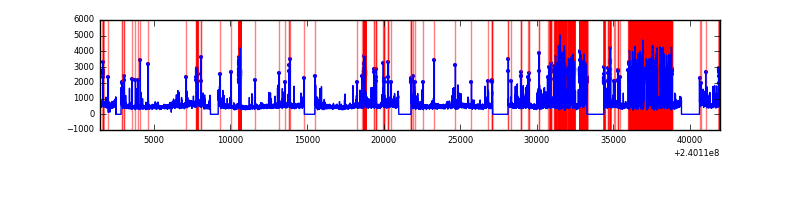 |
Top three noisy pixels from each quadrant. If the there are fewer than three noisy pixels in the level2.evt file, extra rows are filled as -1
| Pixel properties | Quadrant properties | ||||||
|---|---|---|---|---|---|---|---|
| Quadrant | DetID | PixID | Counts | Sigma | Mean | Median | Sigma |
| A | 8 | 15 | 1039939 | 1215.36 | 4215 | 4133 | 852.3 |
| A | 0 | 226 | 39012 | 40.93 | 4215 | 4133 | 852.3 |
| A | 12 | 194 | 34780 | 35.96 | 4215 | 4133 | 852.3 |
| B | 0 | 214 | 460196 | 569.52 | 4223 | 4126 | 800.8 |
| B | 4 | 239 | 188289 | 229.97 | 4223 | 4126 | 800.8 |
| B | 4 | 81 | 107782 | 129.44 | 4223 | 4126 | 800.8 |
| C | 14 | 67 | 65359 | 65.52 | 4062 | 4081 | 935.2 |
| C | 13 | 61 | 30516 | 28.27 | 4062 | 4081 | 935.2 |
| C | 8 | 128 | 17175 | 14.0 | 4062 | 4081 | 935.2 |
| D | 1 | 52 | 8021306 | 8074.74 | 3846 | 3764 | 992.9 |
| D | 8 | 195 | 1763970 | 1772.76 | 3846 | 3764 | 992.9 |
| D | 2 | 16 | 330237 | 328.8 | 3846 | 3764 | 992.9 |
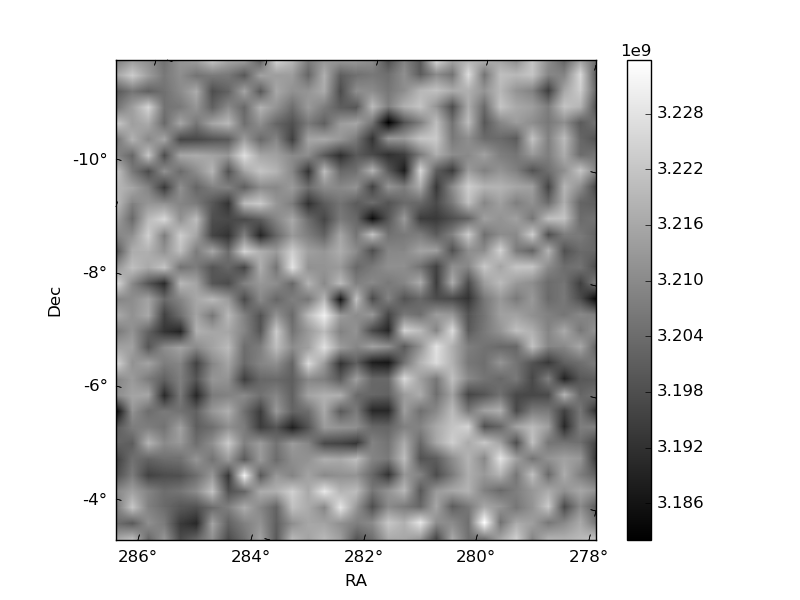
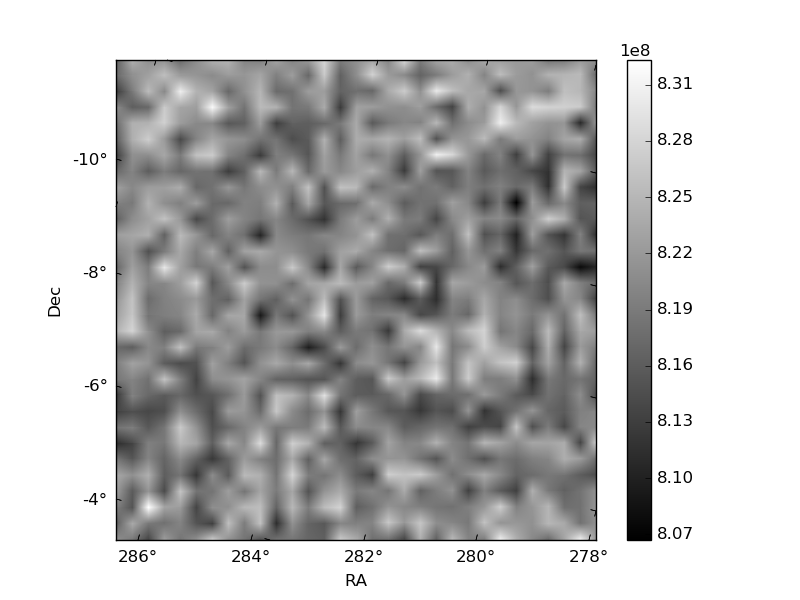
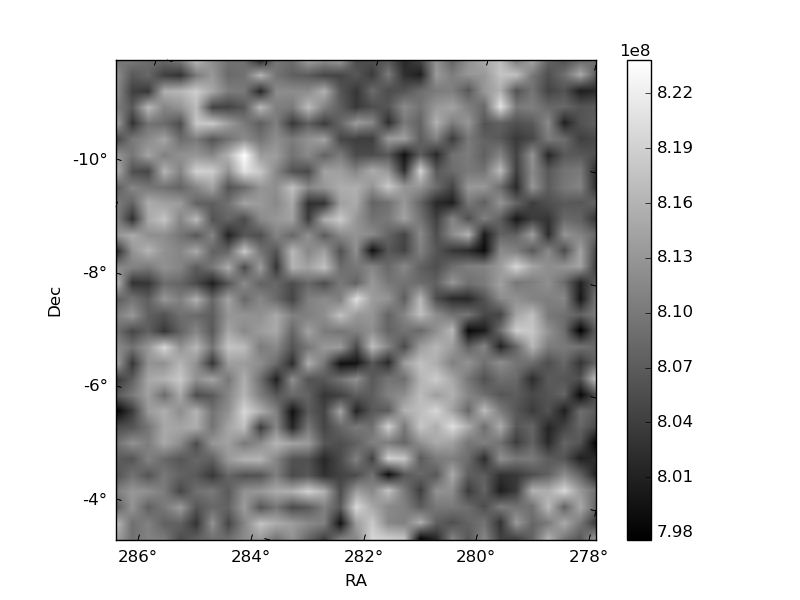
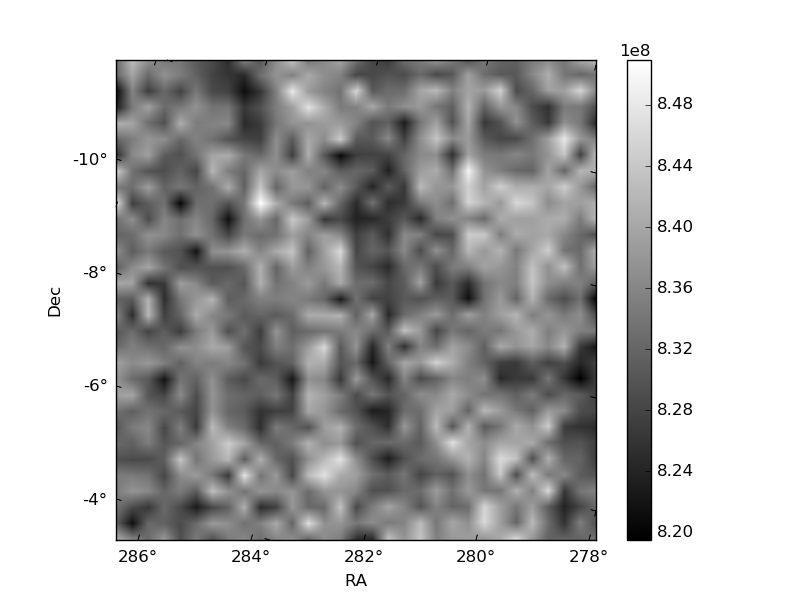
Histogram calculated using DETX and DETY for each event in the final _common_clean file
| Quadrant A | 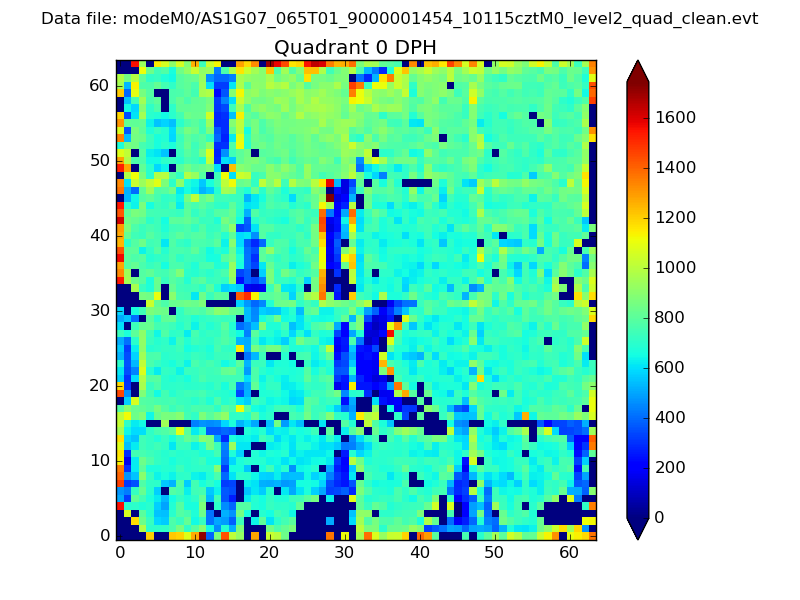 |
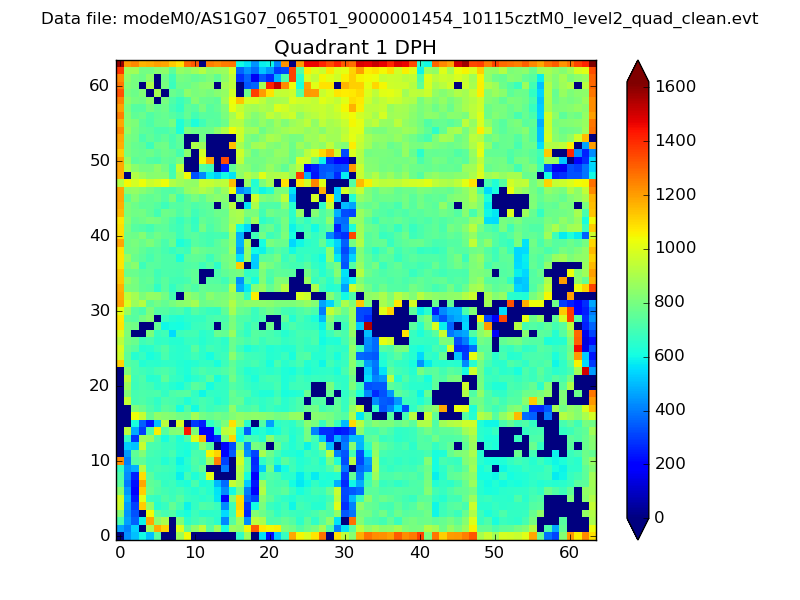 |
Quadrant B |
|---|---|---|---|
| Quadrant D | 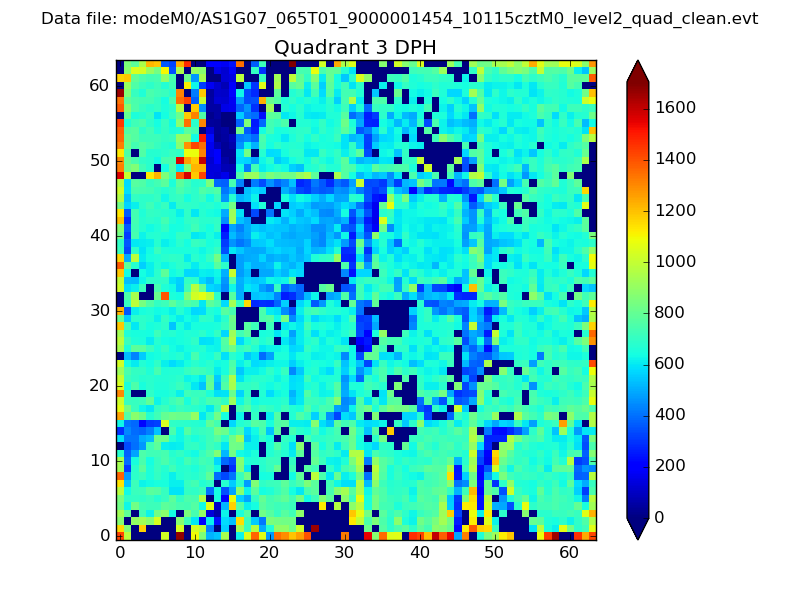 |
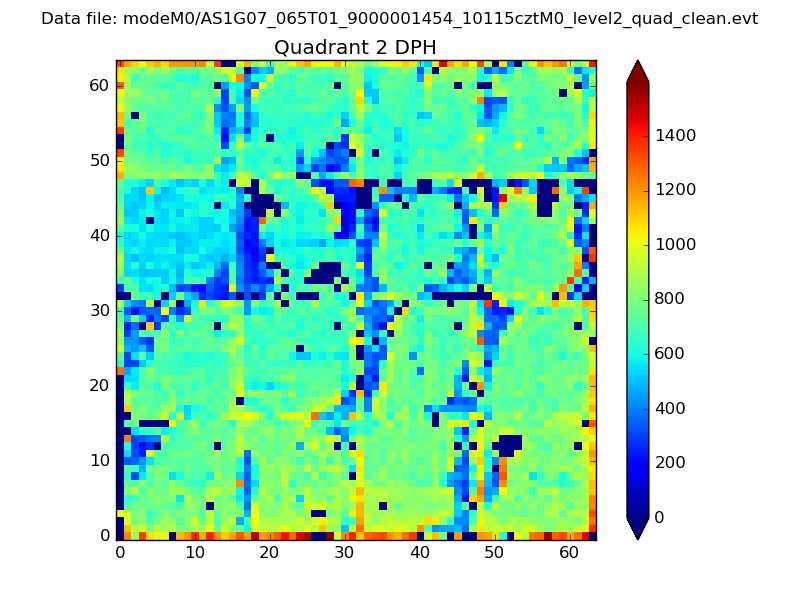 |
Quadrant C |
| Plot type | Count rate plots | Images |
|---|---|---|
| Comparison with Poisson distribution Blue bars denote a histogram of data divided into 1 sec bins. Red curve is a Poisson curve with rate = median count rate of data. |
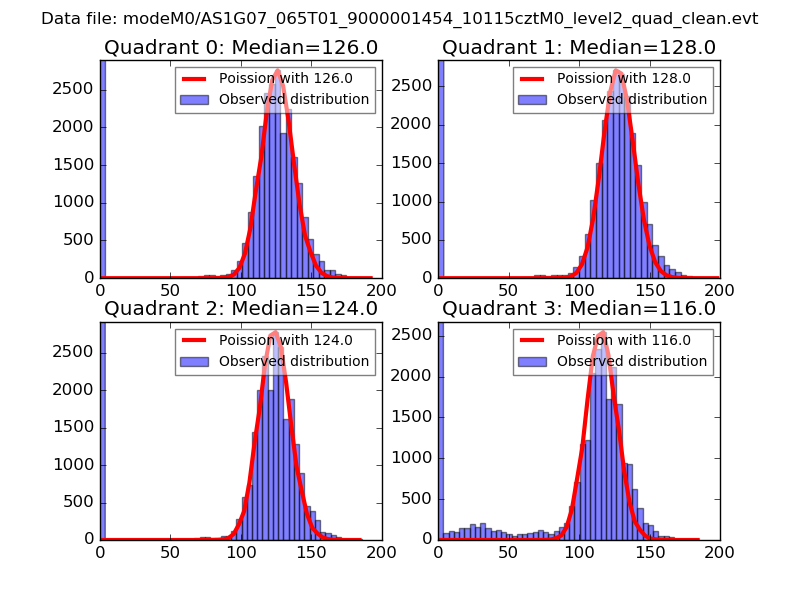 |
 |
| Quadrant-wise count rates Data is divided into 100 sec bins |
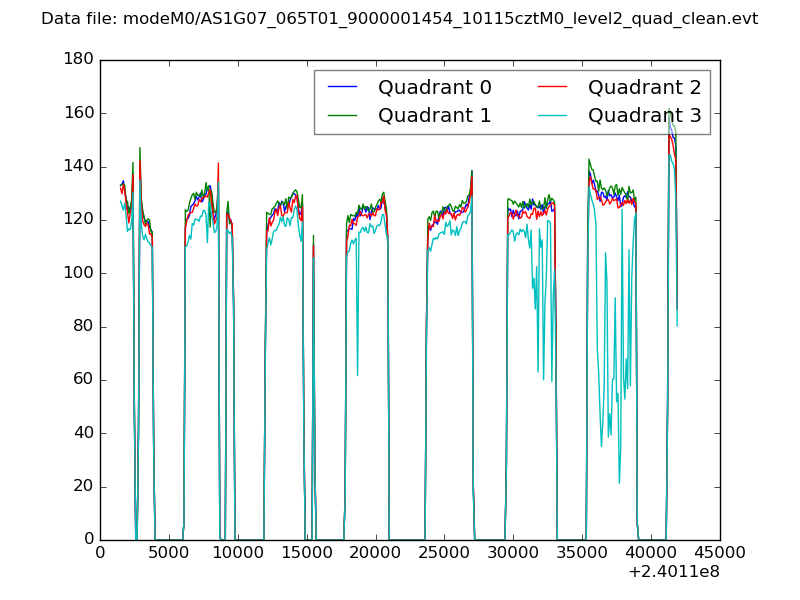 |
|
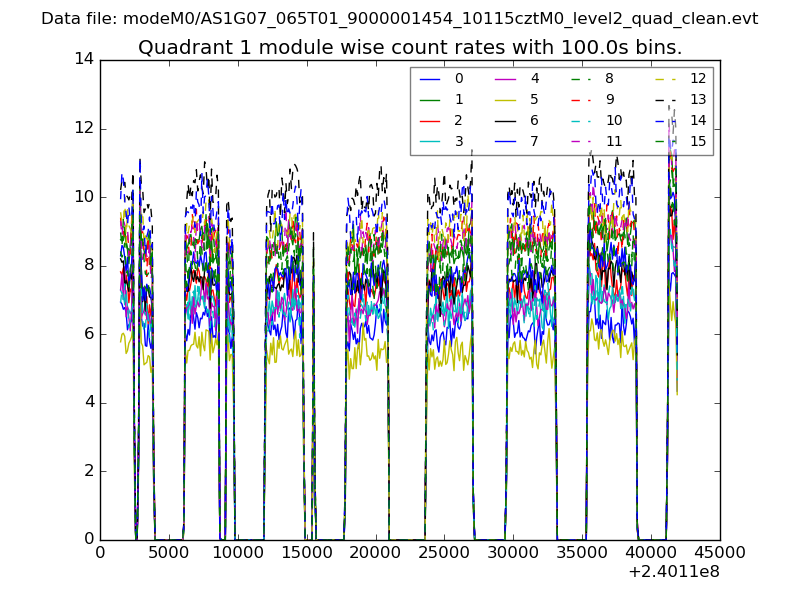
| Module-wise count rates for Quadrant A Data is divided into 100 sec bins |
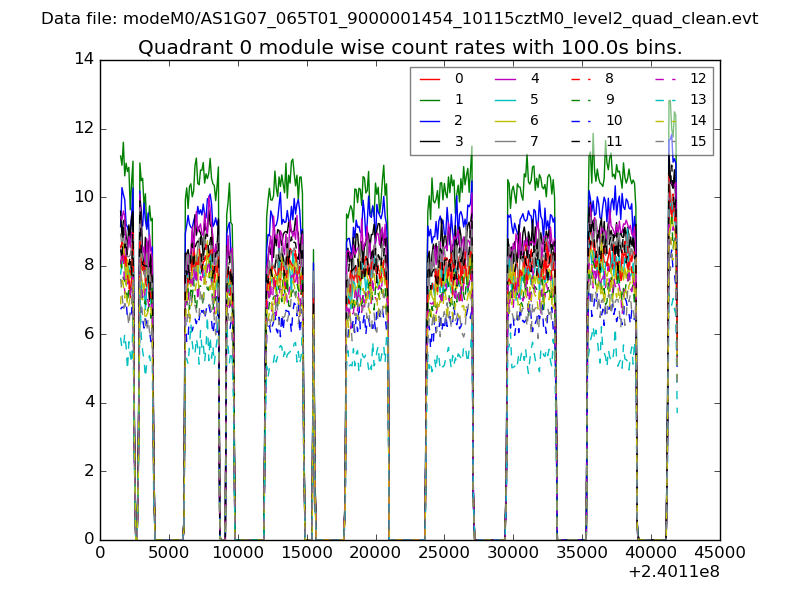 |
 |
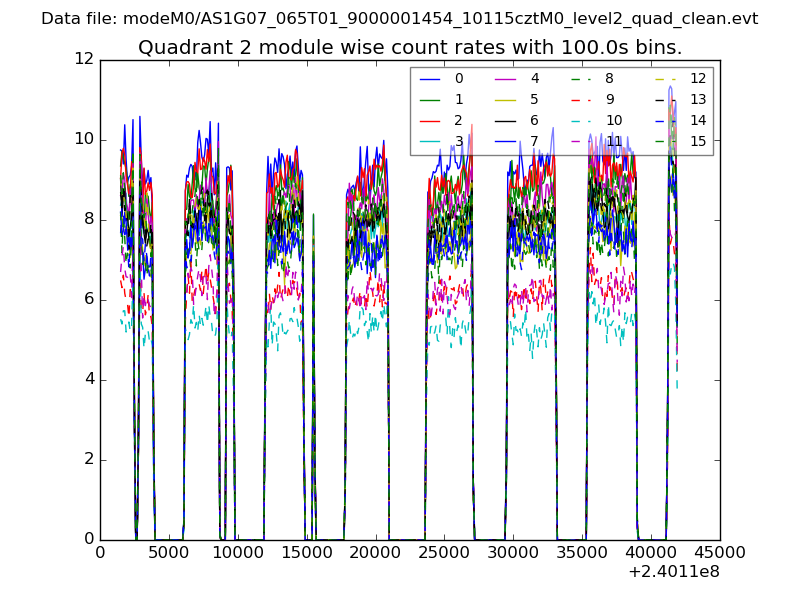
| Module-wise count rates for Quadrant B Data is divided into 100 sec bins |
 |
 |
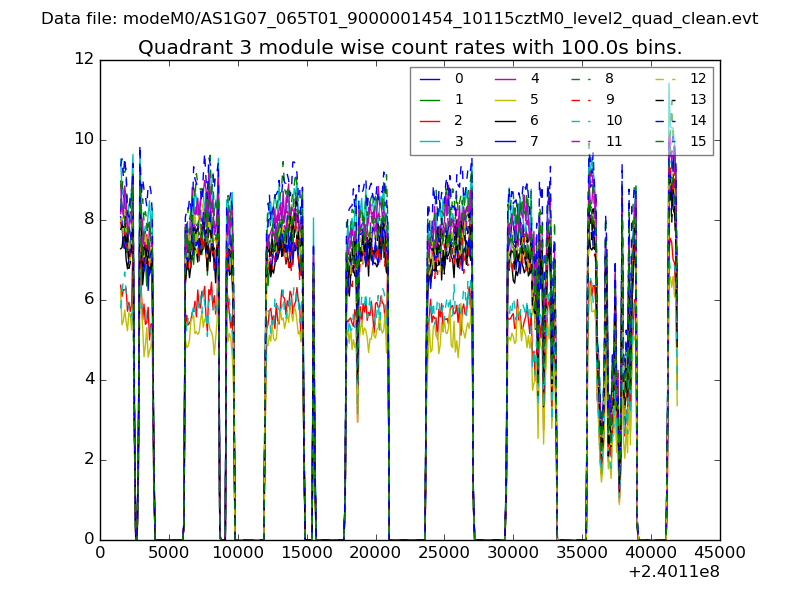
| Module-wise count rates for Quadrant C Data is divided into 100 sec bins |
 |
 |
| Module-wise count rates for Quadrant D Data is divided into 100 sec bins |
 |
 |
| Parameter | Plot |
|---|---|
| CZT HV Monitor | 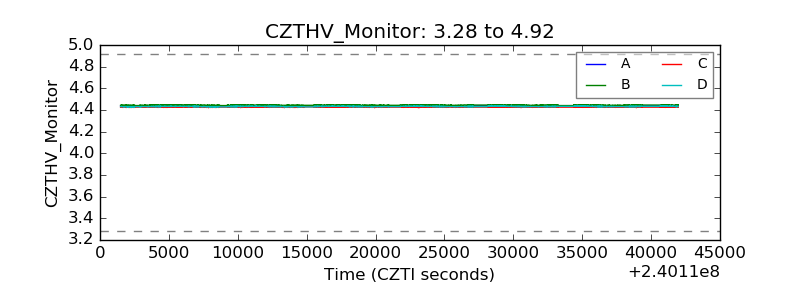 |
| D_VDD | 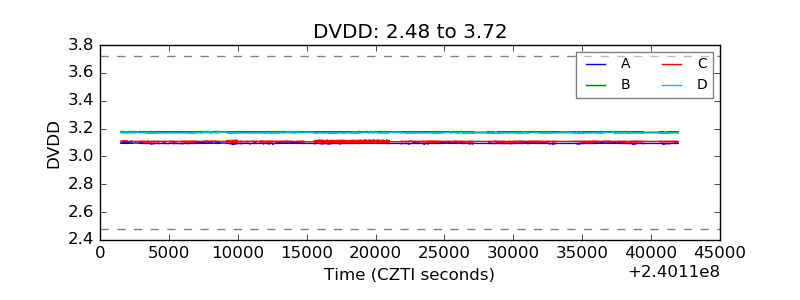 |
| Temperature 1 | 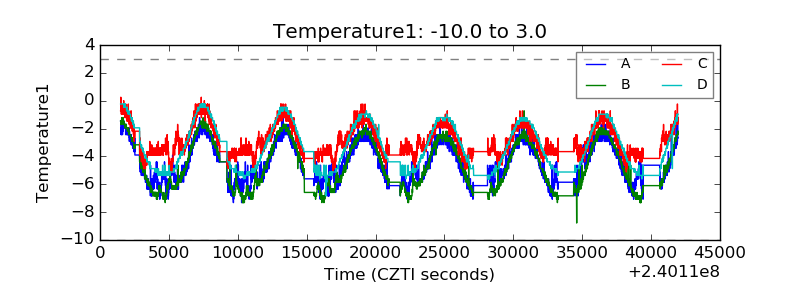 |
| Veto HV Monitor |  |
| Veto LLD | 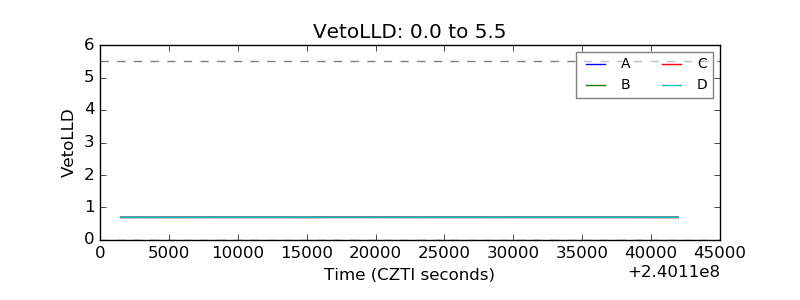 |
| Alpha Counter | 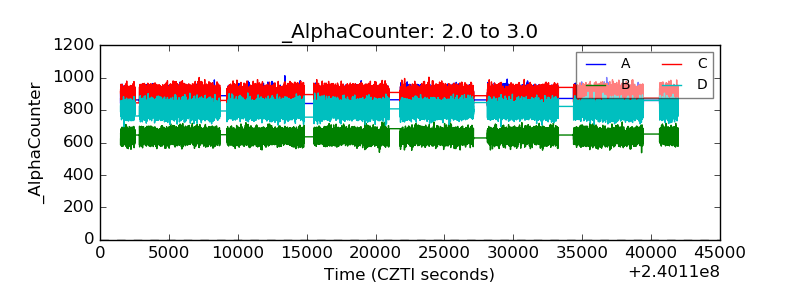 |
| _CPM_Rate | 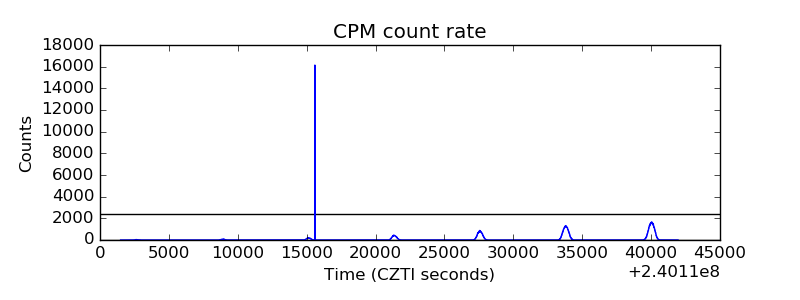 |
| CZT Counter | 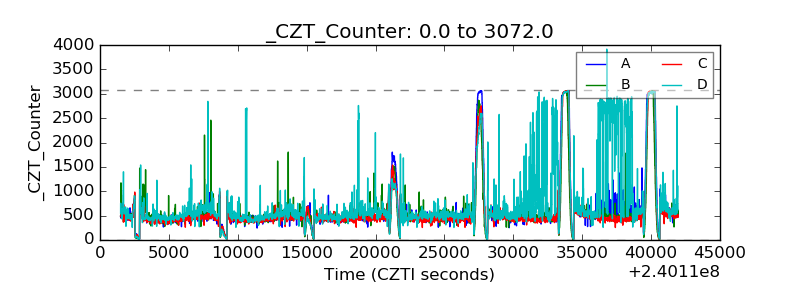 |
| +2.5 Volts monitor |  |
| +5 Volts monitor | 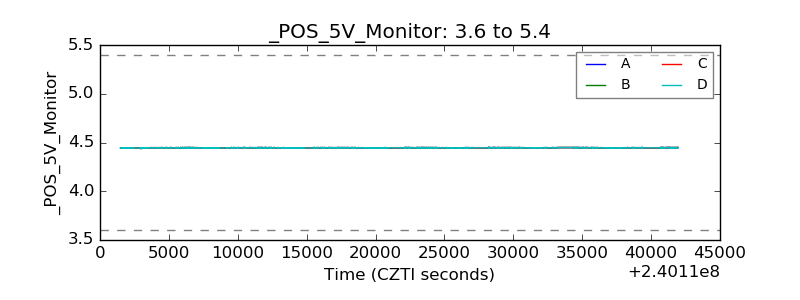 |
| _ROLL_ROT | 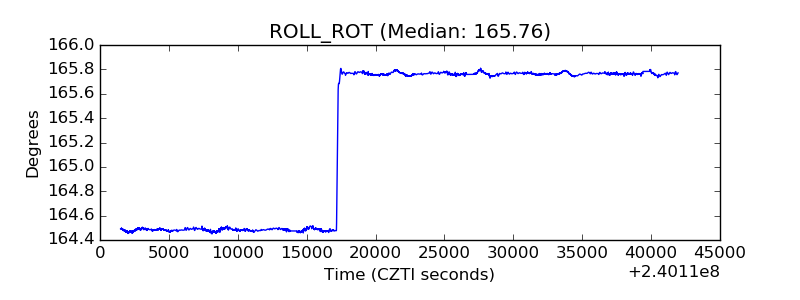 |
| _Roll_DEC | 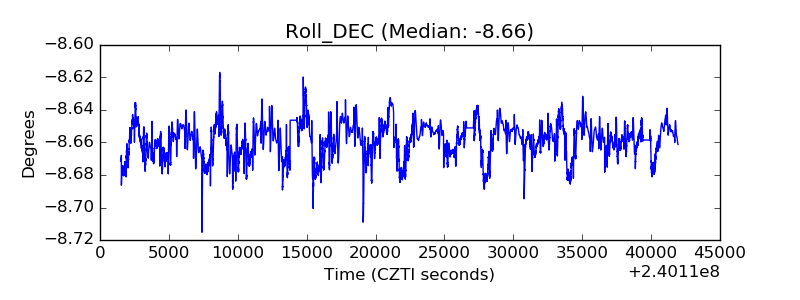 |
| _Roll_RA | 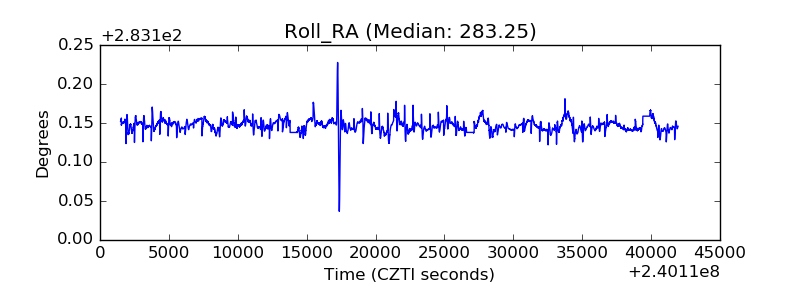 |
| Veto Counter | 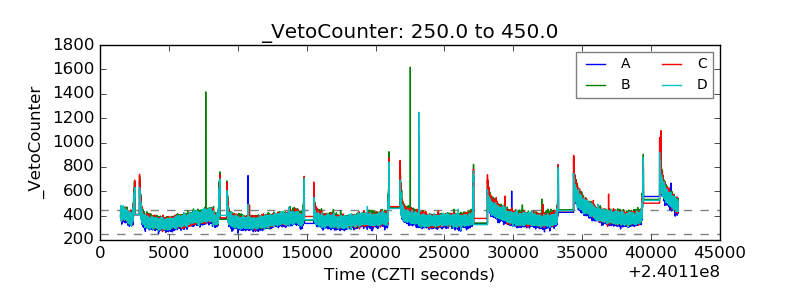 |