| Param | Original file | Final file |
|---|---|---|
| Filename | modeM0/AS1G07_065T01_9000001454_10117cztM0_level2.evt | modeM0/AS1G07_065T01_9000001454_10117cztM0_level2_quad_clean.evt |
| Size (bytes) | 466,536,960 | 110,891,520 |
| Size | 444.9 MB | 105.8 MB |
| Events in quadrant A | 3,511,432 | 745,102 |
| Events in quadrant B | 3,433,811 | 752,908 |
| Events in quadrant C | 3,104,578 | 720,384 |
| Events in quadrant D | 3,649,106 | 698,071 |
| Mode M0 | |||
|---|---|---|---|
| Quadrant | BADHDUFLAG | Total packets | Discarded packets |
| A | 0 | 14586 | 2 |
| B | 0 | 14230 | 1 |
| C | 0 | 13264 | 1 |
| D | 0 | 14612 | 1 |
| Mode M9 | |||
|---|---|---|---|
| Quadrant | BADHDUFLAG | Total packets | Discarded packets |
| A | 0 | 13 | 0 |
| B | 0 | 13 | 0 |
| C | 0 | 13 | 0 |
| D | 0 | 13 | 0 |
| Mode SS | |||
|---|---|---|---|
| Quadrant | BADHDUFLAG | Total packets | Discarded packets |
| A | 0 | 130 | 0 |
| B | 0 | 130 | 0 |
| C | 0 | 130 | 0 |
| D | 0 | 130 | 0 |
| Quadrant | Total seconds | Saturated seconds | Saturation percentage |
|---|---|---|---|
| A | 6331 | 81 | 1.279419% |
| B | 6331 | 84 | 1.326805% |
| C | 6331 | 51 | 0.805560% |
| D | 6331 | 81 | 1.279419% |
Noise dominated data is calculated using 1-second bins in cleaned event files. If a bin has >2000 counts, and if more than 50% of those come from <1% of pixels, then it is considered to be noise-dominated and hence unusable.
| Quadrant | # 1 sec bins | Bins with >0 counts | Bins with >2000 counts | High rate bins dominated by noise | Noise dominated (total time) | Noise dominated (detector-on time) | Marked lightcurve |
|---|---|---|---|---|---|---|---|
| A | 7621 | 6331 | 0 | 0 | 0.00% | 0.00% | 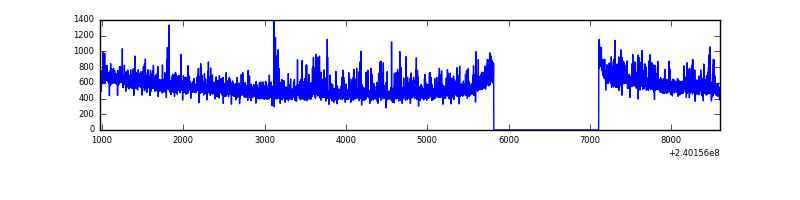 |
| B | 7621 | 6331 | 2 | 2 | 0.03% | 0.03% | 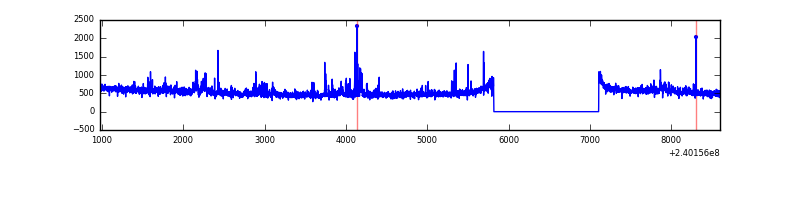 |
| C | 7621 | 6332 | 0 | 0 | 0.00% | 0.00% | 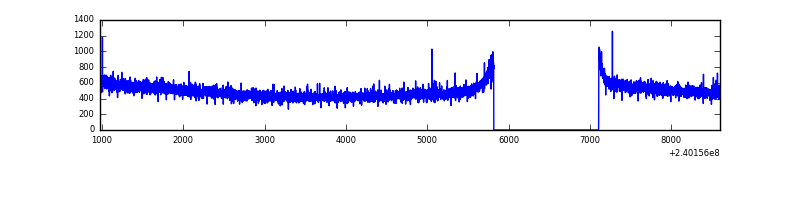 |
| D | 7621 | 6332 | 30 | 30 | 0.39% | 0.47% | 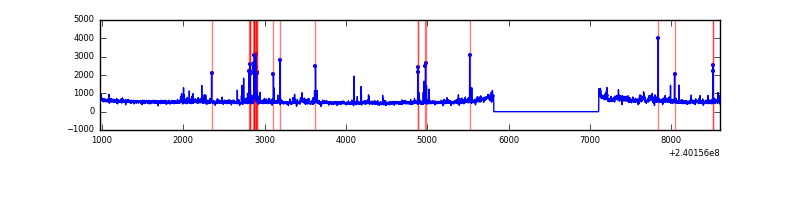 |
Top three noisy pixels from each quadrant. If the there are fewer than three noisy pixels in the level2.evt file, extra rows are filled as -1
| Pixel properties | Quadrant properties | ||||||
|---|---|---|---|---|---|---|---|
| Quadrant | DetID | PixID | Counts | Sigma | Mean | Median | Sigma |
| A | 8 | 15 | 277721 | 1625.5 | 839 | 824 | 170.3 |
| A | 0 | 226 | 8133 | 42.91 | 839 | 824 | 170.3 |
| A | 12 | 194 | 7305 | 38.05 | 839 | 824 | 170.3 |
| B | 0 | 214 | 69962 | 443.5 | 828 | 811 | 155.9 |
| B | 0 | 189 | 56973 | 360.19 | 828 | 811 | 155.9 |
| B | 4 | 239 | 41167 | 258.82 | 828 | 811 | 155.9 |
| C | 13 | 61 | 6018 | 28.5 | 795 | 800 | 183.1 |
| C | 8 | 222 | 2625 | 9.97 | 795 | 800 | 183.1 |
| C | 14 | 67 | 2006 | 6.59 | 795 | 800 | 183.1 |
| D | 8 | 195 | 259517 | 1257.98 | 797 | 781 | 205.7 |
| D | 2 | 16 | 111105 | 536.4 | 797 | 781 | 205.7 |
| D | 13 | 104 | 85240 | 410.64 | 797 | 781 | 205.7 |
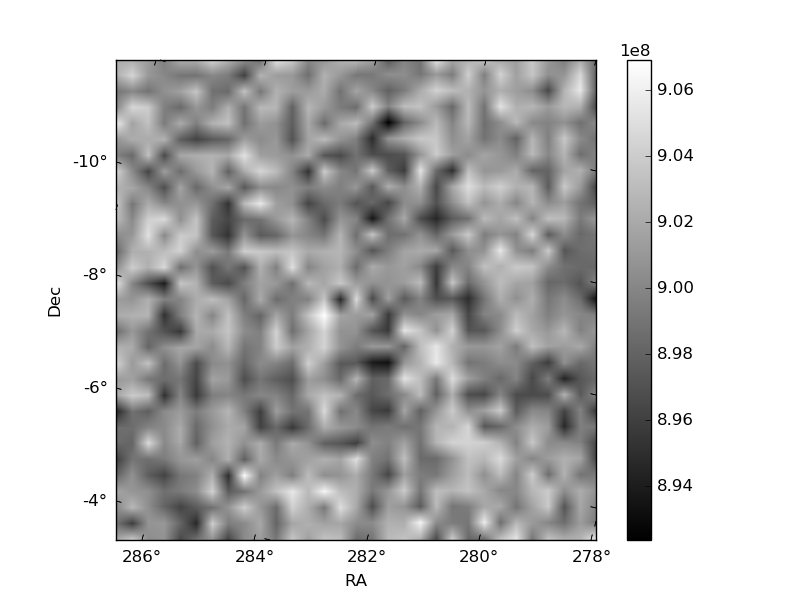
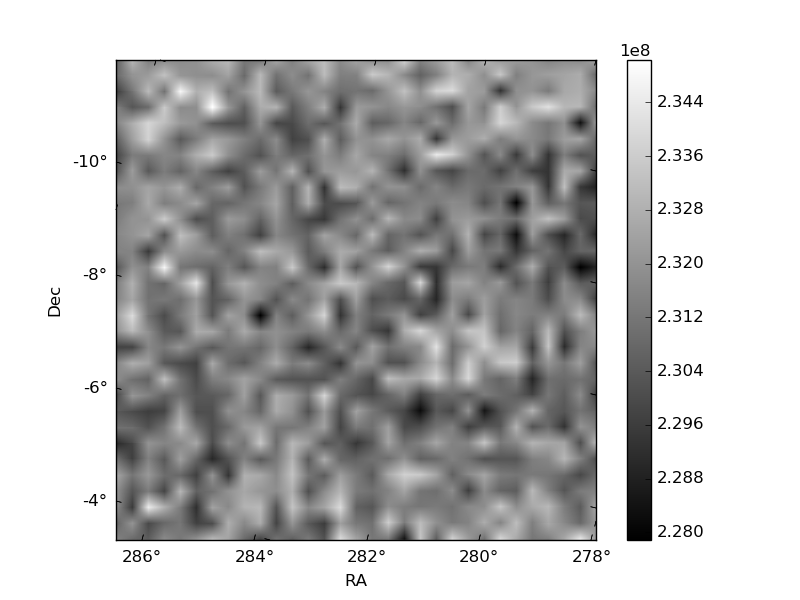
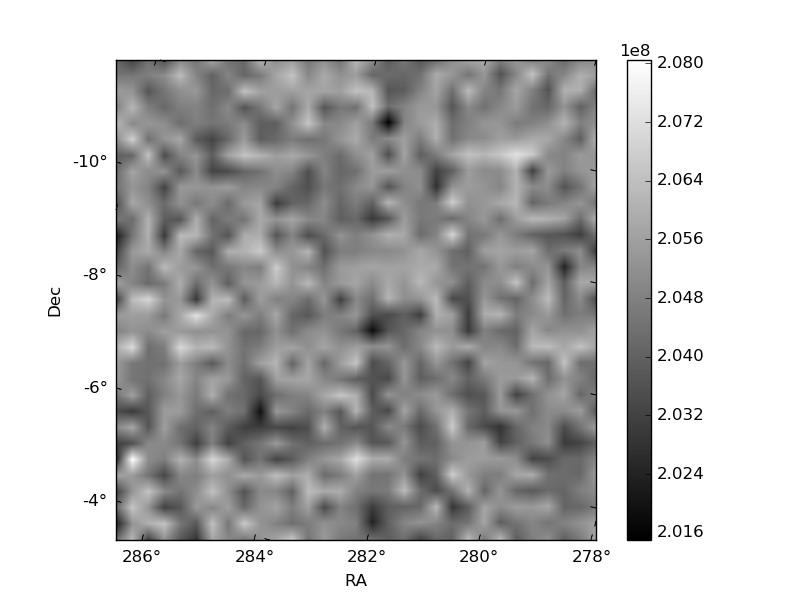
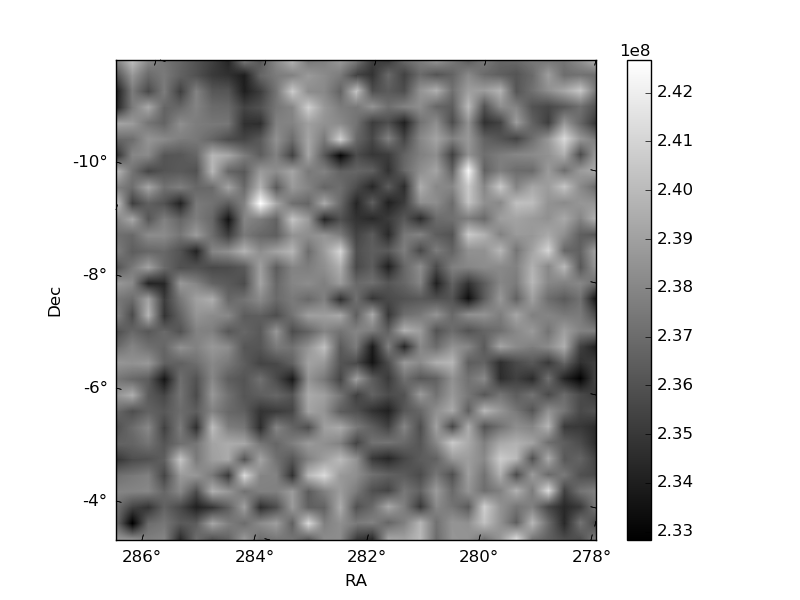
Histogram calculated using DETX and DETY for each event in the final _common_clean file
| Quadrant A | 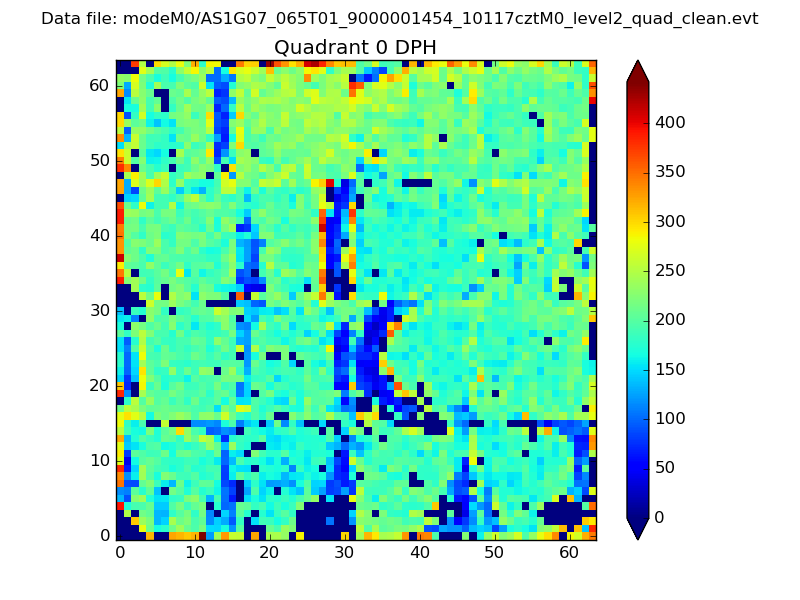 |
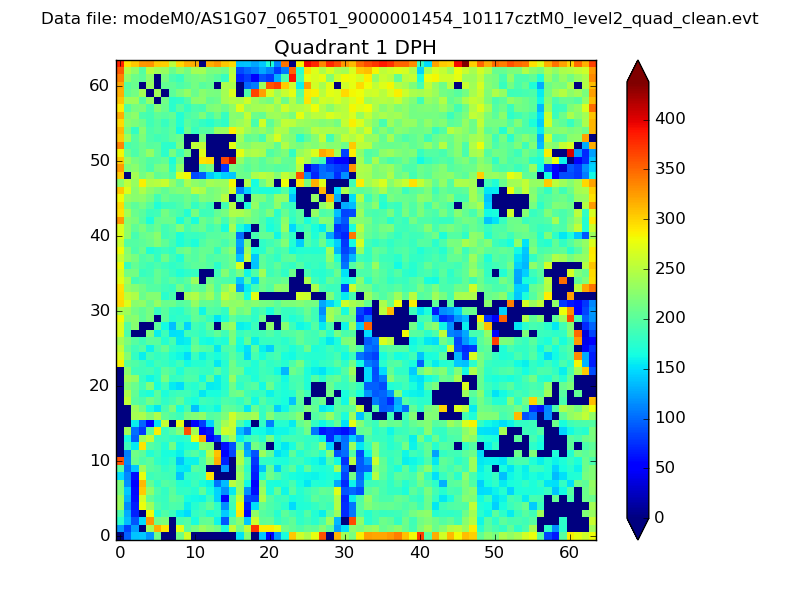 |
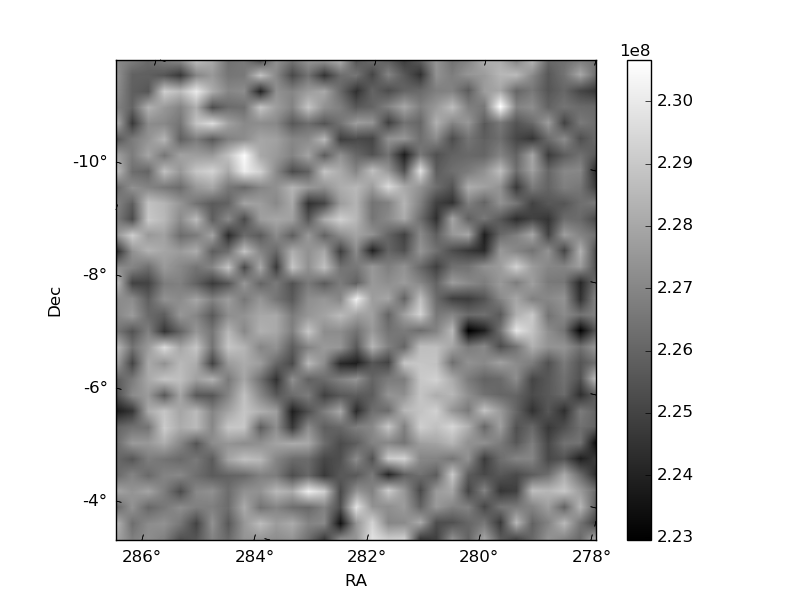
Quadrant B |
|---|---|---|---|
| Quadrant D | 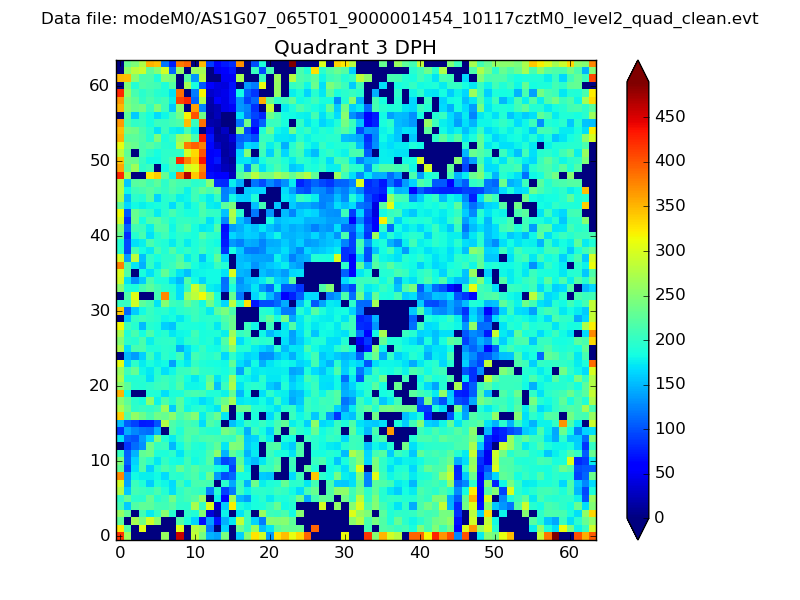 |
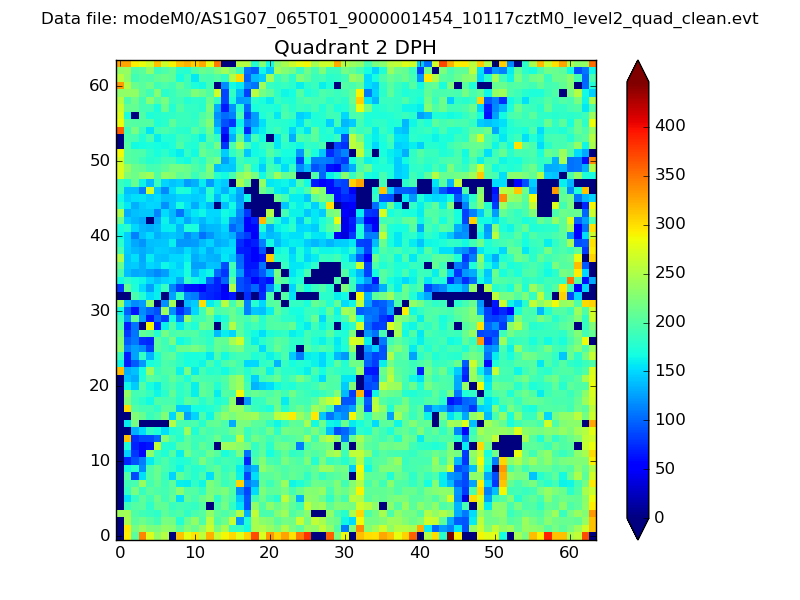 |
Quadrant C |
| Plot type | Count rate plots | Images |
|---|---|---|
| Comparison with Poisson distribution Blue bars denote a histogram of data divided into 1 sec bins. Red curve is a Poisson curve with rate = median count rate of data. |
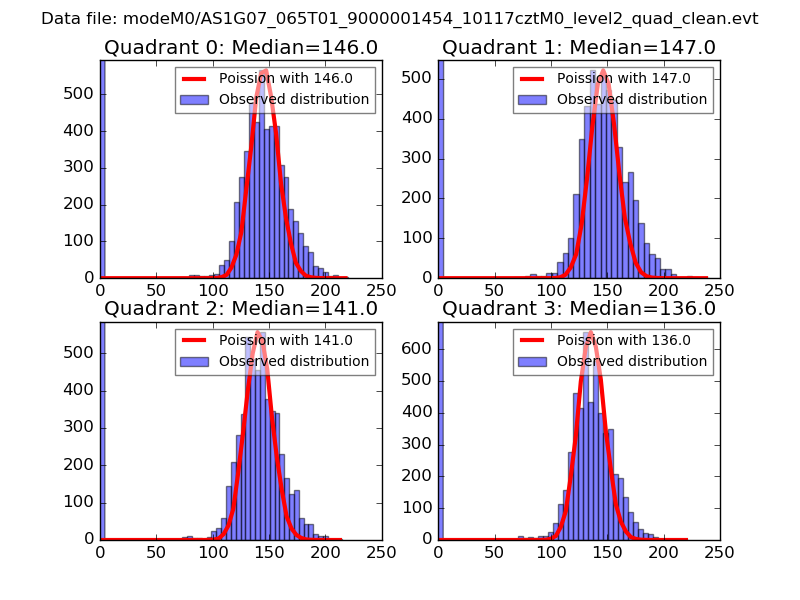 |
 |
| Quadrant-wise count rates Data is divided into 100 sec bins |
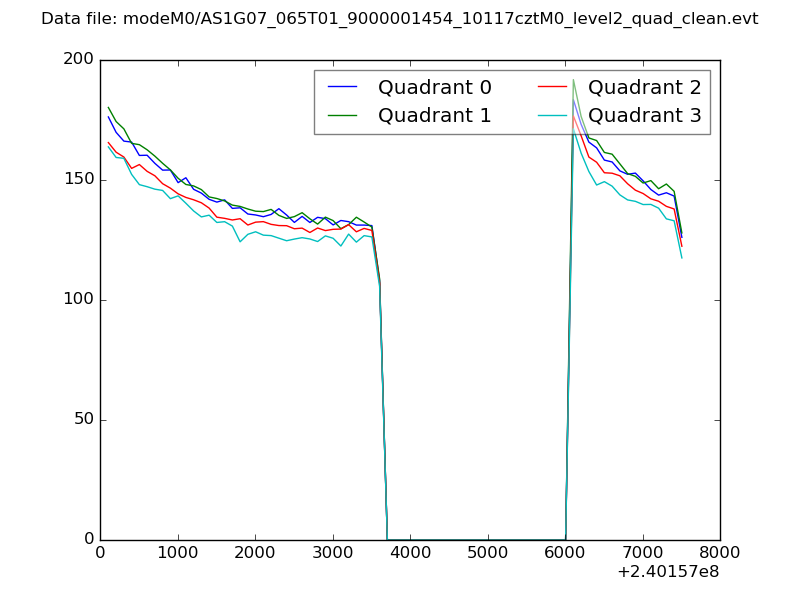 |
|
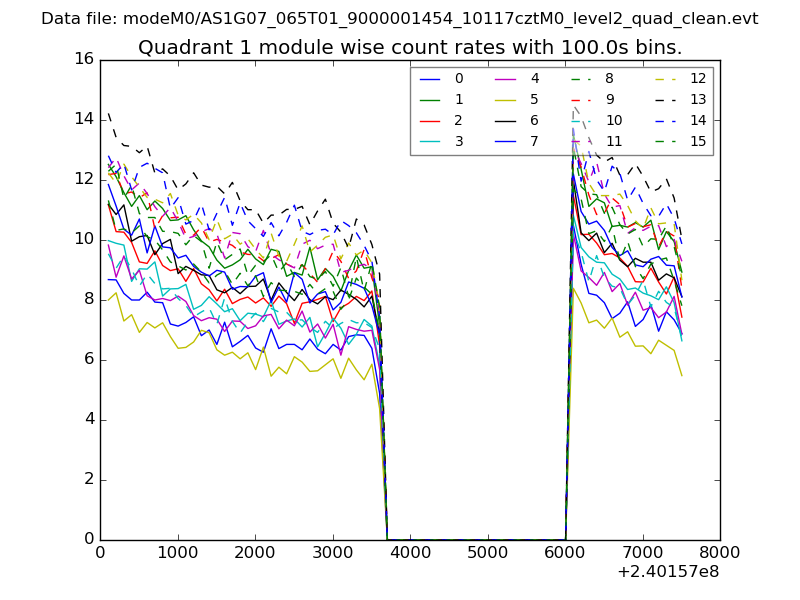
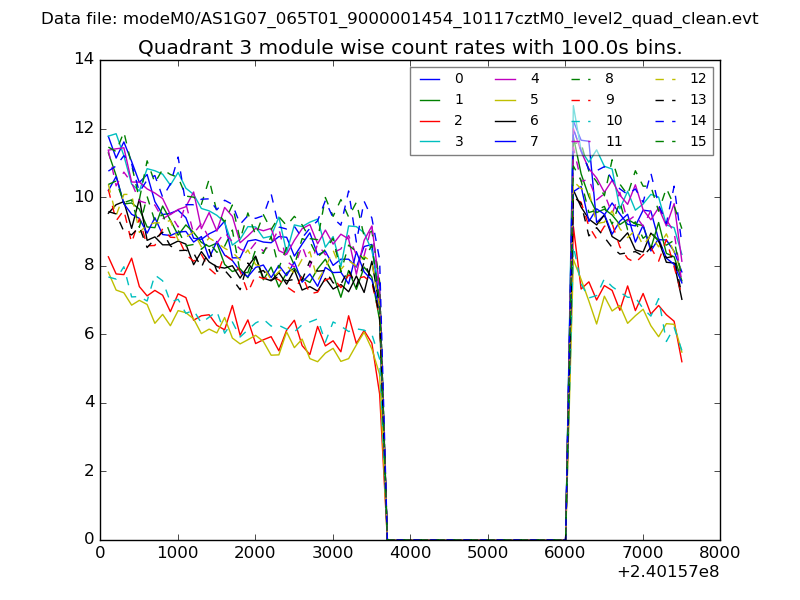
| Module-wise count rates for Quadrant A Data is divided into 100 sec bins |
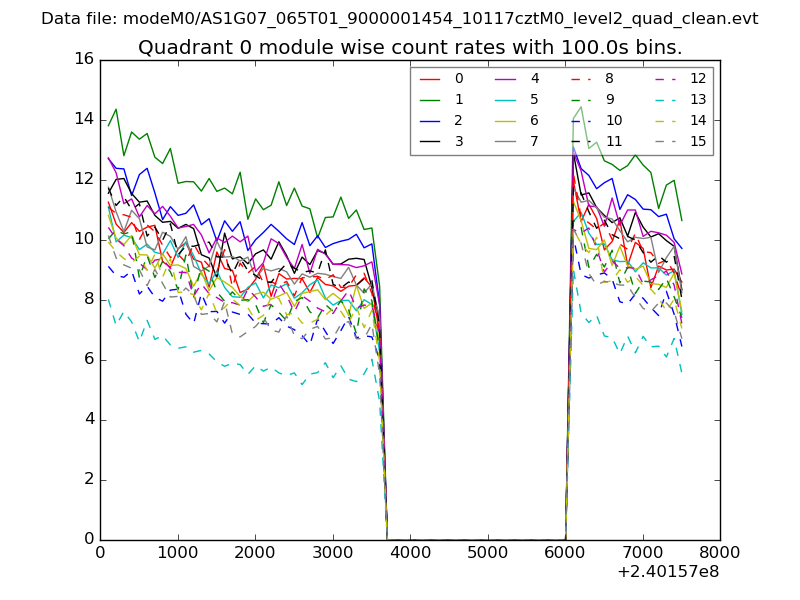 |
 |
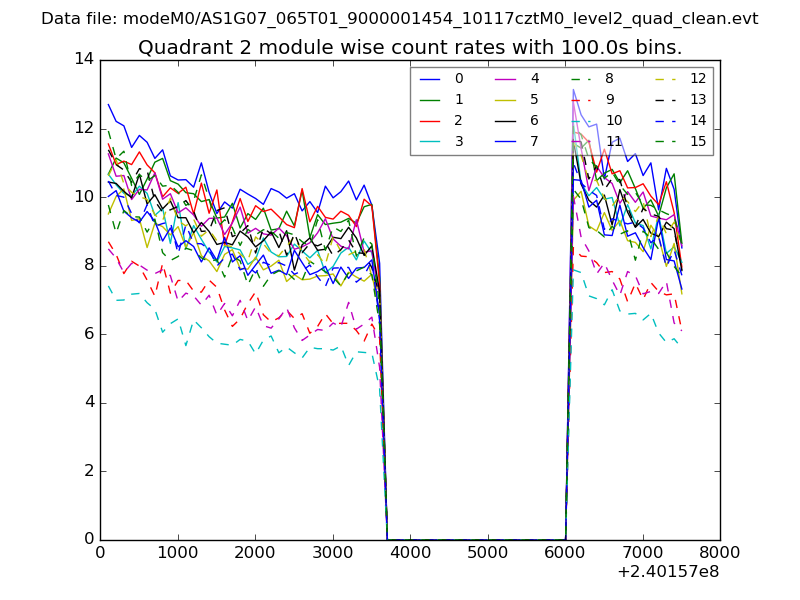
| Module-wise count rates for Quadrant B Data is divided into 100 sec bins |
 |
 |
| Module-wise count rates for Quadrant C Data is divided into 100 sec bins |
 |
 |
| Module-wise count rates for Quadrant D Data is divided into 100 sec bins |
 |
 |
| Parameter | Plot |
|---|---|
| CZT HV Monitor | 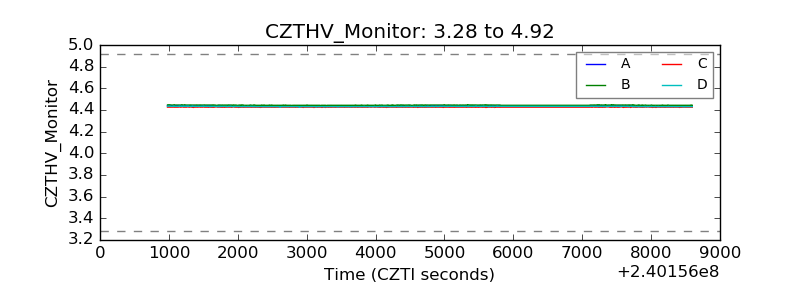 |
| D_VDD | 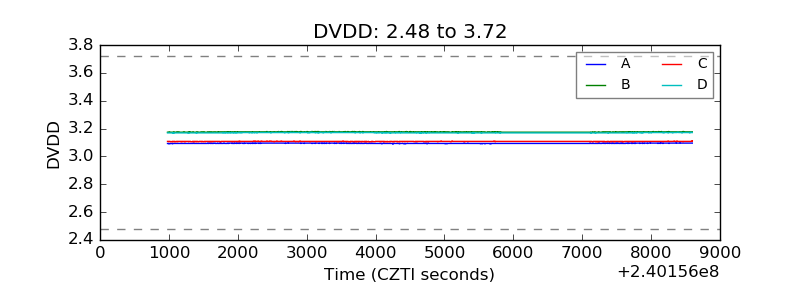 |
| Temperature 1 | 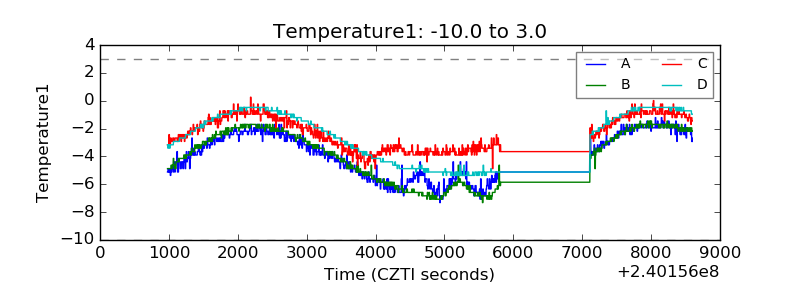 |
| Veto HV Monitor | 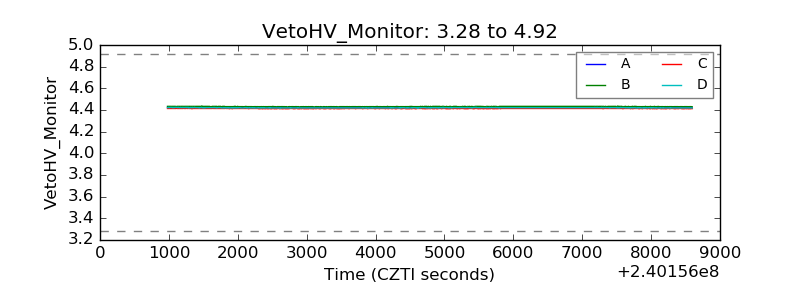 |
| Veto LLD | 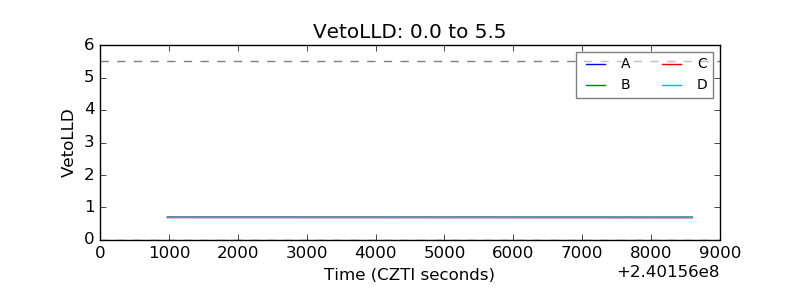 |
| Alpha Counter | 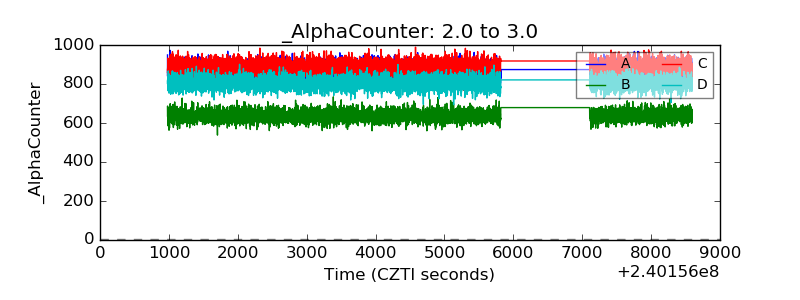 |
| _CPM_Rate | 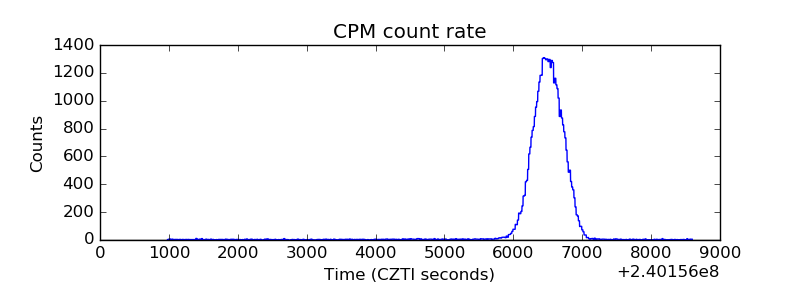 |
| CZT Counter | 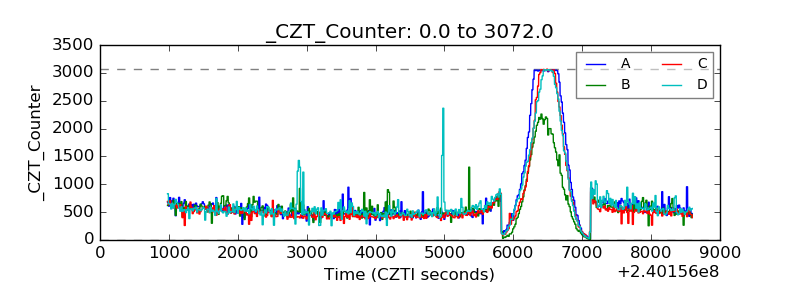 |
| +2.5 Volts monitor |  |
| +5 Volts monitor | 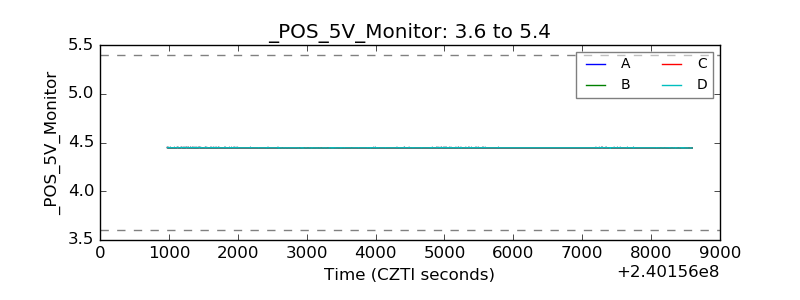 |
| _ROLL_ROT | 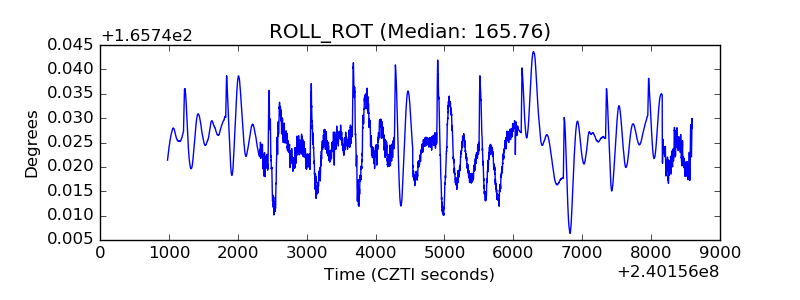 |
| _Roll_DEC | 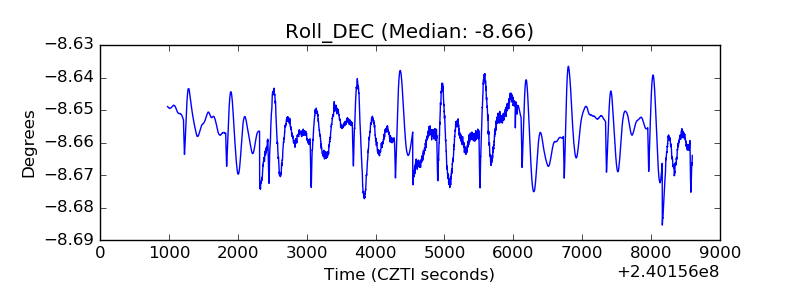 |
| _Roll_RA | 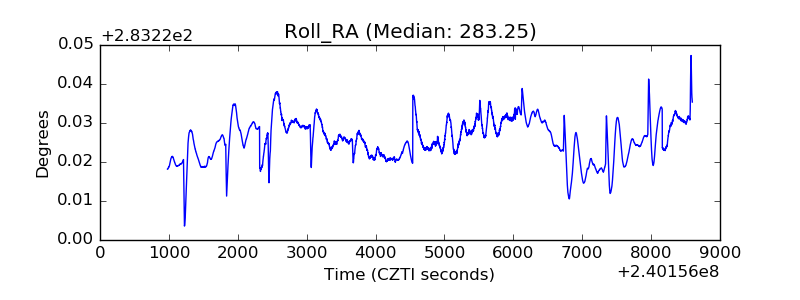 |
| Veto Counter | 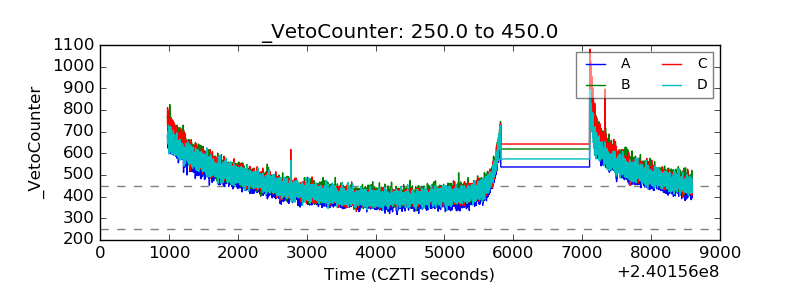 |