| Param | Original file | Final file |
|---|---|---|
| Filename | modeM0/AS1G07_065T01_9000001454_10118cztM0_level2.evt | modeM0/AS1G07_065T01_9000001454_10118cztM0_level2_quad_clean.evt |
| Size (bytes) | 464,394,240 | 104,181,120 |
| Size | 442.9 MB | 99.4 MB |
| Events in quadrant A | 3,406,365 | 690,989 |
| Events in quadrant B | 3,483,019 | 696,223 |
| Events in quadrant C | 3,130,258 | 671,022 |
| Events in quadrant D | 3,605,076 | 645,874 |
| Mode M0 | |||
|---|---|---|---|
| Quadrant | BADHDUFLAG | Total packets | Discarded packets |
| A | 0 | 14360 | 3 |
| B | 0 | 14594 | 2 |
| C | 0 | 13577 | 2 |
| D | 0 | 14766 | 2 |
| Mode M9 | |||
|---|---|---|---|
| Quadrant | BADHDUFLAG | Total packets | Discarded packets |
| A | 0 | 13 | 0 |
| B | 0 | 13 | 0 |
| C | 0 | 13 | 0 |
| D | 0 | 14 | 0 |
| Mode SS | |||
|---|---|---|---|
| Quadrant | BADHDUFLAG | Total packets | Discarded packets |
| A | 0 | 130 | 0 |
| B | 0 | 130 | 0 |
| C | 0 | 130 | 0 |
| D | 0 | 130 | 0 |
| Quadrant | Total seconds | Saturated seconds | Saturation percentage |
|---|---|---|---|
| A | 6472 | 136 | 2.101360% |
| B | 6472 | 137 | 2.116811% |
| C | 6472 | 90 | 1.390606% |
| D | 6472 | 106 | 1.637824% |
Noise dominated data is calculated using 1-second bins in cleaned event files. If a bin has >2000 counts, and if more than 50% of those come from <1% of pixels, then it is considered to be noise-dominated and hence unusable.
| Quadrant | # 1 sec bins | Bins with >0 counts | Bins with >2000 counts | High rate bins dominated by noise | Noise dominated (total time) | Noise dominated (detector-on time) | Marked lightcurve |
|---|---|---|---|---|---|---|---|
| A | 7682 | 6472 | 0 | 0 | 0.00% | 0.00% | 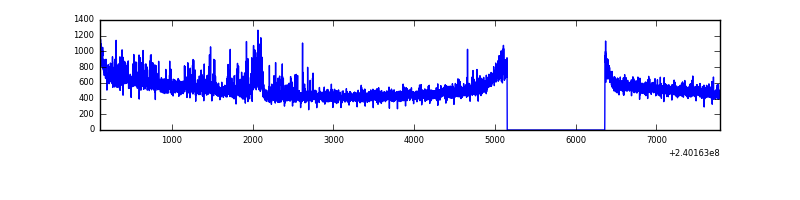 |
| B | 7682 | 6472 | 9 | 9 | 0.12% | 0.14% | 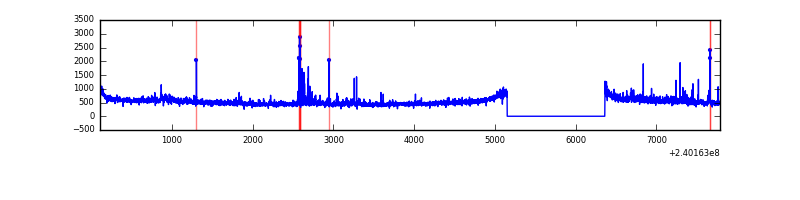 |
| C | 7682 | 6472 | 0 | 0 | 0.00% | 0.00% | 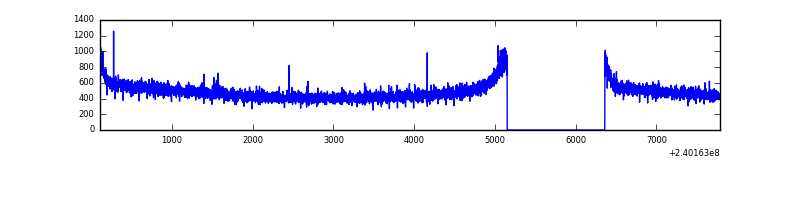 |
| D | 7682 | 6472 | 16 | 16 | 0.21% | 0.25% | 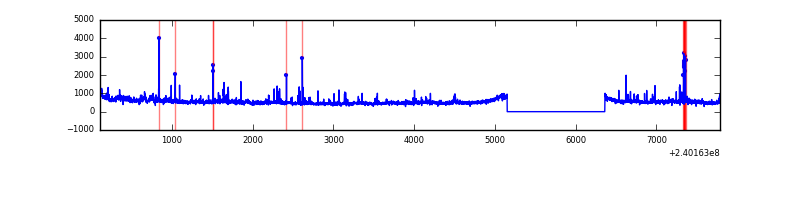 |
Top three noisy pixels from each quadrant. If the there are fewer than three noisy pixels in the level2.evt file, extra rows are filled as -1
| Pixel properties | Quadrant properties | ||||||
|---|---|---|---|---|---|---|---|
| Quadrant | DetID | PixID | Counts | Sigma | Mean | Median | Sigma |
| A | 8 | 15 | 168102 | 976.47 | 839 | 823 | 171.3 |
| A | 0 | 226 | 8007 | 41.93 | 839 | 823 | 171.3 |
| A | 15 | 174 | 7614 | 39.64 | 839 | 823 | 171.3 |
| B | 0 | 214 | 127873 | 801.93 | 833 | 814 | 158.4 |
| B | 4 | 239 | 44552 | 276.05 | 833 | 814 | 158.4 |
| B | 0 | 219 | 27945 | 171.24 | 833 | 814 | 158.4 |
| C | 13 | 61 | 5979 | 28.04 | 801 | 806 | 184.4 |
| C | 14 | 67 | 4479 | 19.91 | 801 | 806 | 184.4 |
| C | 8 | 222 | 2481 | 9.08 | 801 | 806 | 184.4 |
| D | 8 | 195 | 226369 | 1065.36 | 800 | 785 | 211.7 |
| D | 2 | 16 | 105115 | 492.72 | 800 | 785 | 211.7 |
| D | 2 | 14 | 57620 | 268.41 | 800 | 785 | 211.7 |
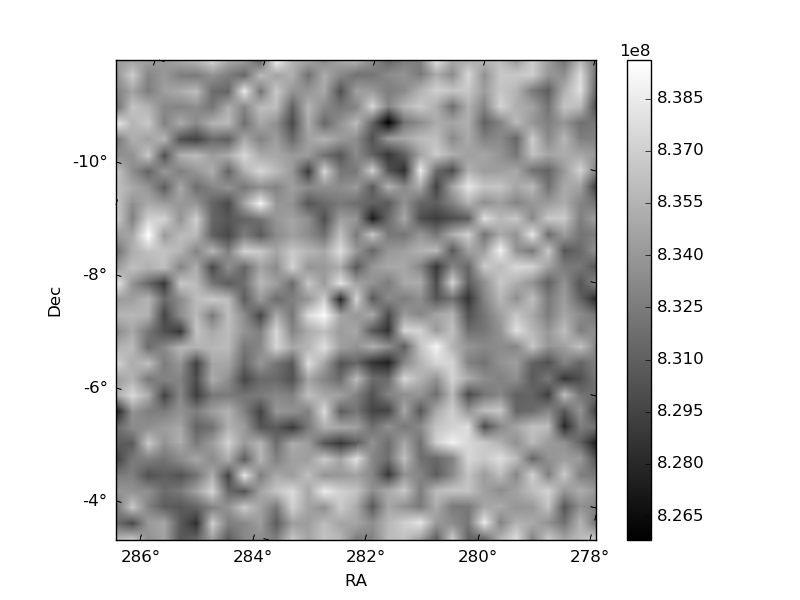
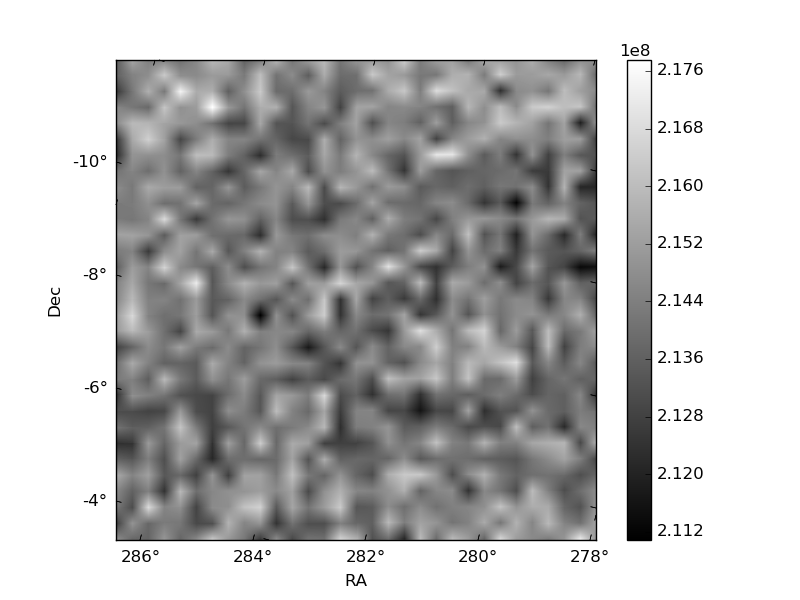
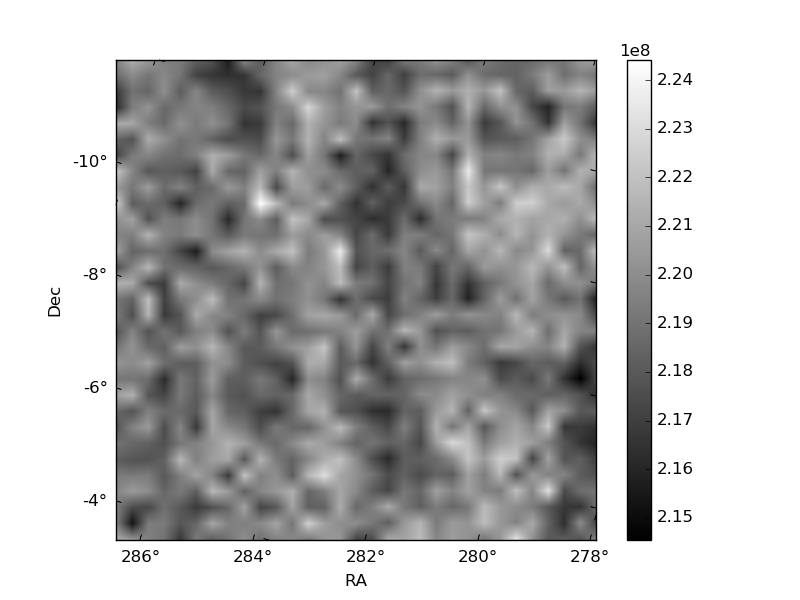
Histogram calculated using DETX and DETY for each event in the final _common_clean file
| Quadrant A | 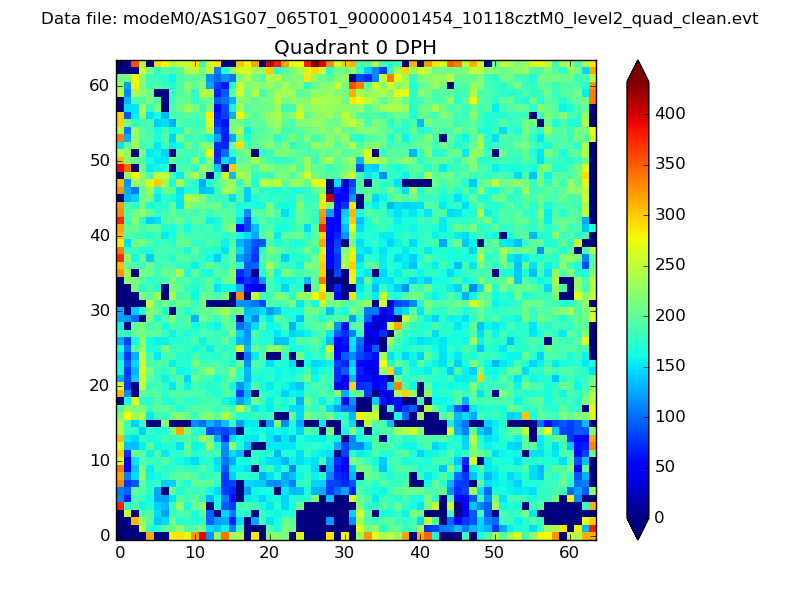 |
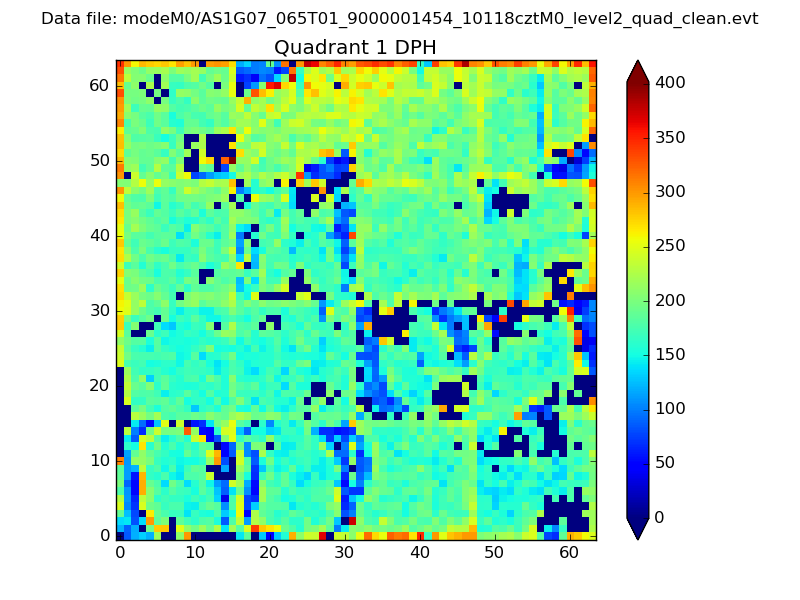 |
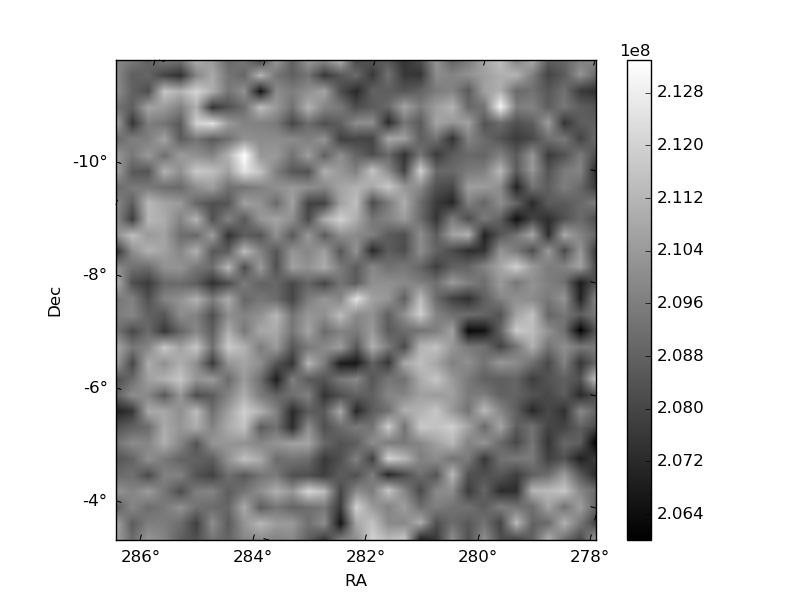
Quadrant B |
|---|---|---|---|
| Quadrant D | 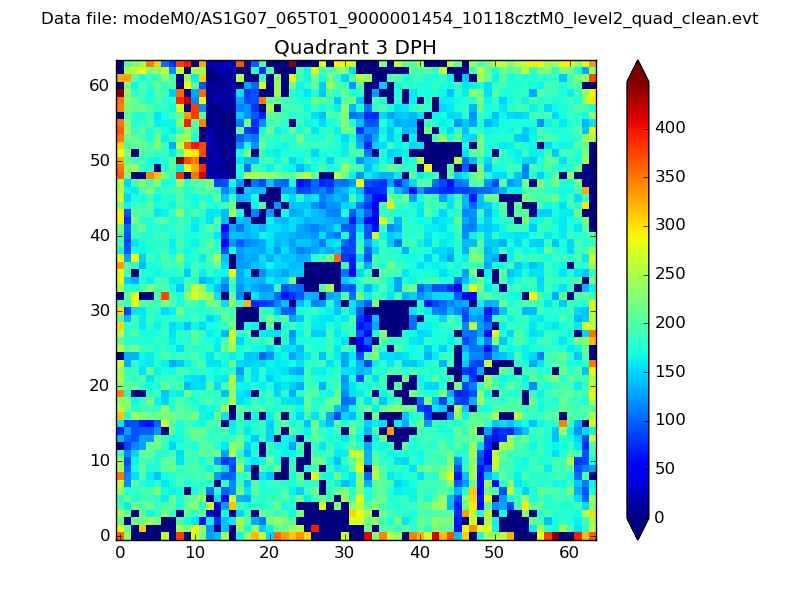 |
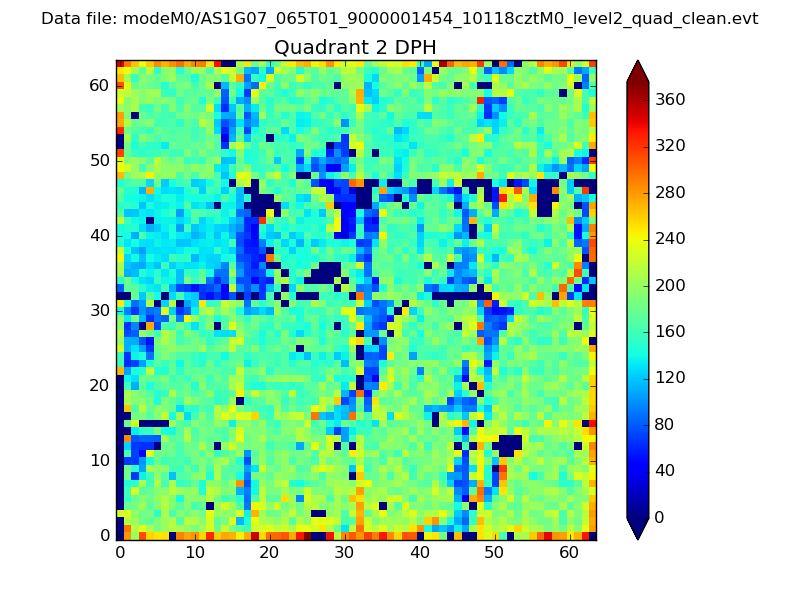 |
Quadrant C |
| Plot type | Count rate plots | Images |
|---|---|---|
| Comparison with Poisson distribution Blue bars denote a histogram of data divided into 1 sec bins. Red curve is a Poisson curve with rate = median count rate of data. |
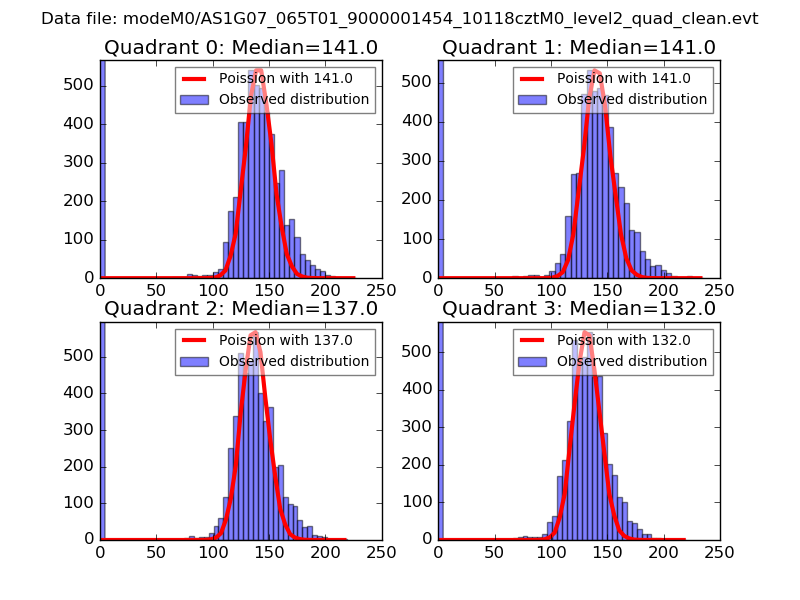 |
 |
| Quadrant-wise count rates Data is divided into 100 sec bins |
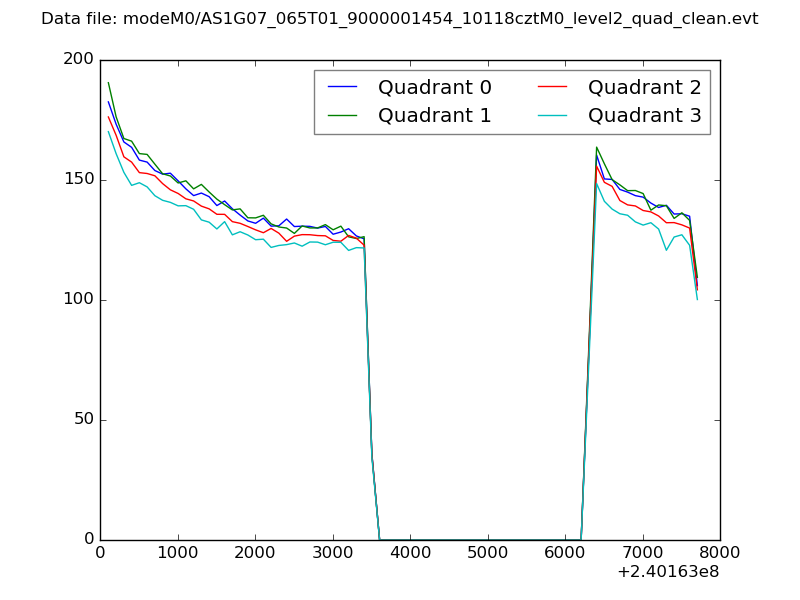 |
|
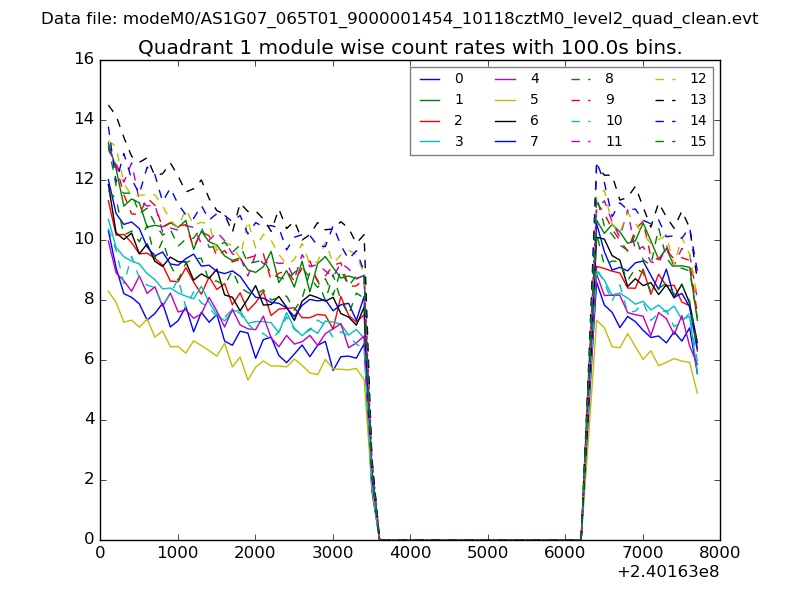
| Module-wise count rates for Quadrant A Data is divided into 100 sec bins |
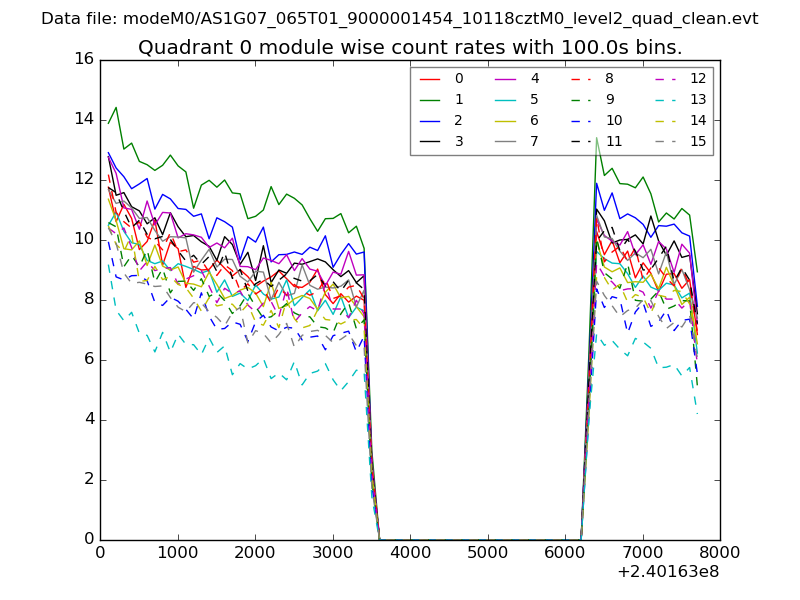 |
 |
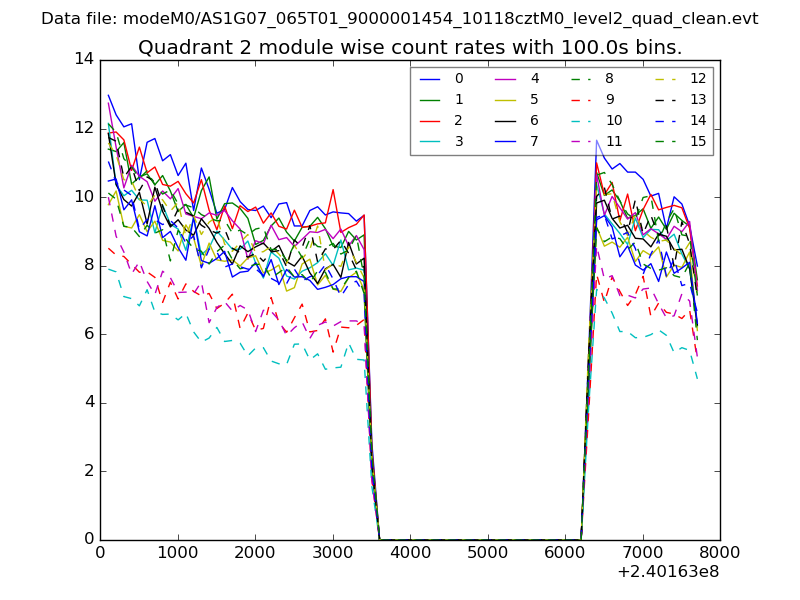
| Module-wise count rates for Quadrant B Data is divided into 100 sec bins |
 |
 |
| Module-wise count rates for Quadrant C Data is divided into 100 sec bins |
 |
 |
| Module-wise count rates for Quadrant D Data is divided into 100 sec bins |
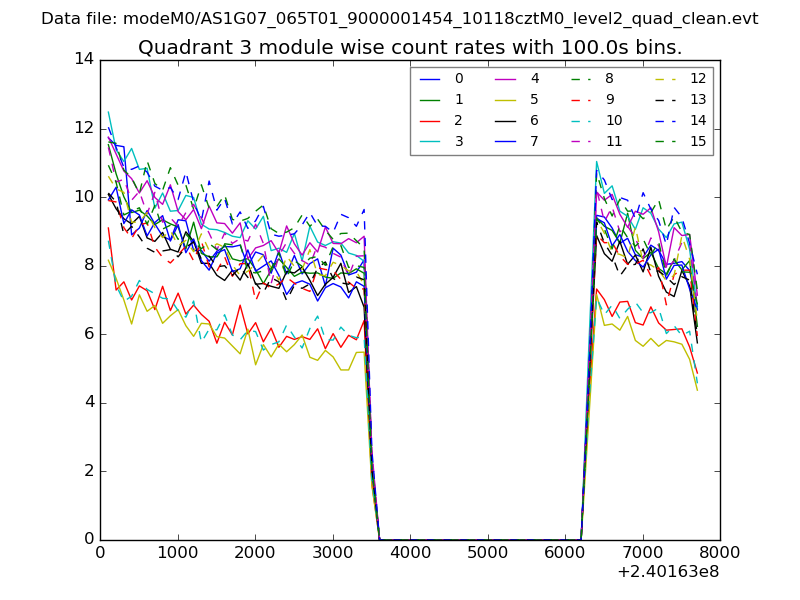 |
 |
| Parameter | Plot |
|---|---|
| CZT HV Monitor | 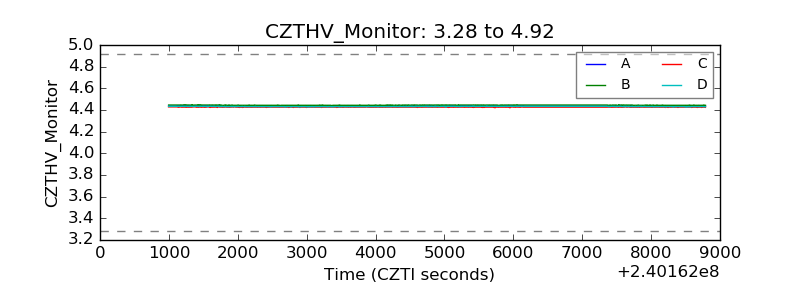 |
| D_VDD | 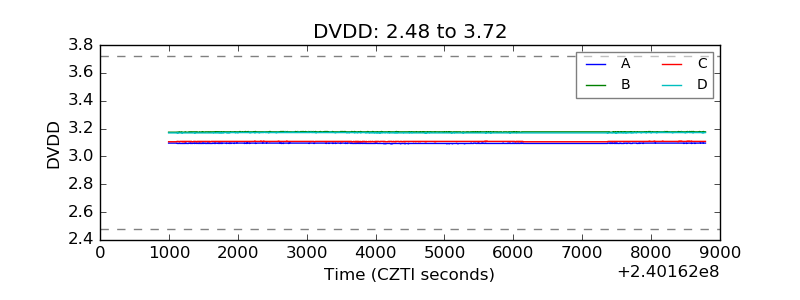 |
| Temperature 1 | 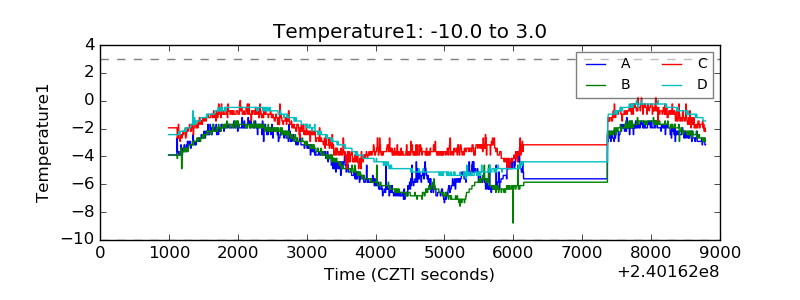 |
| Veto HV Monitor |  |
| Veto LLD | 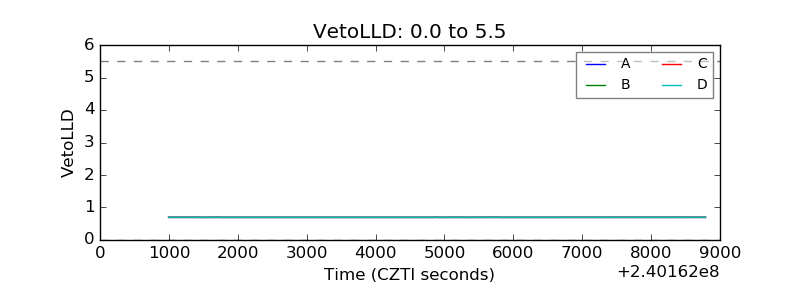 |
| Alpha Counter | 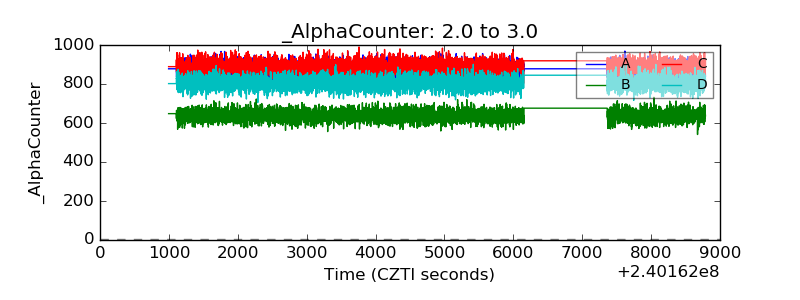 |
| _CPM_Rate | 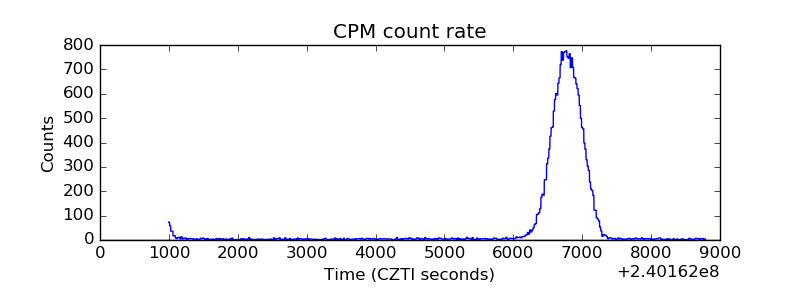 |
| CZT Counter | 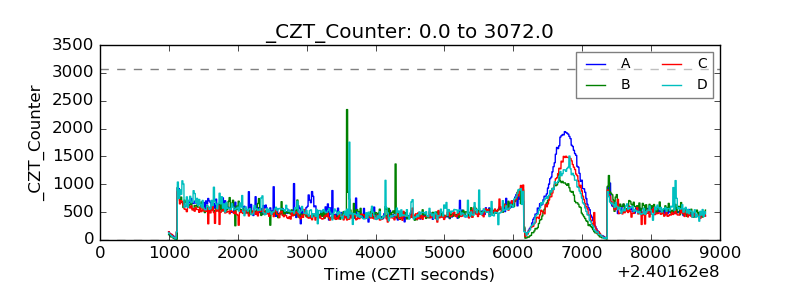 |
| +2.5 Volts monitor |  |
| +5 Volts monitor |  |
| _ROLL_ROT | 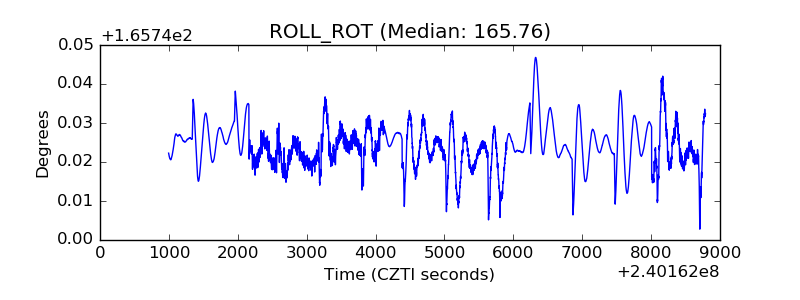 |
| _Roll_DEC | 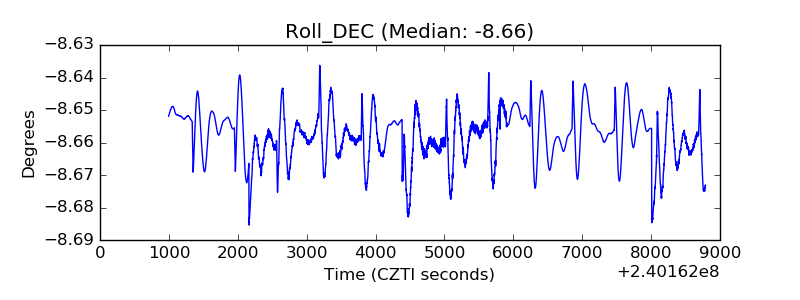 |
| _Roll_RA | 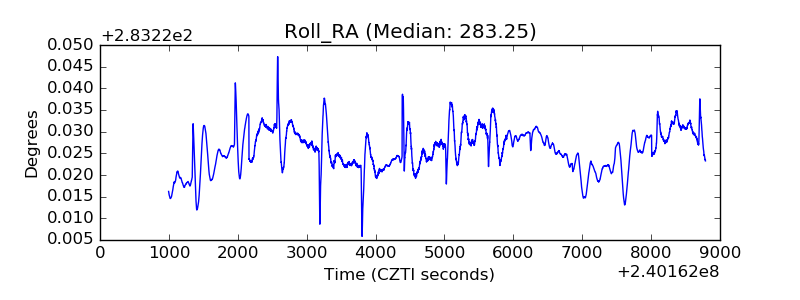 |
| Veto Counter | 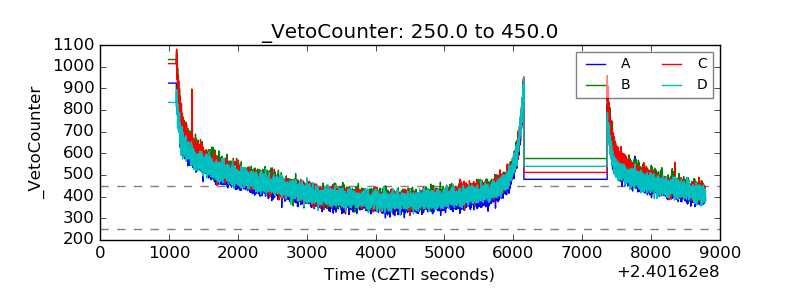 |