| Param | Original file | Final file |
|---|---|---|
| Filename | modeM0/AS1G07_065T01_9000001454_10119cztM0_level2.evt | modeM0/AS1G07_065T01_9000001454_10119cztM0_level2_quad_clean.evt |
| Size (bytes) | 121,749,120 | 35,619,840 |
| Size | 116.1 MB | 34.0 MB |
| Events in quadrant A | 869,547 | 245,979 |
| Events in quadrant B | 936,144 | 238,894 |
| Events in quadrant C | 832,078 | 240,992 |
| Events in quadrant D | 925,070 | 221,720 |
| Mode M0 | |||
|---|---|---|---|
| Quadrant | BADHDUFLAG | Total packets | Discarded packets |
| A | 0 | 4667 | 960 |
| B | 0 | 5179 | 1225 |
| C | 0 | 4585 | 912 |
| D | 0 | 5054 | 1215 |
| Mode M9 | |||
|---|---|---|---|
| Quadrant | BADHDUFLAG | Total packets | Discarded packets |
| A | 0 | 7 | 4 |
| B | 0 | 7 | 3 |
| C | 0 | 7 | 2 |
| D | 0 | 8 | 2 |
| Mode SS | |||
|---|---|---|---|
| Quadrant | BADHDUFLAG | Total packets | Discarded packets |
| A | 0 | 45 | 19 |
| B | 0 | 46 | 8 |
| C | 0 | 46 | 10 |
| D | 0 | 46 | 2 |
| Quadrant | Total seconds | Saturated seconds | Saturation percentage |
|---|---|---|---|
| A | 1801 | 6 | 0.333148% |
| B | 1744 | 4 | 0.229358% |
| C | 1812 | 2 | 0.110375% |
| D | 1757 | 5 | 0.284576% |
Noise dominated data is calculated using 1-second bins in cleaned event files. If a bin has >2000 counts, and if more than 50% of those come from <1% of pixels, then it is considered to be noise-dominated and hence unusable.
| Quadrant | # 1 sec bins | Bins with >0 counts | Bins with >2000 counts | High rate bins dominated by noise | Noise dominated (total time) | Noise dominated (detector-on time) | Marked lightcurve |
|---|---|---|---|---|---|---|---|
| A | 2233 | 2084 | 0 | 0 | 0.00% | 0.00% | 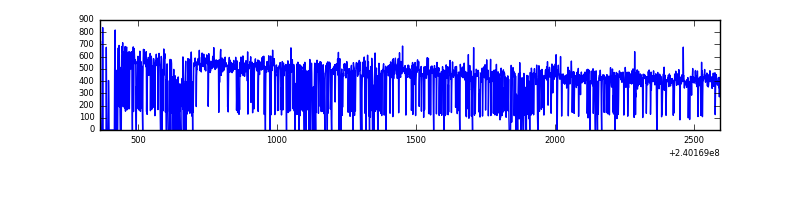 |
| B | 2223 | 2033 | 1 | 1 | 0.04% | 0.05% | 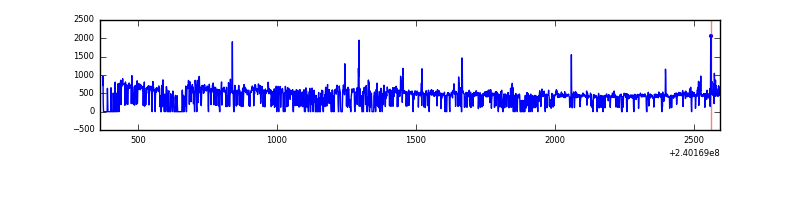 |
| C | 2233 | 2087 | 0 | 0 | 0.00% | 0.00% |  |
| D | 2232 | 2050 | 3 | 3 | 0.13% | 0.15% | 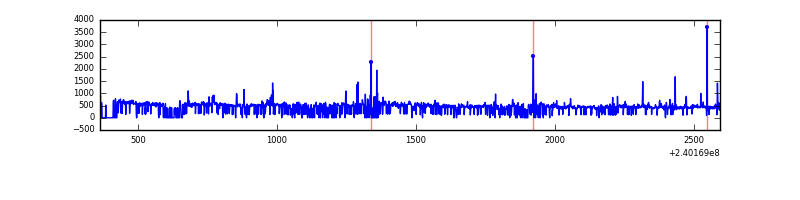 |
Top three noisy pixels from each quadrant. If the there are fewer than three noisy pixels in the level2.evt file, extra rows are filled as -1
| Pixel properties | Quadrant properties | ||||||
|---|---|---|---|---|---|---|---|
| Quadrant | DetID | PixID | Counts | Sigma | Mean | Median | Sigma |
| A | 8 | 15 | 7493 | 154.55 | 223 | 220 | 47.1 |
| A | 0 | 226 | 2129 | 40.57 | 223 | 220 | 47.1 |
| A | 12 | 194 | 2004 | 37.91 | 223 | 220 | 47.1 |
| B | 0 | 214 | 72525 | 1701.07 | 213 | 208 | 42.5 |
| B | 4 | 239 | 12276 | 283.87 | 213 | 208 | 42.5 |
| B | 0 | 219 | 10863 | 250.63 | 213 | 208 | 42.5 |
| C | 13 | 61 | 1544 | 26.21 | 213 | 213 | 50.8 |
| C | 14 | 67 | 935 | 14.22 | 213 | 213 | 50.8 |
| C | 8 | 222 | 780 | 11.17 | 213 | 213 | 50.8 |
| D | 8 | 195 | 47133 | 905.75 | 208 | 202 | 51.8 |
| D | 7 | 71 | 31201 | 598.27 | 208 | 202 | 51.8 |
| D | 2 | 152 | 21525 | 411.52 | 208 | 202 | 51.8 |
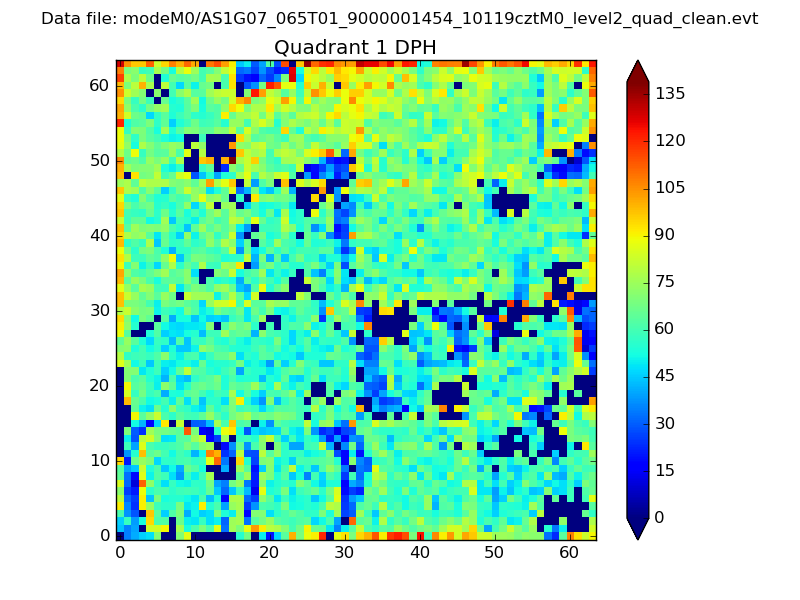
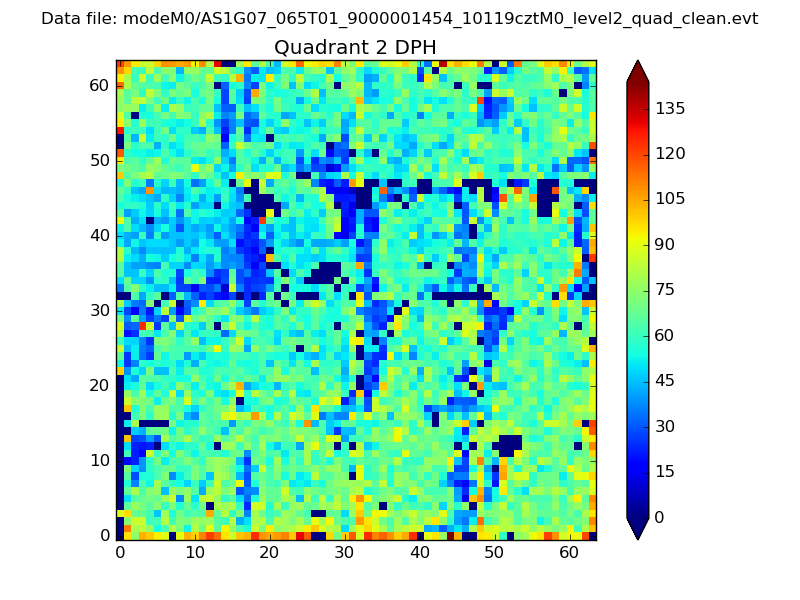
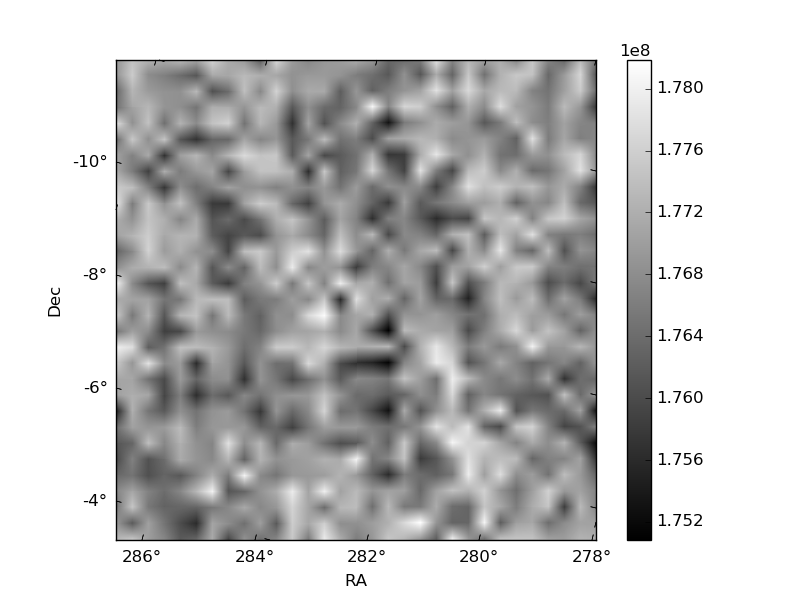
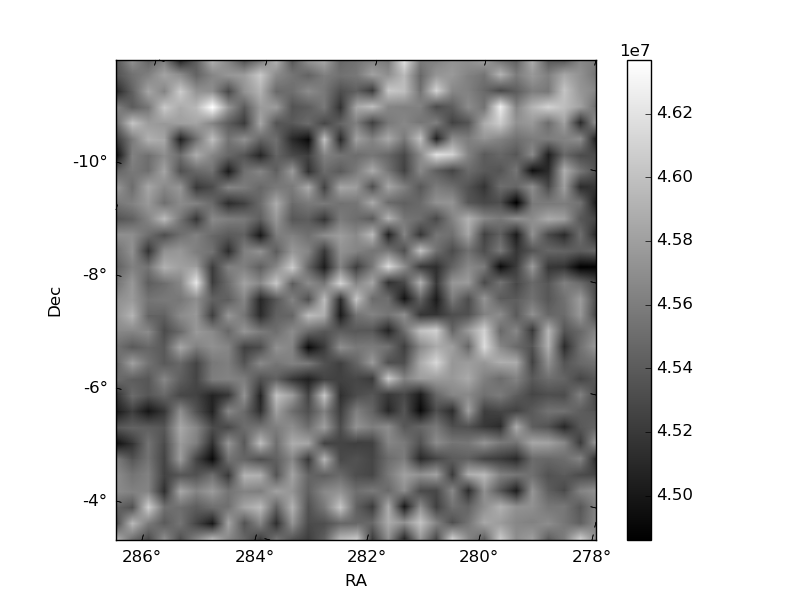
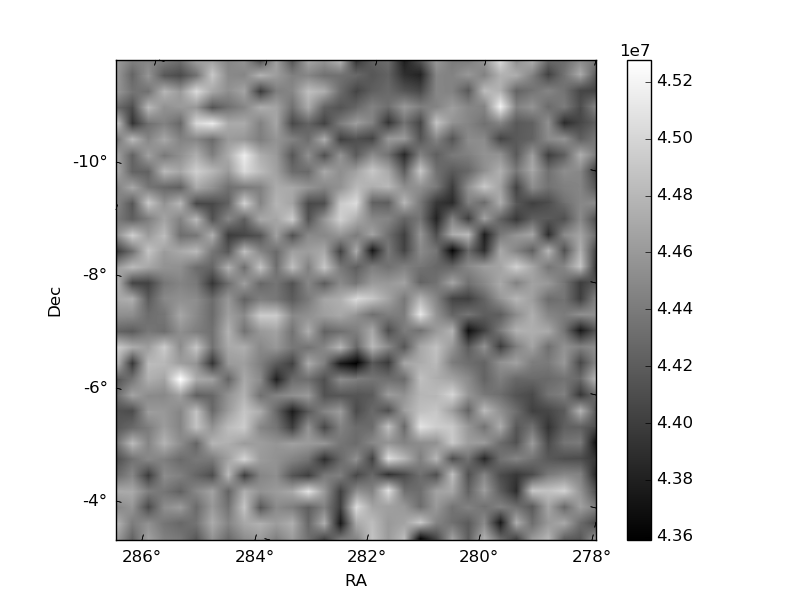
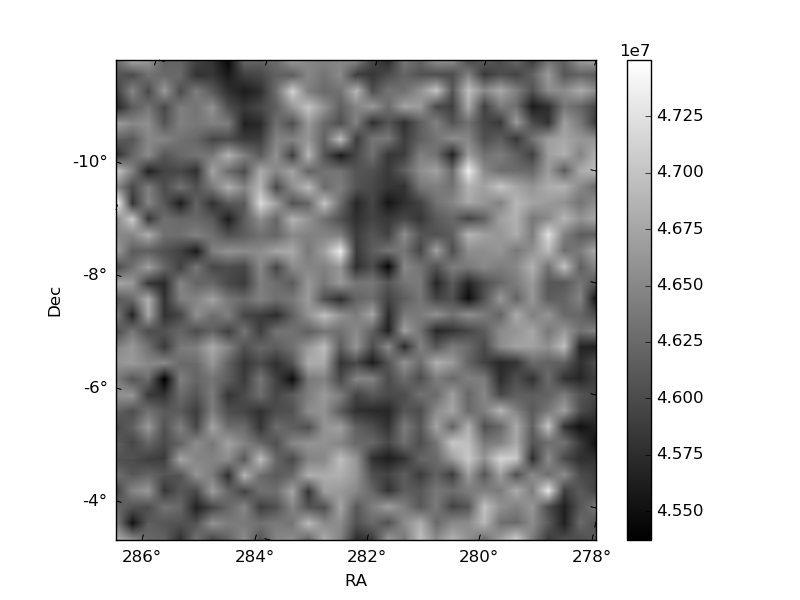
Histogram calculated using DETX and DETY for each event in the final _common_clean file
| Quadrant A | 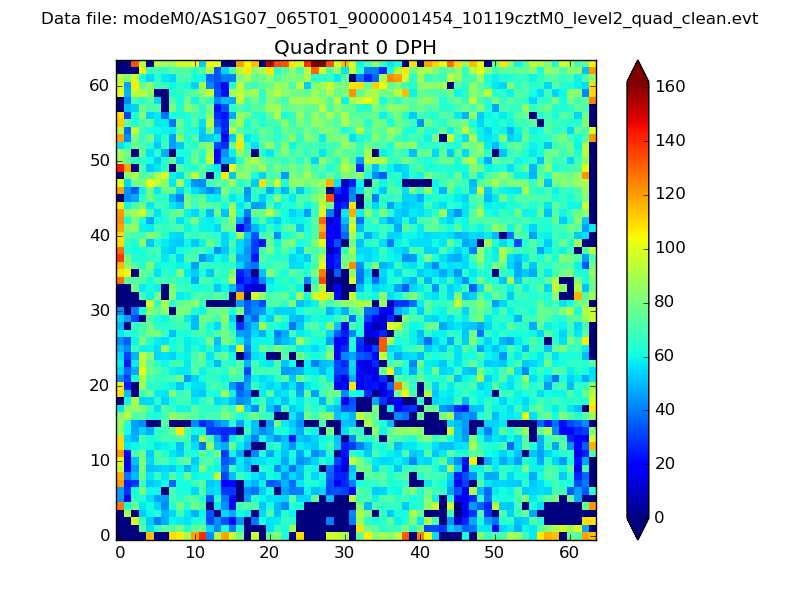 |
 |
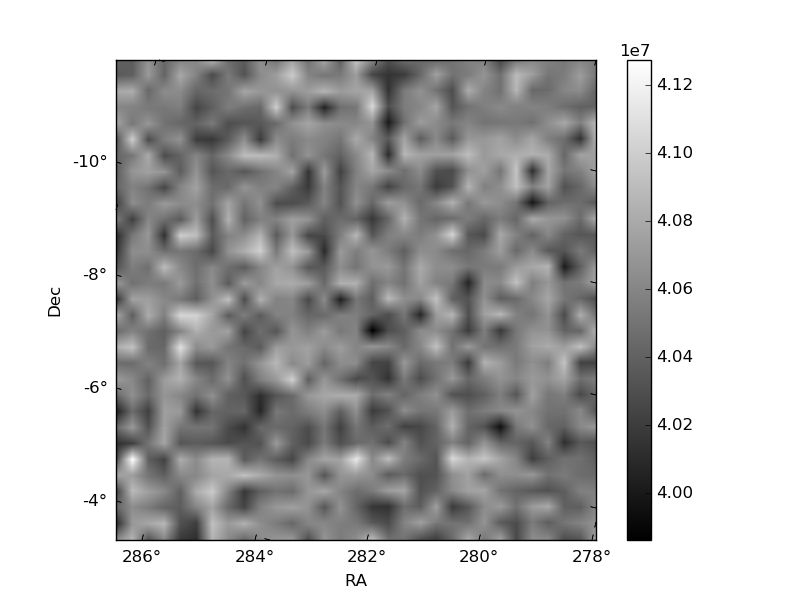
Quadrant B |
|---|---|---|---|
| Quadrant D | 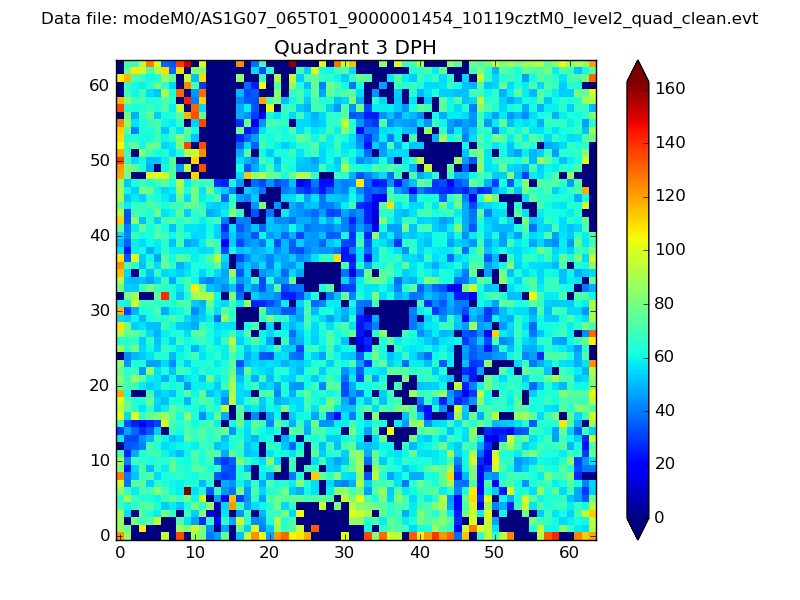 |
 |
Quadrant C |
| Plot type | Count rate plots | Images |
|---|---|---|
| Comparison with Poisson distribution Blue bars denote a histogram of data divided into 1 sec bins. Red curve is a Poisson curve with rate = median count rate of data. |
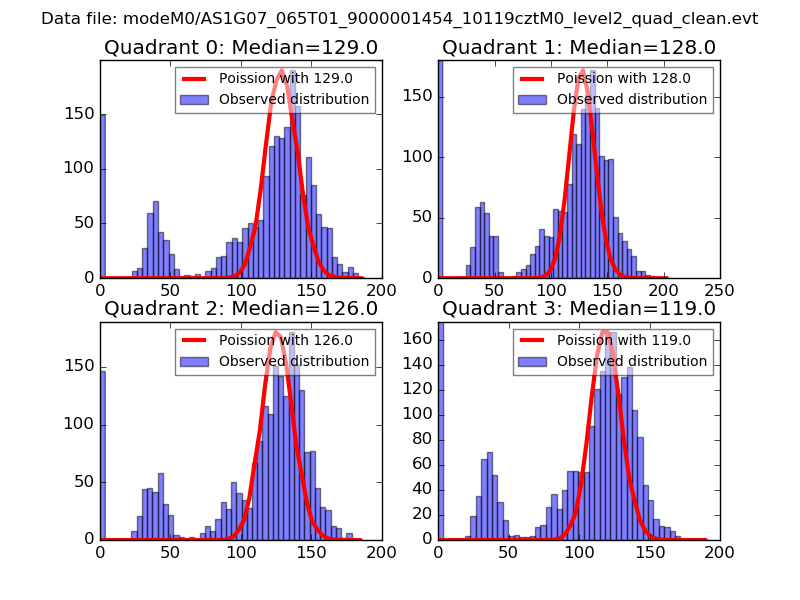 |
 |
| Quadrant-wise count rates Data is divided into 100 sec bins |
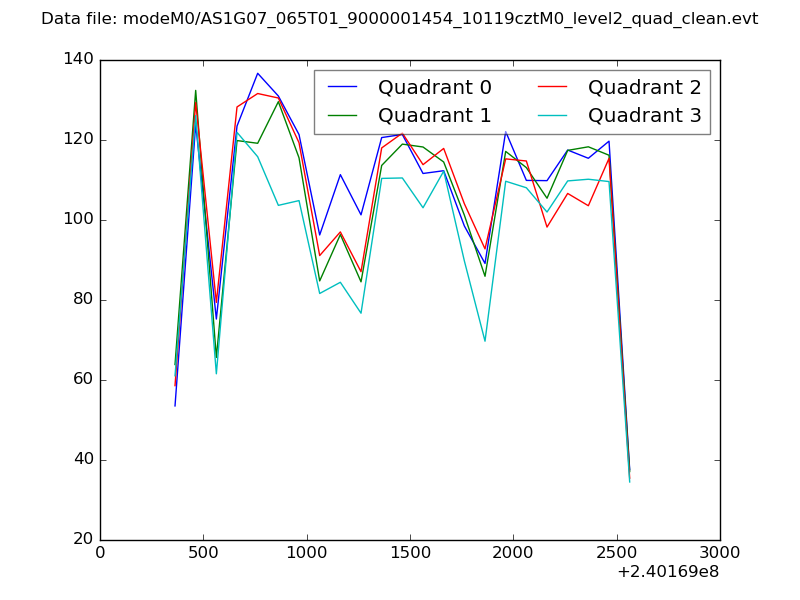 |
|
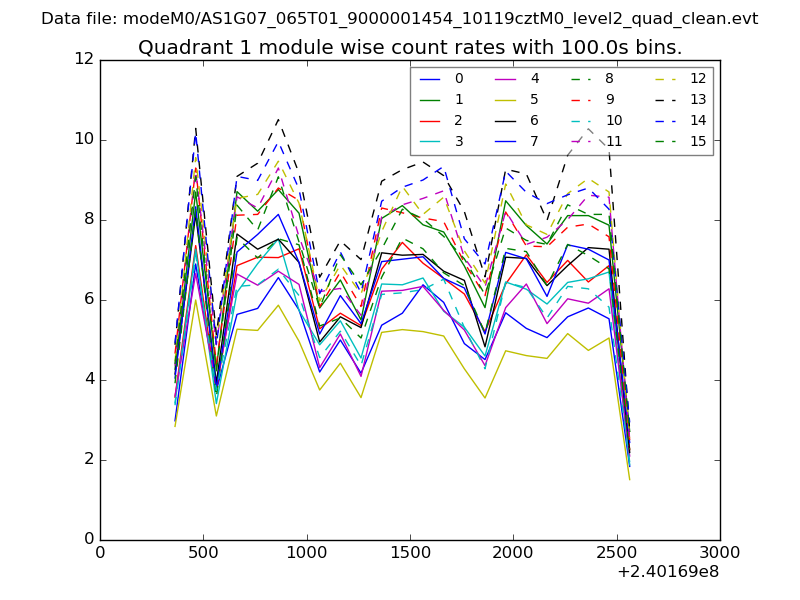
| Module-wise count rates for Quadrant A Data is divided into 100 sec bins |
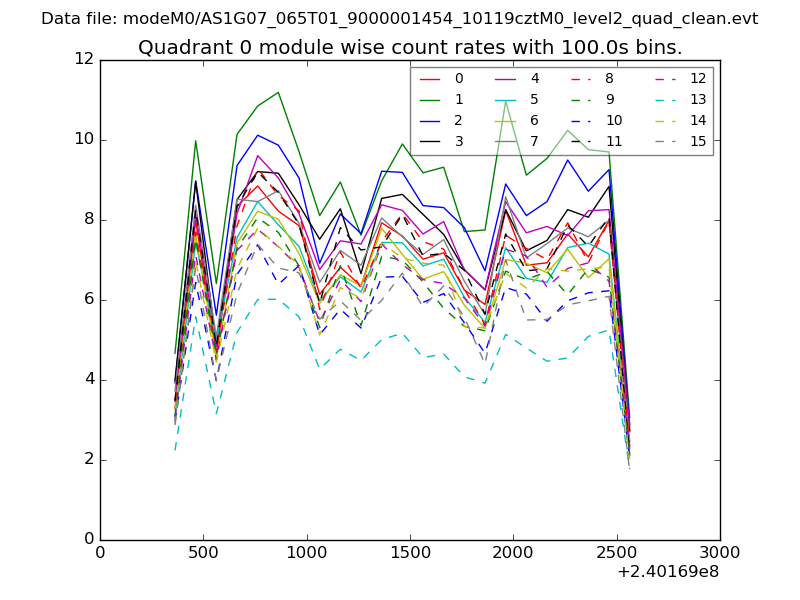 |
 |
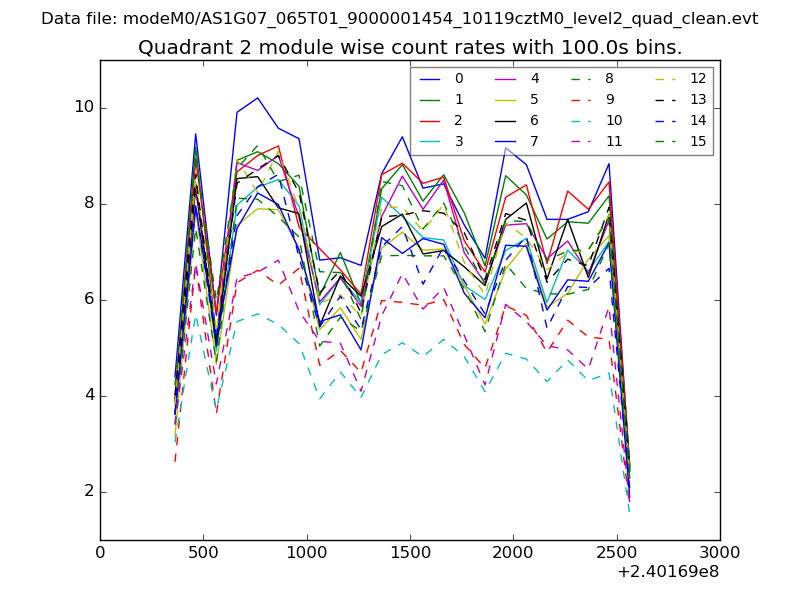
| Module-wise count rates for Quadrant B Data is divided into 100 sec bins |
 |
 |
| Module-wise count rates for Quadrant C Data is divided into 100 sec bins |
 |
 |
| Module-wise count rates for Quadrant D Data is divided into 100 sec bins |
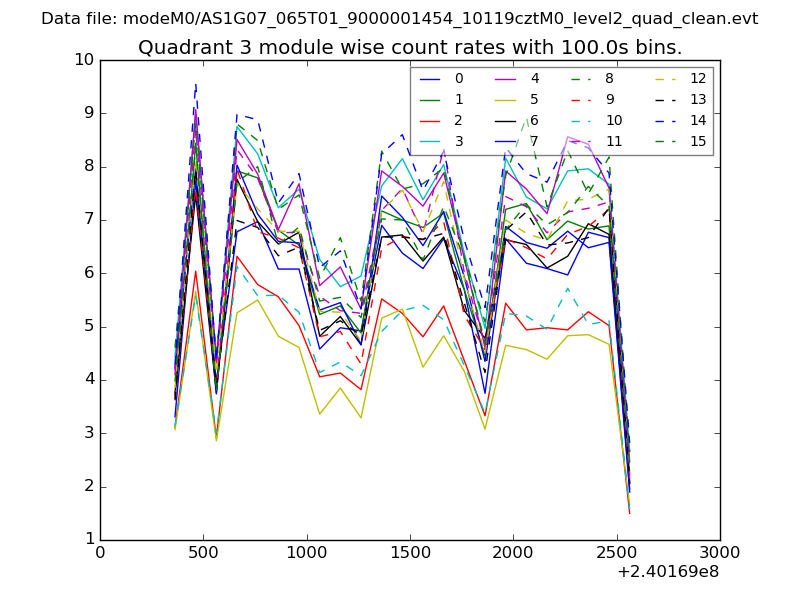 |
 |
| Parameter | Plot |
|---|---|
| CZT HV Monitor | 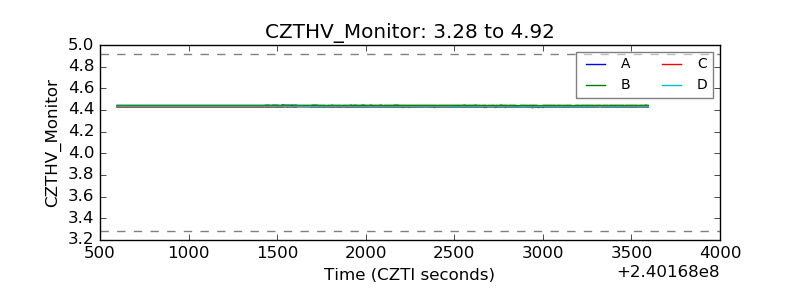 |
| D_VDD | 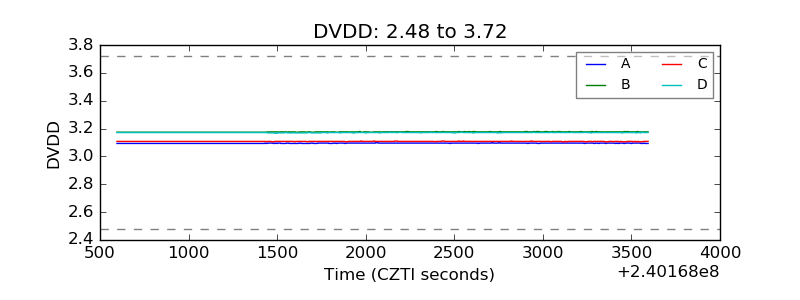 |
| Temperature 1 | 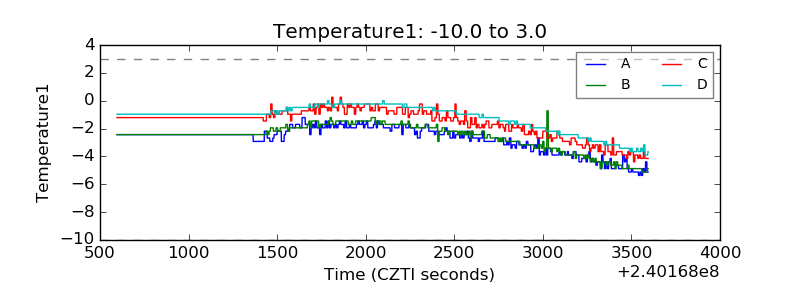 |
| Veto HV Monitor | 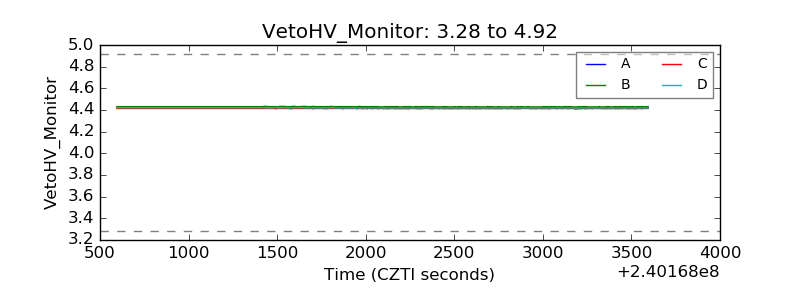 |
| Veto LLD | 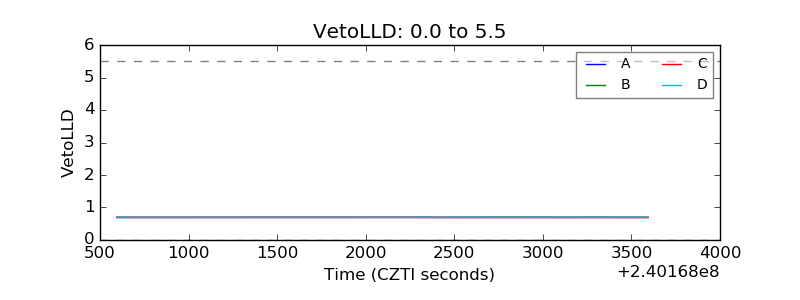 |
| Alpha Counter | 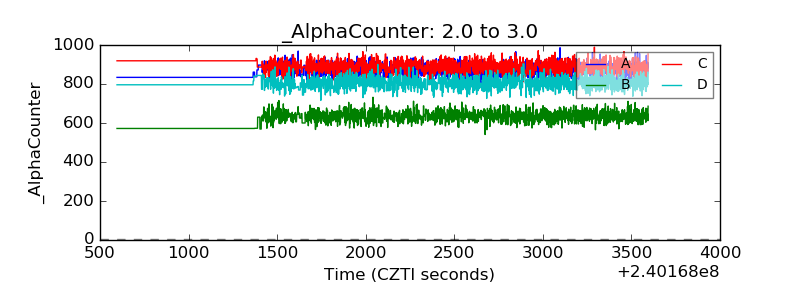 |
| _CPM_Rate | 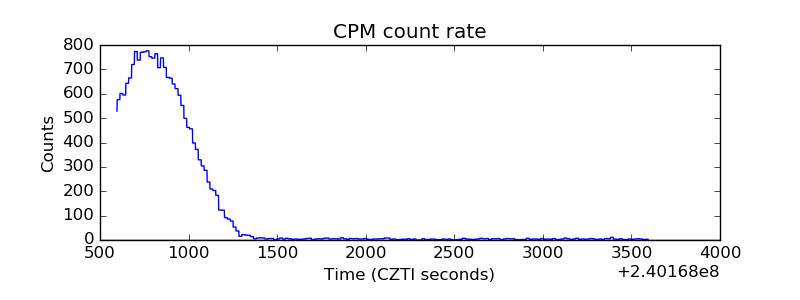 |
| CZT Counter | 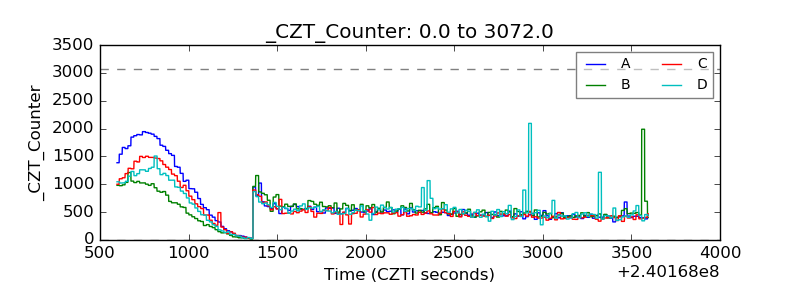 |
| +2.5 Volts monitor |  |
| +5 Volts monitor | 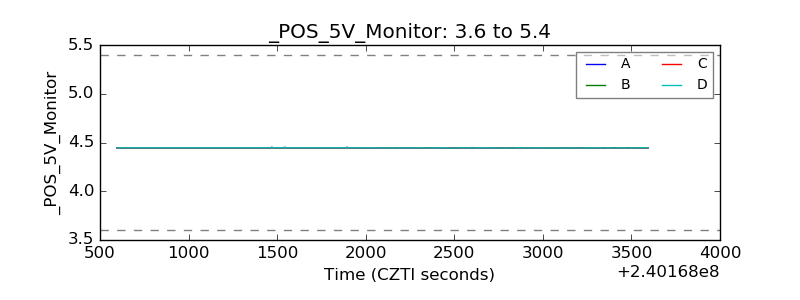 |
| _ROLL_ROT | 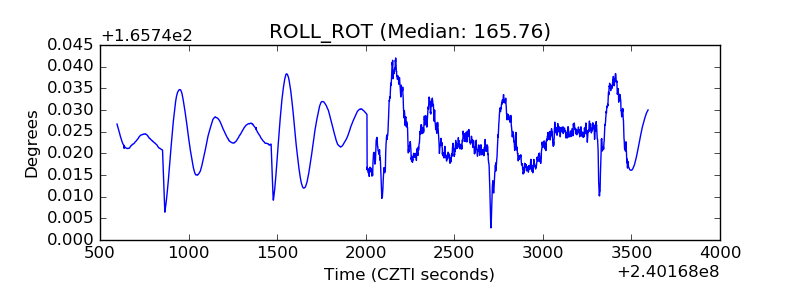 |
| _Roll_DEC |  |
| _Roll_RA | 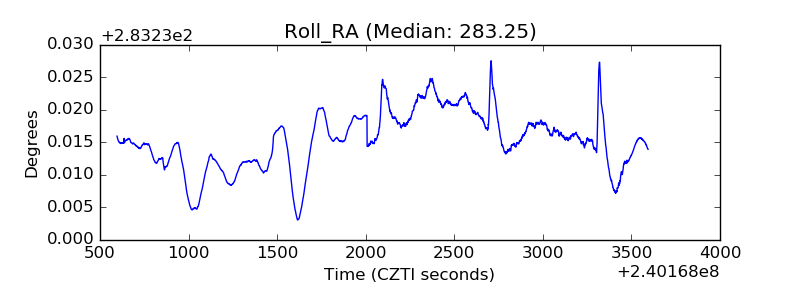 |
| Veto Counter | 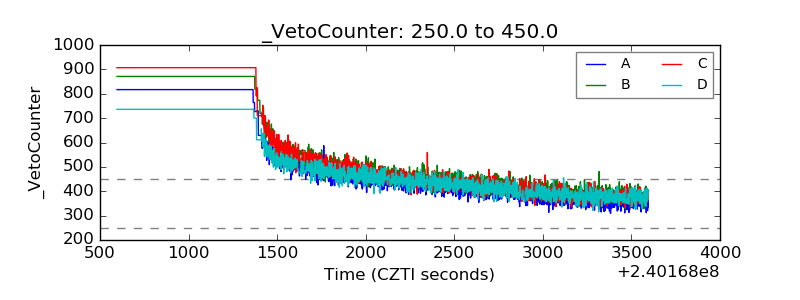 |