| Param | Original file | Final file |
|---|---|---|
| Filename | modeM0/AS1G07_065T01_9000001454_10121cztM0_level2.evt | modeM0/AS1G07_065T01_9000001454_10121cztM0_level2_quad_clean.evt |
| Size (bytes) | 133,565,760 | 38,736,000 |
| Size | 127.4 MB | 36.9 MB |
| Events in quadrant A | 929,305 | 264,237 |
| Events in quadrant B | 1,041,366 | 265,292 |
| Events in quadrant C | 881,675 | 256,655 |
| Events in quadrant D | 1,056,537 | 243,753 |
| Mode M0 | |||
|---|---|---|---|
| Quadrant | BADHDUFLAG | Total packets | Discarded packets |
| A | 0 | 3981 | 10 |
| B | 0 | 4398 | 0 |
| C | 0 | 3936 | 4 |
| D | 0 | 4361 | 4 |
| Mode SS | |||
|---|---|---|---|
| Quadrant | BADHDUFLAG | Total packets | Discarded packets |
| A | 0 | 40 | 0 |
| B | 0 | 40 | 0 |
| C | 0 | 40 | 0 |
| D | 0 | 40 | 0 |
| Quadrant | Total seconds | Saturated seconds | Saturation percentage |
|---|---|---|---|
| A | 1957 | 0 | 0.000000% |
| B | 1962 | 6 | 0.305810% |
| C | 1960 | 0 | 0.000000% |
| D | 1960 | 14 | 0.714286% |
Noise dominated data is calculated using 1-second bins in cleaned event files. If a bin has >2000 counts, and if more than 50% of those come from <1% of pixels, then it is considered to be noise-dominated and hence unusable.
| Quadrant | # 1 sec bins | Bins with >0 counts | Bins with >2000 counts | High rate bins dominated by noise | Noise dominated (total time) | Noise dominated (detector-on time) | Marked lightcurve |
|---|---|---|---|---|---|---|---|
| A | 1962 | 1962 | 0 | 0 | 0.00% | 0.00% | 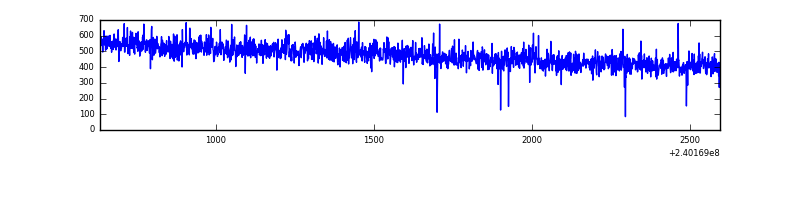 |
| B | 1962 | 1962 | 4 | 4 | 0.20% | 0.20% | 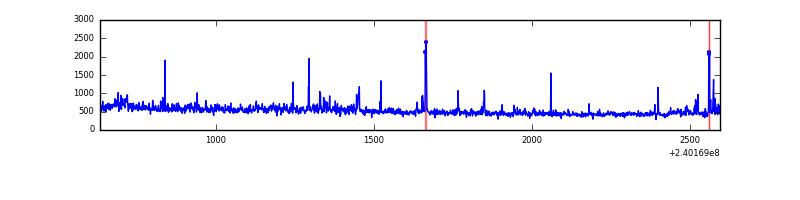 |
| C | 1962 | 1962 | 0 | 0 | 0.00% | 0.00% | 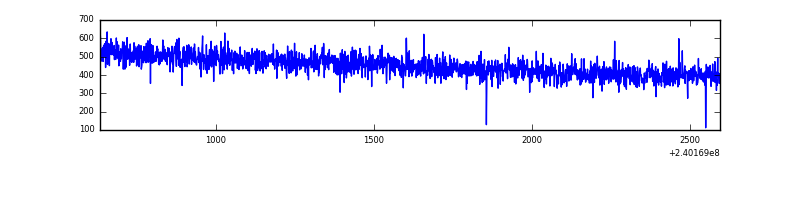 |
| D | 1962 | 1962 | 13 | 13 | 0.66% | 0.66% | 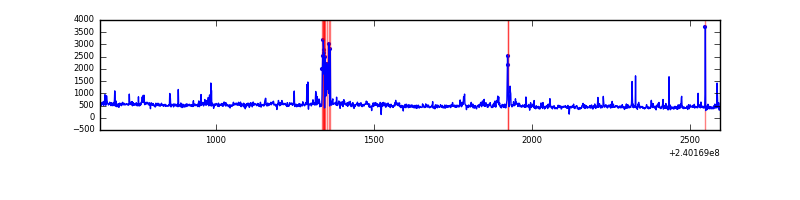 |
Top three noisy pixels from each quadrant. If the there are fewer than three noisy pixels in the level2.evt file, extra rows are filled as -1
| Pixel properties | Quadrant properties | ||||||
|---|---|---|---|---|---|---|---|
| Quadrant | DetID | PixID | Counts | Sigma | Mean | Median | Sigma |
| A | 8 | 15 | 9095 | 178.72 | 238 | 235 | 49.6 |
| A | 0 | 226 | 2287 | 41.39 | 238 | 235 | 49.6 |
| A | 12 | 194 | 2097 | 37.56 | 238 | 235 | 49.6 |
| B | 0 | 214 | 84423 | 1805.26 | 235 | 231 | 46.6 |
| B | 4 | 239 | 15034 | 317.41 | 235 | 231 | 46.6 |
| B | 0 | 219 | 11367 | 238.78 | 235 | 231 | 46.6 |
| C | 13 | 61 | 1667 | 26.94 | 225 | 226 | 53.5 |
| C | 14 | 67 | 1163 | 17.52 | 225 | 226 | 53.5 |
| C | 8 | 222 | 791 | 10.56 | 225 | 226 | 53.5 |
| D | 8 | 195 | 54103 | 955.29 | 227 | 220 | 56.4 |
| D | 2 | 14 | 43593 | 768.96 | 227 | 220 | 56.4 |
| D | 7 | 71 | 40595 | 715.81 | 227 | 220 | 56.4 |
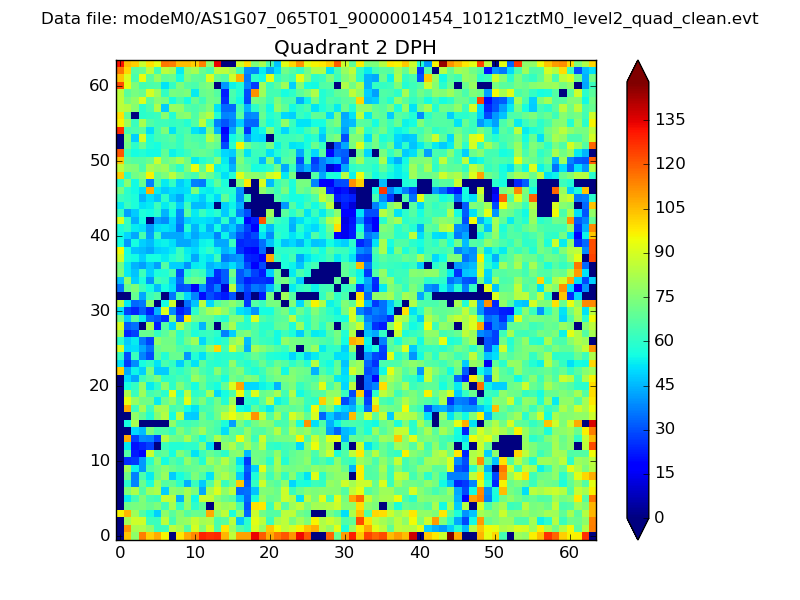
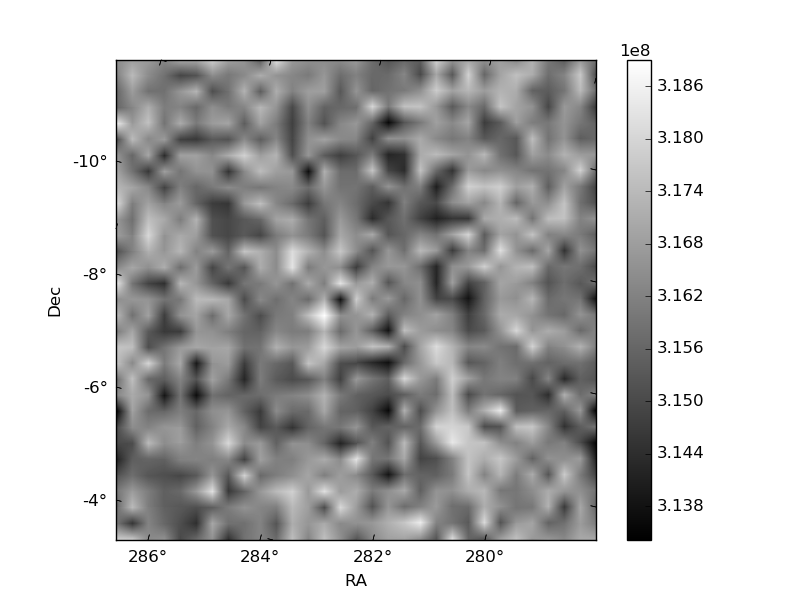
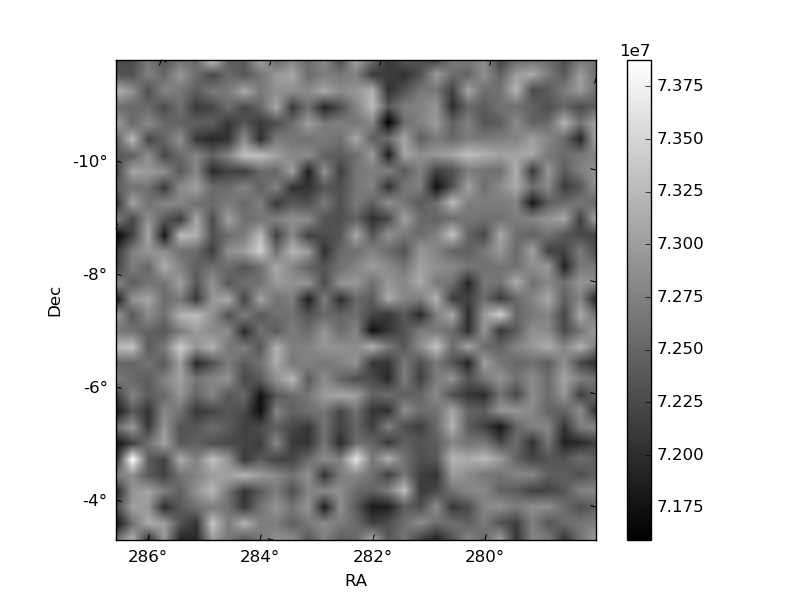
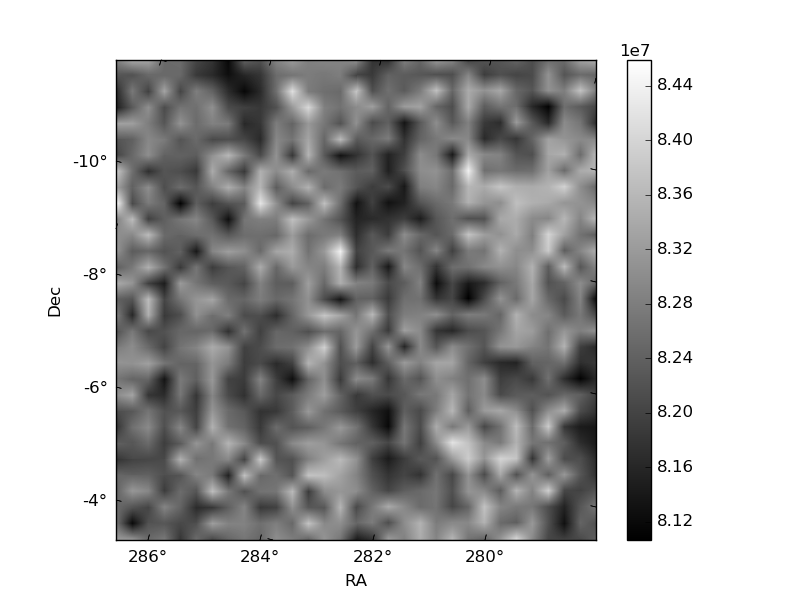
Histogram calculated using DETX and DETY for each event in the final _common_clean file
| Quadrant A | 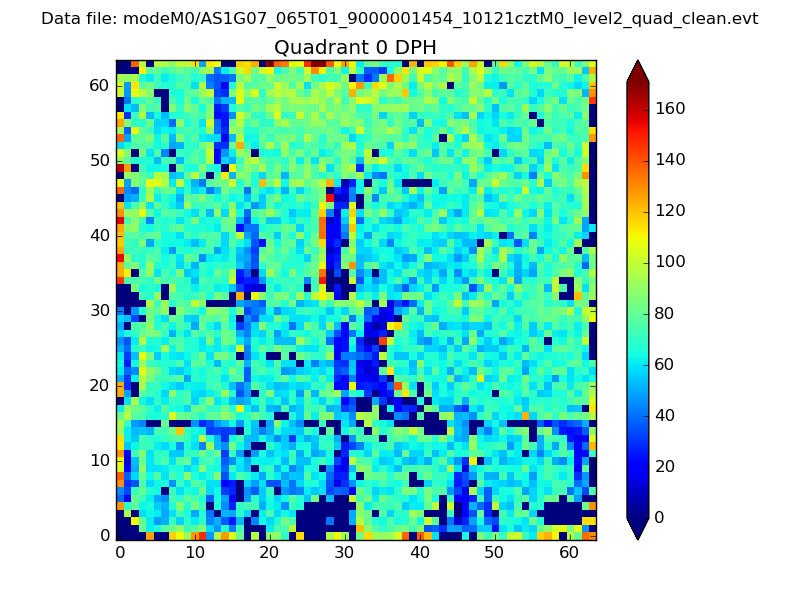 |
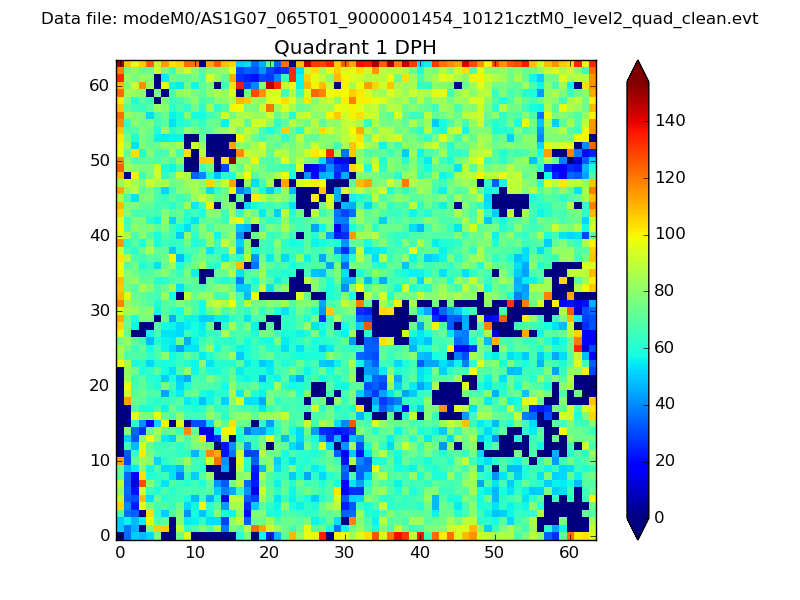 |
Quadrant B |
|---|---|---|---|
| Quadrant D | 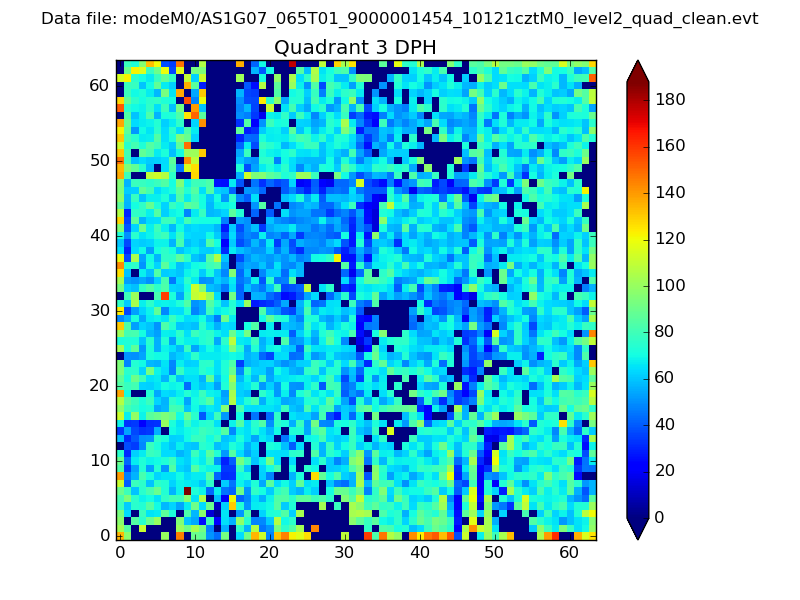 |
 |
Quadrant C |
| Plot type | Count rate plots | Images |
|---|---|---|
| Comparison with Poisson distribution Blue bars denote a histogram of data divided into 1 sec bins. Red curve is a Poisson curve with rate = median count rate of data. |
 |
 |
| Quadrant-wise count rates Data is divided into 100 sec bins |
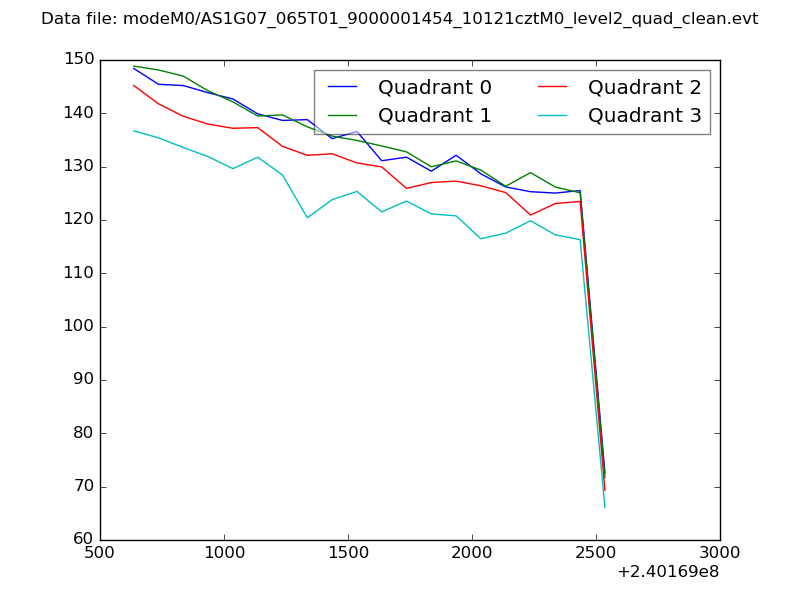 |
|
| Module-wise count rates for Quadrant A Data is divided into 100 sec bins |
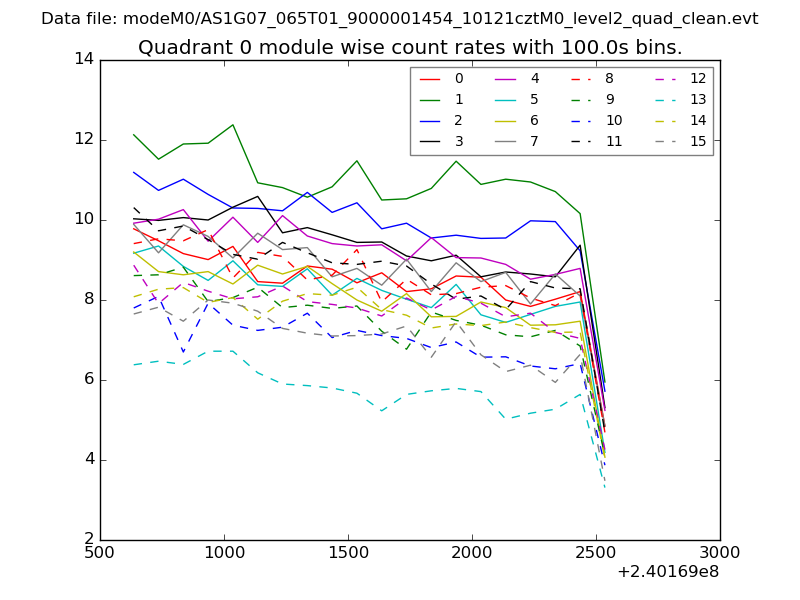 |
 |
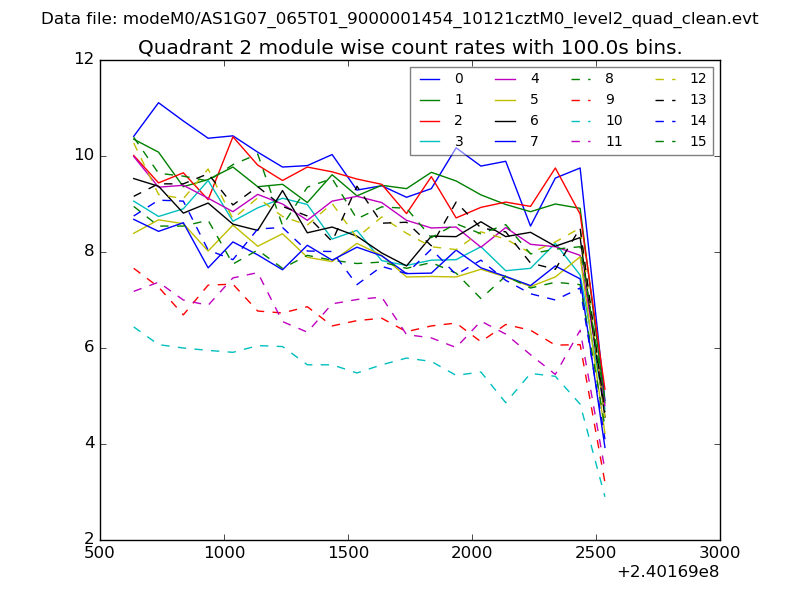
| Module-wise count rates for Quadrant B Data is divided into 100 sec bins |
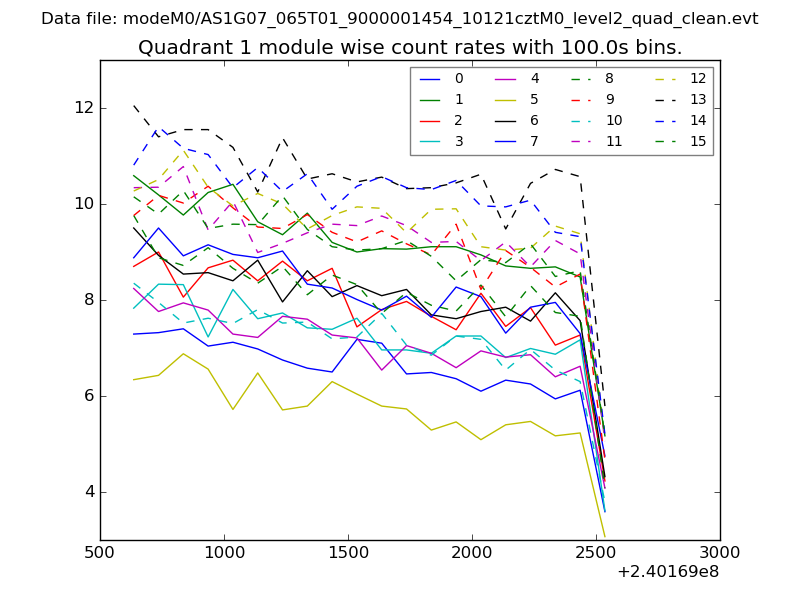 |
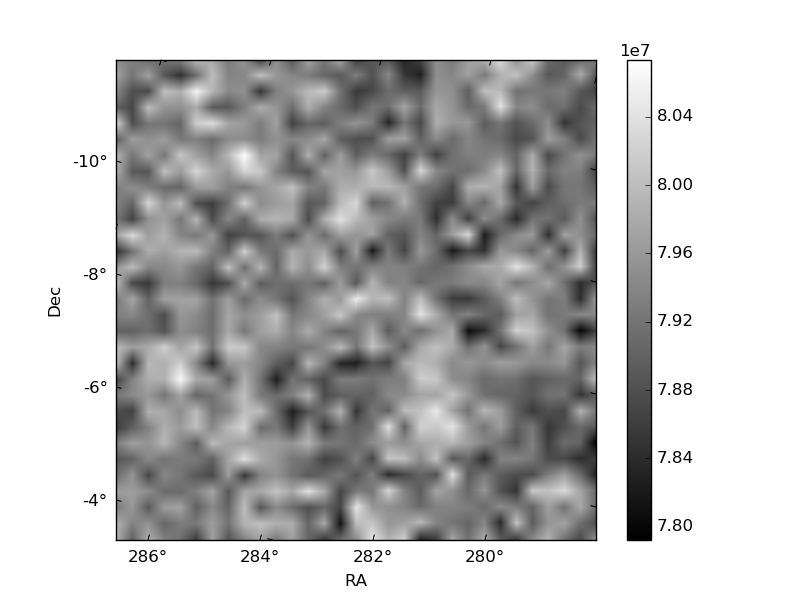 |
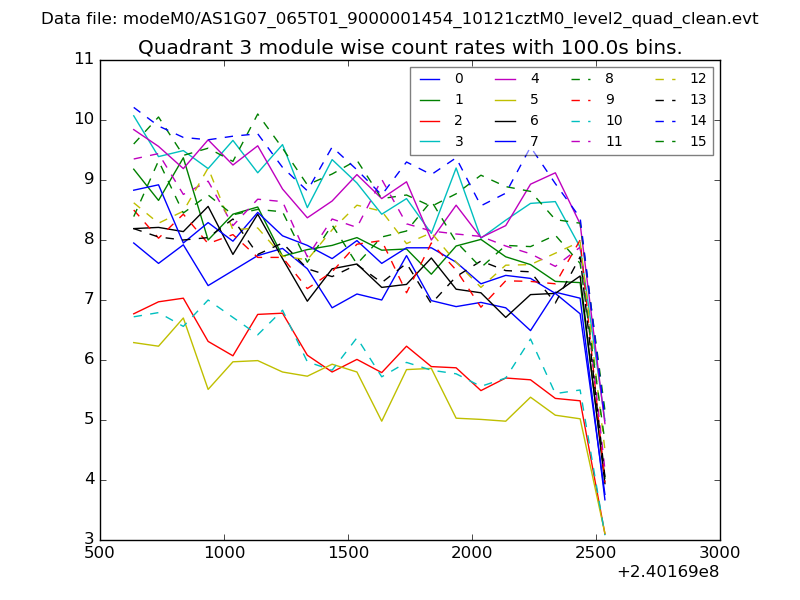
| Module-wise count rates for Quadrant C Data is divided into 100 sec bins |
 |
 |
| Module-wise count rates for Quadrant D Data is divided into 100 sec bins |
 |
 |
| Parameter | Plot |
|---|---|
| CZT HV Monitor | 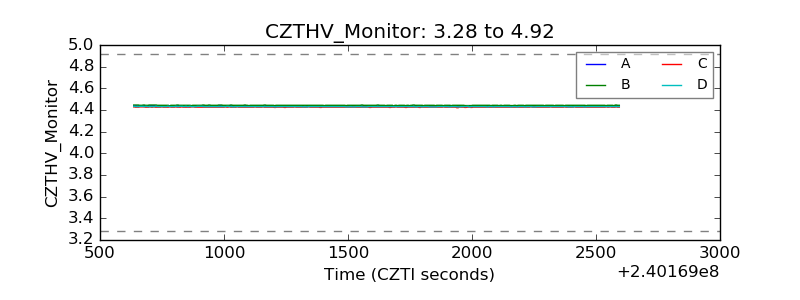 |
| D_VDD |  |
| Temperature 1 |  |
| Veto HV Monitor | 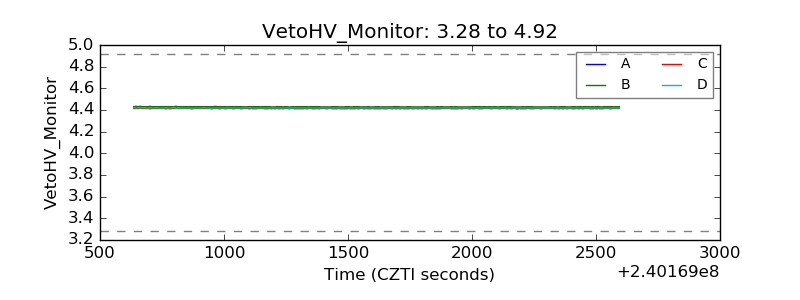 |
| Veto LLD |  |
| Alpha Counter | 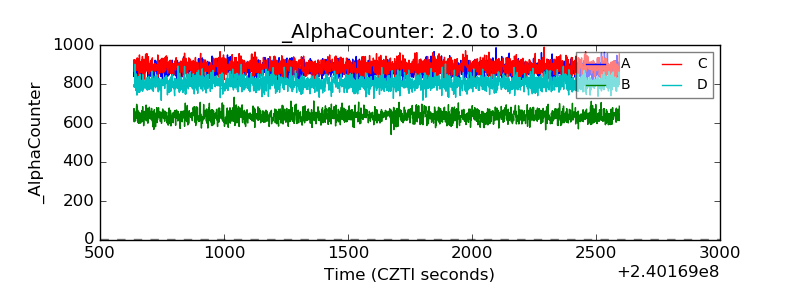 |
| _CPM_Rate | 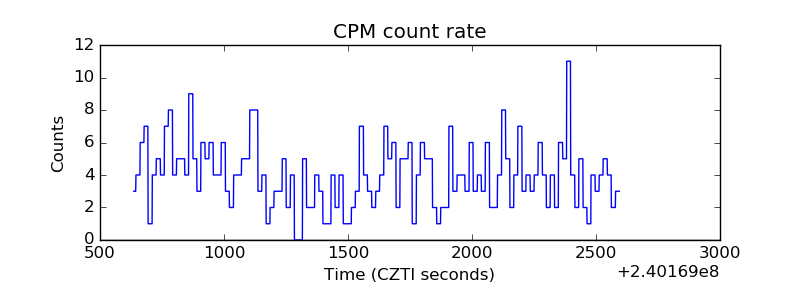 |
| CZT Counter | 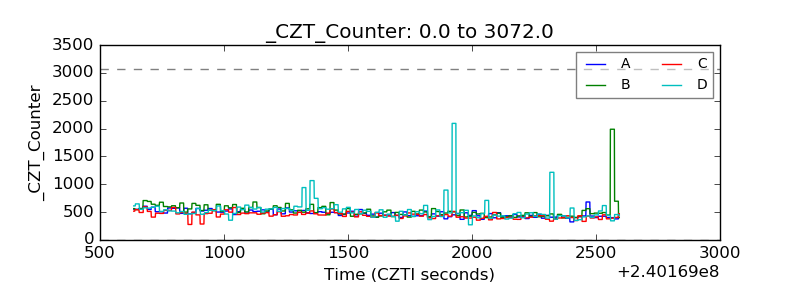 |
| +2.5 Volts monitor |  |
| +5 Volts monitor |  |
| _ROLL_ROT | 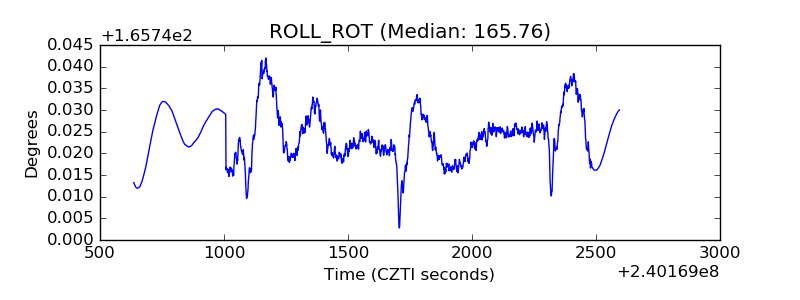 |
| _Roll_DEC | 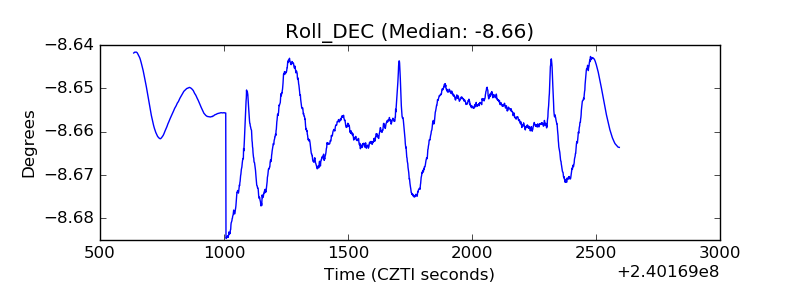 |
| _Roll_RA | 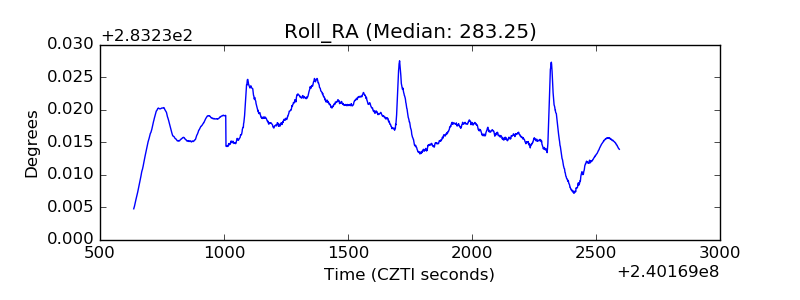 |
| Veto Counter | 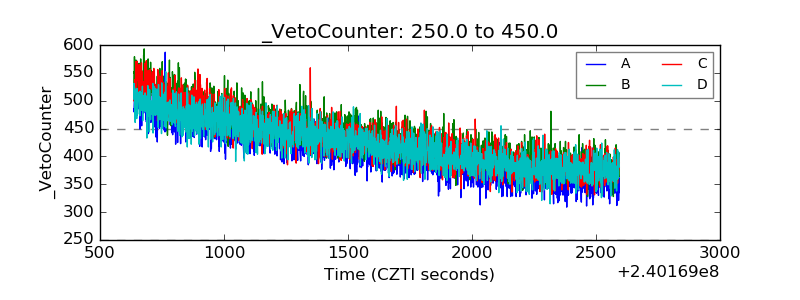 |