| Param | Original file | Final file |
|---|---|---|
| Filename | modeM0/AS1G07_013T01_9000001456cztM0_level2.fits | modeM0/AS1G07_013T01_9000001456cztM0_level2_quad_clean.evt |
| Size (bytes) | 161,861,760 | 236,741,760 |
| Size | 154.4 MB | 225.8 MB |
| Events in quadrant A | 968,131 | 1,530,337 |
| Events in quadrant B | 923,730 | 1,524,067 |
| Events in quadrant C | 952,960 | 1,509,386 |
| Events in quadrant D | 806,614 | 1,357,821 |
| Mode SS | |||
|---|---|---|---|
| Quadrant | BADHDUFLAG | Total packets | Discarded packets |
| A | 0 | 391 | 0 |
| B | 0 | 426 | 0 |
| C | 0 | 374 | 0 |
| D | 0 | 401 | 0 |
| Mode M9 | |||
|---|---|---|---|
| Quadrant | BADHDUFLAG | Total packets | Discarded packets |
| A | 0 | 33 | 0 |
| B | 0 | 35 | 0 |
| C | 0 | 45 | 0 |
| D | 0 | 30 | 0 |
| Mode M0 | |||
|---|---|---|---|
| Quadrant | BADHDUFLAG | Total packets | Discarded packets |
| A | 0 | 37061 | 0 |
| B | 0 | 37532 | 0 |
| C | 0 | 36670 | 0 |
| D | 0 | 40289 | 0 |
| Quadrant | Total seconds | Saturated seconds | Saturation percentage |
|---|---|---|---|
| A | 18162 | 97 | 0.534082% |
| B | 17956 | 151 | 0.840945% |
| C | 18136 | 68 | 0.374945% |
| D | 17755 | 199 | 1.120811% |
Noise dominated data is calculated using 1-second bins in cleaned event files. If a bin has >2000 counts, and if more than 50% of those come from <1% of pixels, then it is considered to be noise-dominated and hence unusable.
| Quadrant | # 1 sec bins | Bins with >0 counts | Bins with >2000 counts | High rate bins dominated by noise | Noise dominated (total time) | Noise dominated (detector-on time) | Marked lightcurve |
|---|---|---|---|---|---|---|---|
| A | 50684 | 19622 | 0 | 0 | 0.00% | 0.00% | 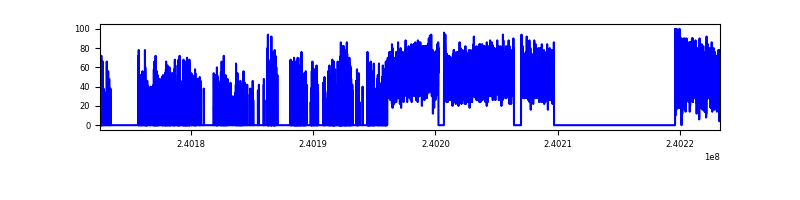 |
| B | 50691 | 19307 | 0 | 0 | 0.00% | 0.00% | 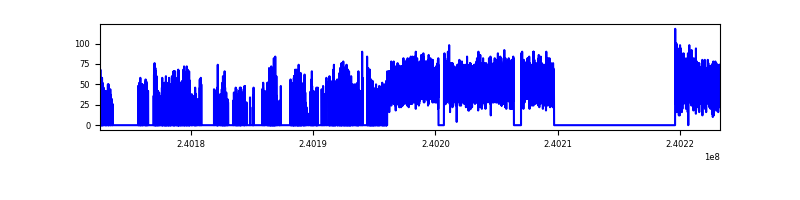 |
| C | 50688 | 19606 | 0 | 0 | 0.00% | 0.00% |  |
| D | 50690 | 18922 | 0 | 0 | 0.00% | 0.00% | 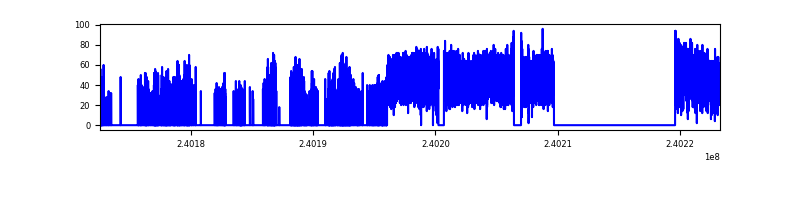 |
Top three noisy pixels from each quadrant. If the there are fewer than three noisy pixels in the level2.evt file, extra rows are filled as -1
| Pixel properties | Quadrant properties | ||||||
|---|---|---|---|---|---|---|---|
| Quadrant | DetID | PixID | Counts | Sigma | Mean | Median | Sigma |
| A | 14 | 188 | 942 | 10.78 | 251 | 235 | 65.6 |
| A | 0 | 29 | 913 | 10.34 | 251 | 235 | 65.6 |
| A | 14 | 204 | 810 | 8.77 | 251 | 235 | 65.6 |
| B | 2 | 9 | 822 | 11.82 | 243 | 231 | 50.0 |
| B | 14 | 254 | 674 | 8.86 | 243 | 231 | 50.0 |
| B | 3 | 17 | 639 | 8.16 | 243 | 231 | 50.0 |
| C | 12 | 241 | 654 | 6.25 | 251 | 235 | 67.0 |
| C | 2 | 191 | 635 | 5.97 | 251 | 235 | 67.0 |
| C | 3 | 126 | 629 | 5.88 | 251 | 235 | 67.0 |
| D | 10 | 189 | 606 | 6.17 | 230 | 209 | 64.3 |
| D | 3 | 14 | 602 | 6.11 | 230 | 209 | 64.3 |
| D | 3 | 30 | 594 | 5.99 | 230 | 209 | 64.3 |
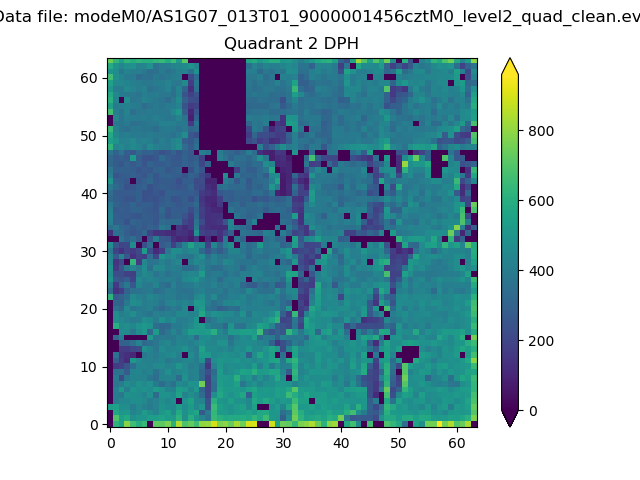
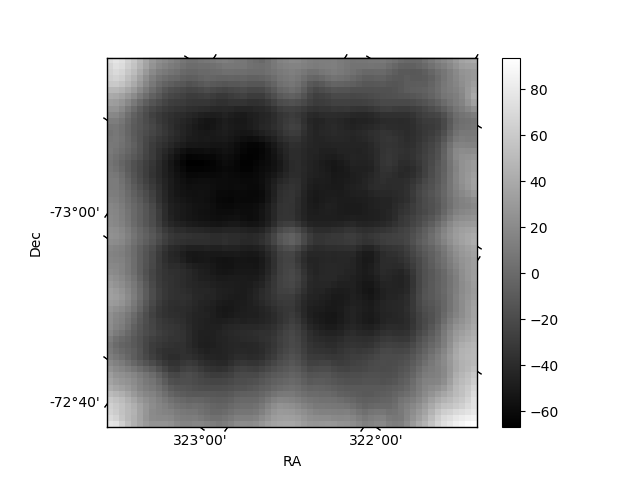
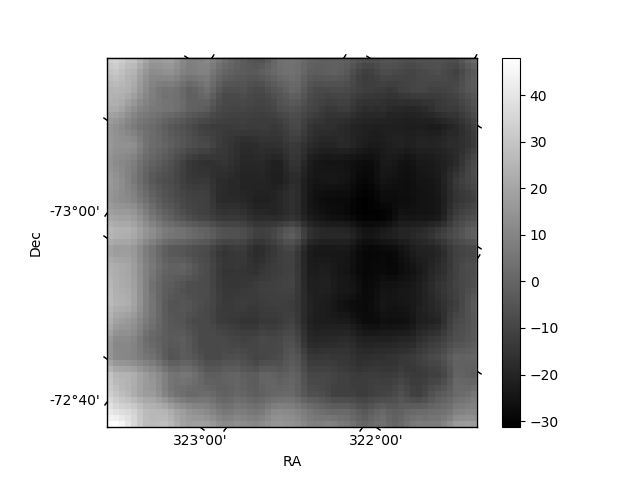
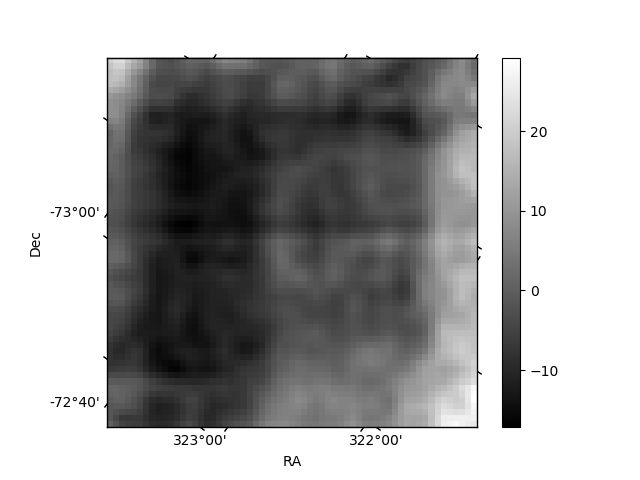
Histogram calculated using DETX and DETY for each event in the final _common_clean file
| Quadrant A | 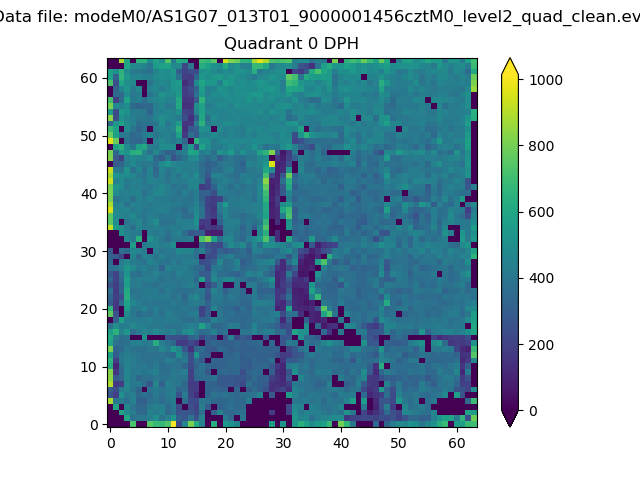 |
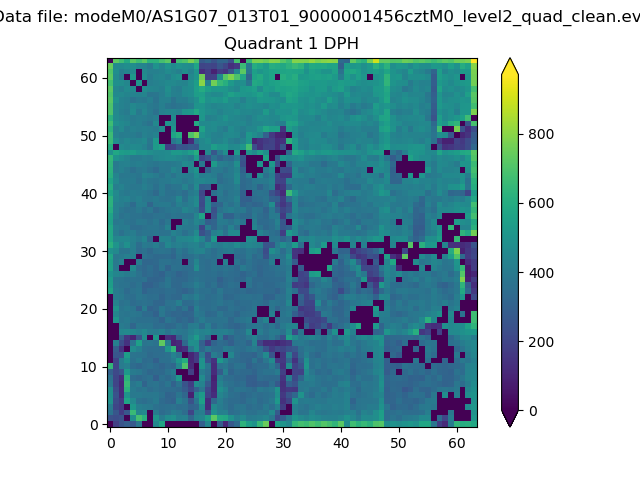 |
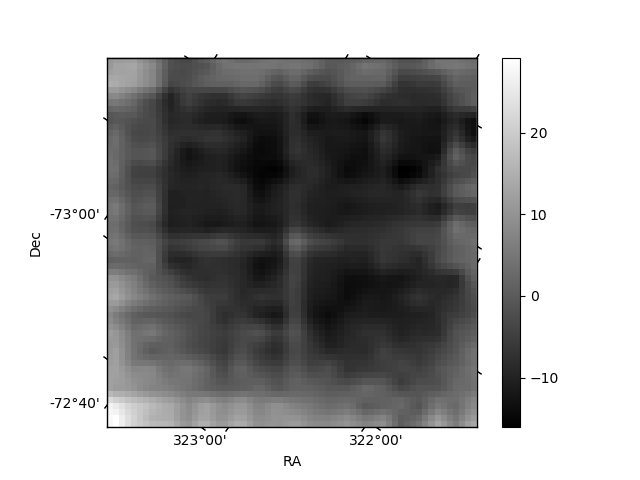
Quadrant B |
|---|---|---|---|
| Quadrant D | 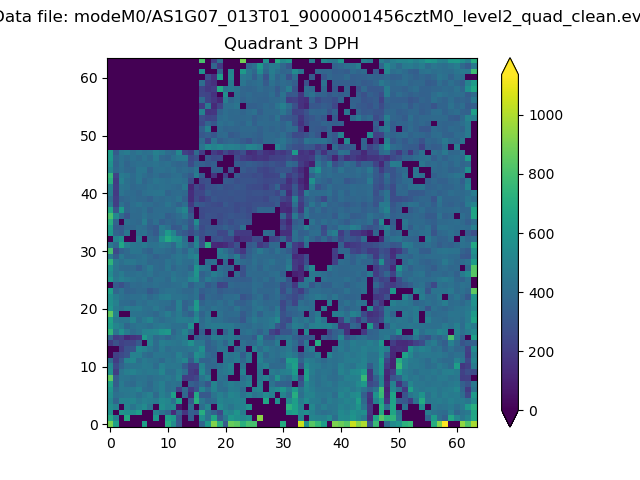 |
 |
Quadrant C |
| Plot type | Count rate plots | Images |
|---|---|---|
| Comparison with Poisson distribution Blue bars denote a histogram of data divided into 1 sec bins. Red curve is a Poisson curve with rate = median count rate of data. |
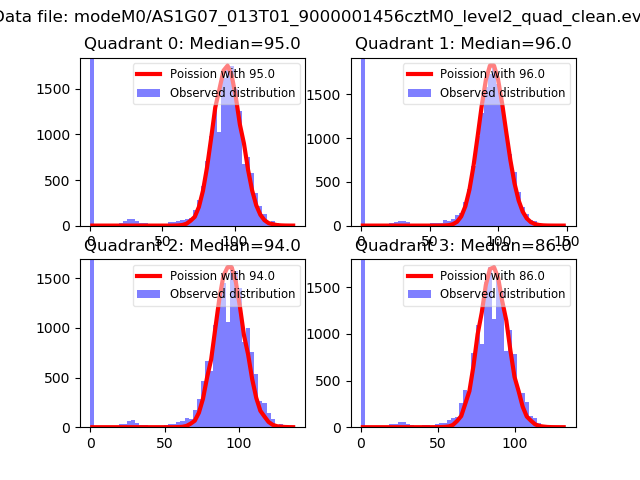 |
 |
| Quadrant-wise count rates Data is divided into 100 sec bins |
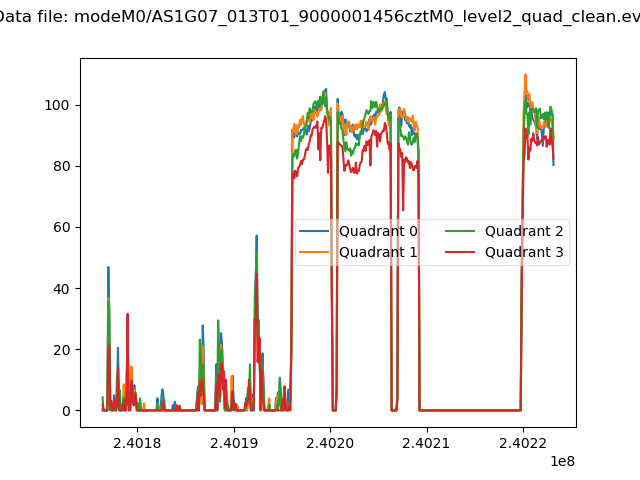 |
|
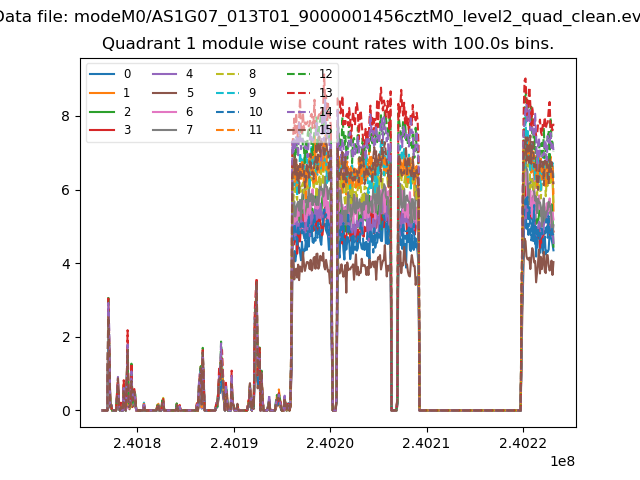
| Module-wise count rates for Quadrant A Data is divided into 100 sec bins |
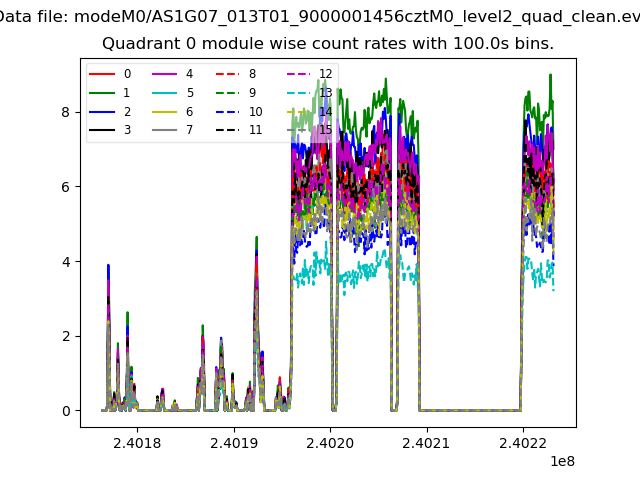 |
 |
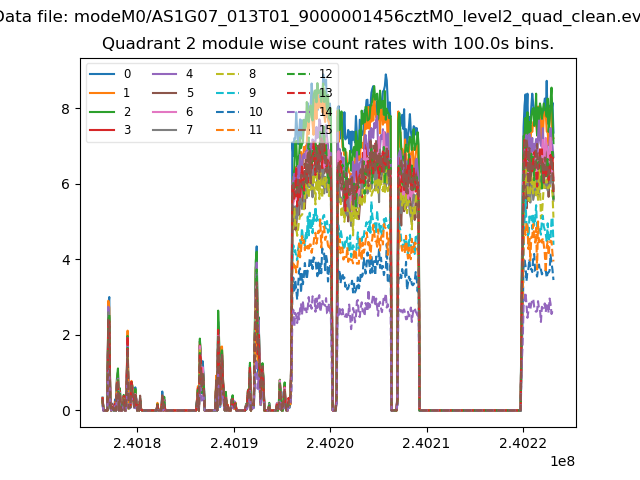
| Module-wise count rates for Quadrant B Data is divided into 100 sec bins |
 |
 |
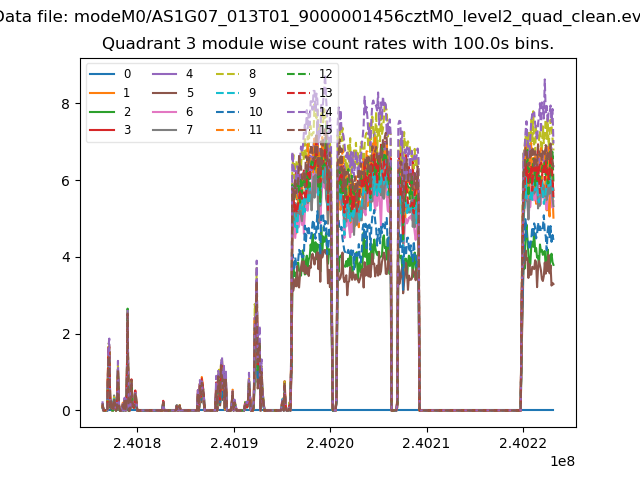
| Module-wise count rates for Quadrant C Data is divided into 100 sec bins |
 |
 |
| Module-wise count rates for Quadrant D Data is divided into 100 sec bins |
 |
 |
| Parameter | Plot |
|---|---|
| CZT HV Monitor | 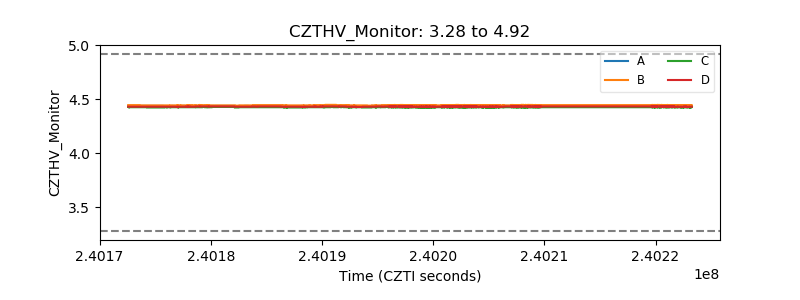 |
| D_VDD | 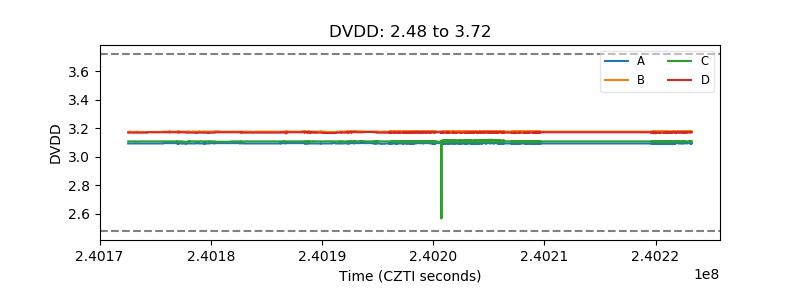 |
| Temperature 1 | 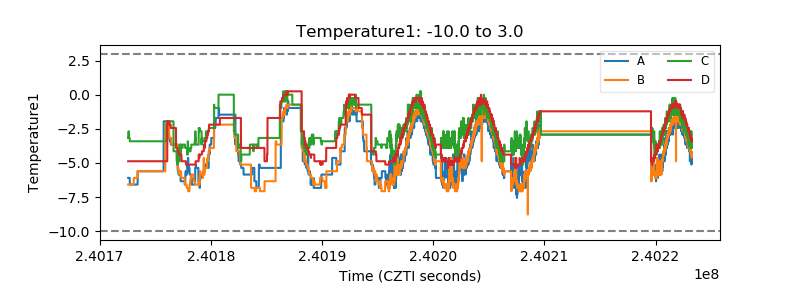 |
| Veto HV Monitor |  |
| Veto LLD | 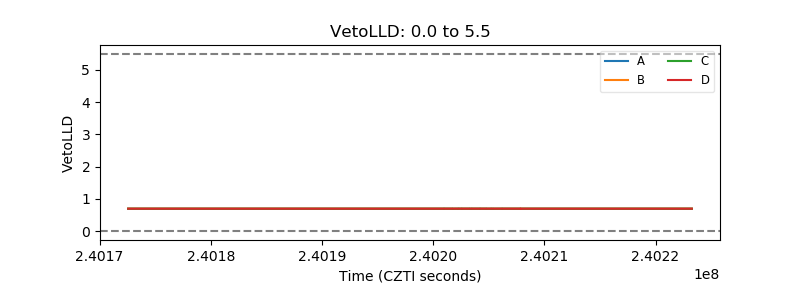 |
| Alpha Counter | 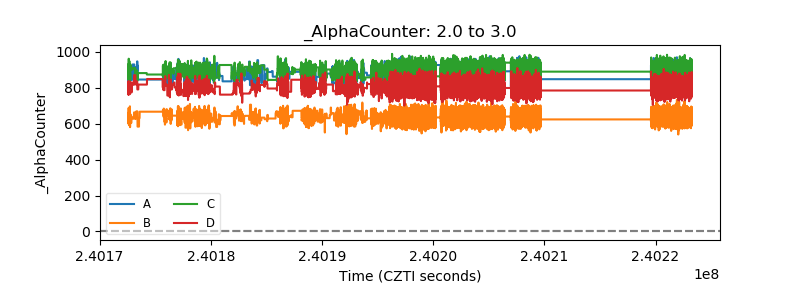 |
| _CPM_Rate | 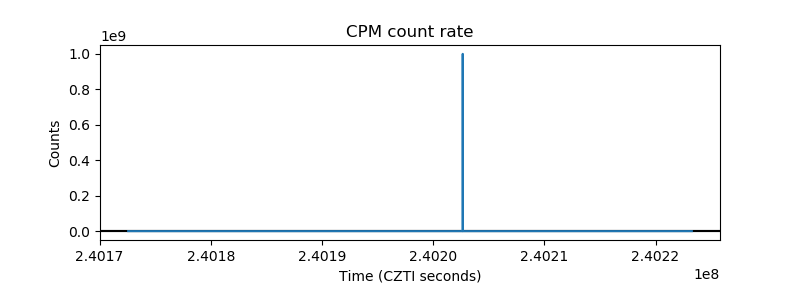 |
| CZT Counter | 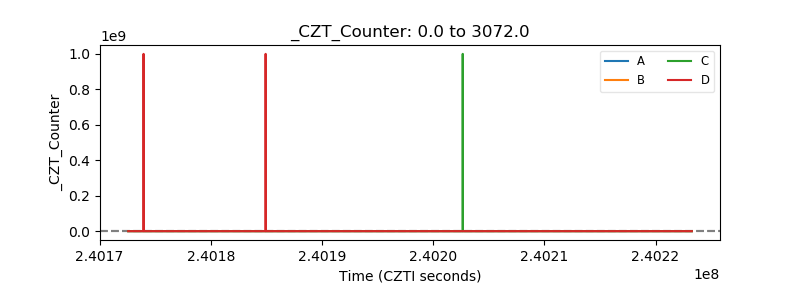 |
| +2.5 Volts monitor | 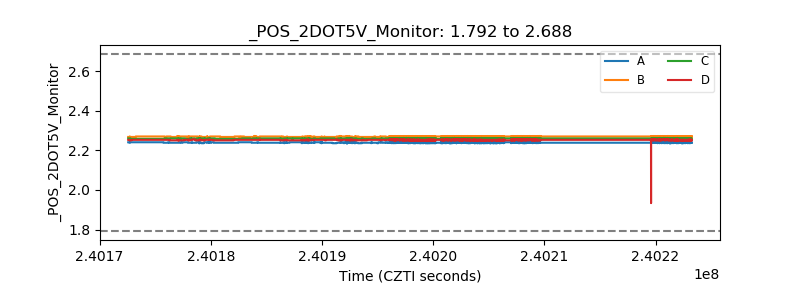 |
| +5 Volts monitor | 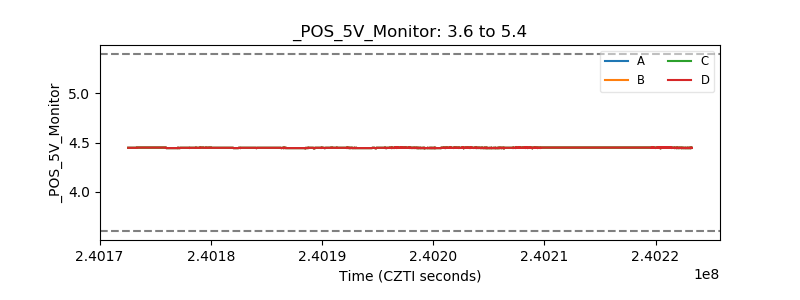 |
| _ROLL_ROT | 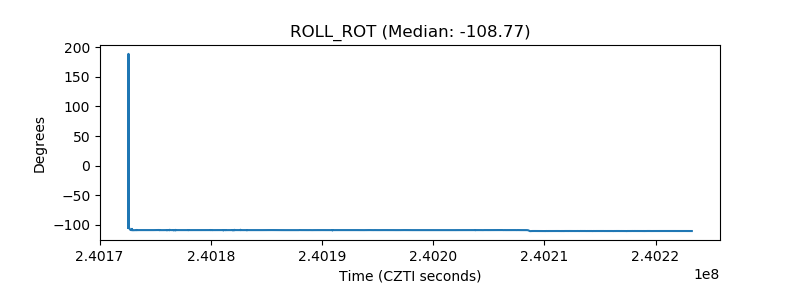 |
| _Roll_DEC | 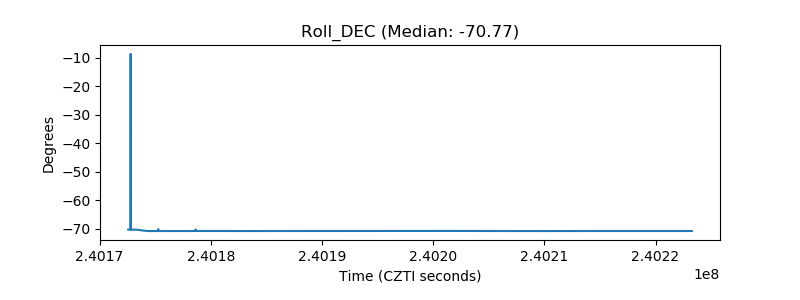 |
| _Roll_RA | 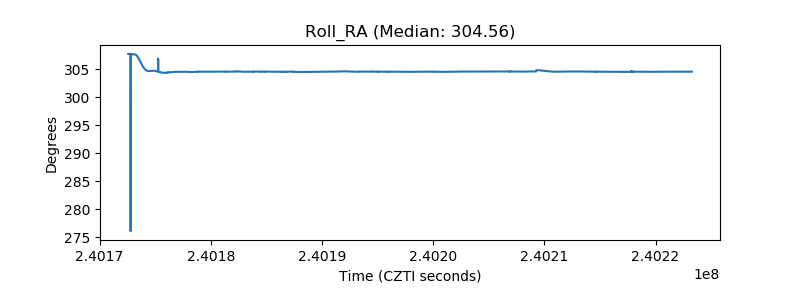 |
| Veto Counter | 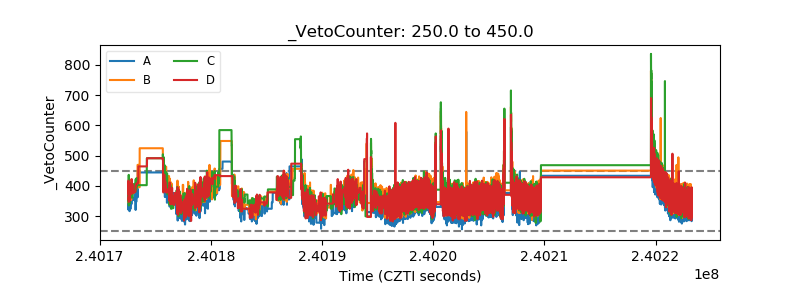 |