| Param | Original file | Final file |
|---|---|---|
| Filename | modeM0/AS1G07_013T01_9000001456_10120cztM0_level2.evt | modeM0/AS1G07_013T01_9000001456_10120cztM0_level2_quad_clean.evt |
| Size (bytes) | 492,120,000 | 125,939,520 |
| Size | 469.3 MB | 120.1 MB |
| Events in quadrant A | 3,080,767 | 841,268 |
| Events in quadrant B | 3,239,813 | 845,612 |
| Events in quadrant C | 2,977,456 | 855,521 |
| Events in quadrant D | 5,138,988 | 793,001 |
| Mode SS | |||
|---|---|---|---|
| Quadrant | BADHDUFLAG | Total packets | Discarded packets |
| A | 0 | 138 | 0 |
| B | 0 | 138 | 0 |
| C | 0 | 138 | 0 |
| D | 0 | 138 | 0 |
| Mode M9 | |||
|---|---|---|---|
| Quadrant | BADHDUFLAG | Total packets | Discarded packets |
| A | 0 | 11 | 0 |
| B | 0 | 11 | 0 |
| C | 0 | 11 | 0 |
| D | 0 | 12 | 0 |
| Mode M0 | |||
|---|---|---|---|
| Quadrant | BADHDUFLAG | Total packets | Discarded packets |
| A | 0 | 14128 | 22 |
| B | 0 | 14495 | 24 |
| C | 0 | 13966 | 19 |
| D | 0 | 19945 | 27 |
| Quadrant | Total seconds | Saturated seconds | Saturation percentage |
|---|---|---|---|
| A | 6879 | 19 | 0.276203% |
| B | 6877 | 34 | 0.494402% |
| C | 6880 | 11 | 0.159884% |
| D | 6880 | 344 | 5.000000% |
Noise dominated data is calculated using 1-second bins in cleaned event files. If a bin has >2000 counts, and if more than 50% of those come from <1% of pixels, then it is considered to be noise-dominated and hence unusable.
| Quadrant | # 1 sec bins | Bins with >0 counts | Bins with >2000 counts | High rate bins dominated by noise | Noise dominated (total time) | Noise dominated (detector-on time) | Marked lightcurve |
|---|---|---|---|---|---|---|---|
| A | 7658 | 6889 | 2 | 2 | 0.03% | 0.03% | 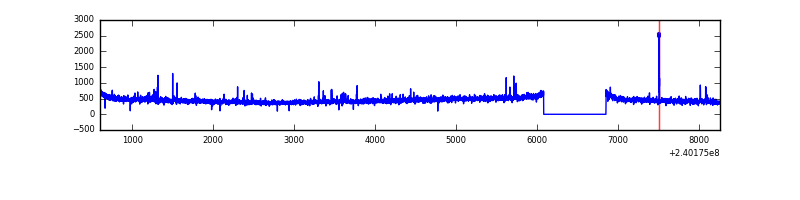 |
| B | 7658 | 6889 | 1 | 1 | 0.01% | 0.01% | 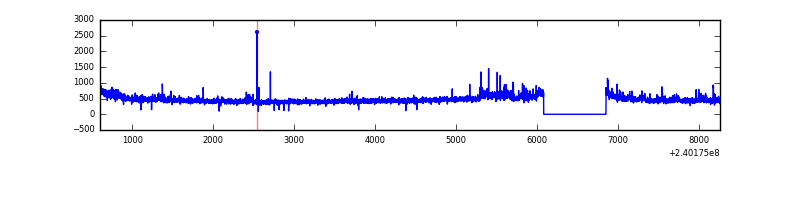 |
| C | 7658 | 6889 | 0 | 0 | 0.00% | 0.00% | 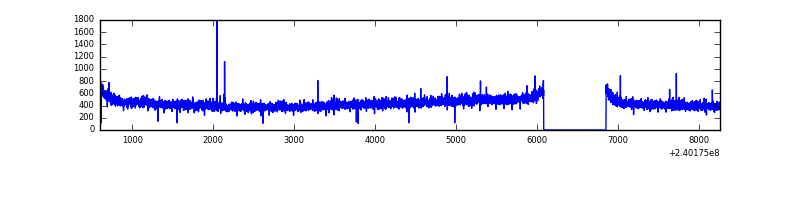 |
| D | 7658 | 6889 | 247 | 247 | 3.23% | 3.59% | 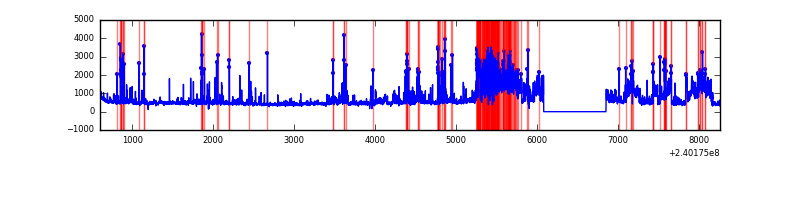 |
Top three noisy pixels from each quadrant. If the there are fewer than three noisy pixels in the level2.evt file, extra rows are filled as -1
| Pixel properties | Quadrant properties | ||||||
|---|---|---|---|---|---|---|---|
| Quadrant | DetID | PixID | Counts | Sigma | Mean | Median | Sigma |
| A | 8 | 5 | 50054 | 312.15 | 779 | 762 | 157.9 |
| A | 15 | 174 | 15688 | 94.52 | 779 | 762 | 157.9 |
| A | 8 | 15 | 15189 | 91.36 | 779 | 762 | 157.9 |
| B | 0 | 214 | 58939 | 393.25 | 782 | 763 | 147.9 |
| B | 0 | 219 | 34286 | 226.6 | 782 | 763 | 147.9 |
| B | 0 | 189 | 31068 | 204.85 | 782 | 763 | 147.9 |
| C | 14 | 67 | 7287 | 37.48 | 759 | 763 | 174.1 |
| C | 13 | 61 | 5809 | 28.99 | 759 | 763 | 174.1 |
| C | 14 | 234 | 5085 | 24.83 | 759 | 763 | 174.1 |
| D | 1 | 52 | 1255058 | 7063.74 | 739 | 718 | 177.6 |
| D | 8 | 195 | 291936 | 1639.98 | 739 | 718 | 177.6 |
| D | 12 | 233 | 229561 | 1288.72 | 739 | 718 | 177.6 |
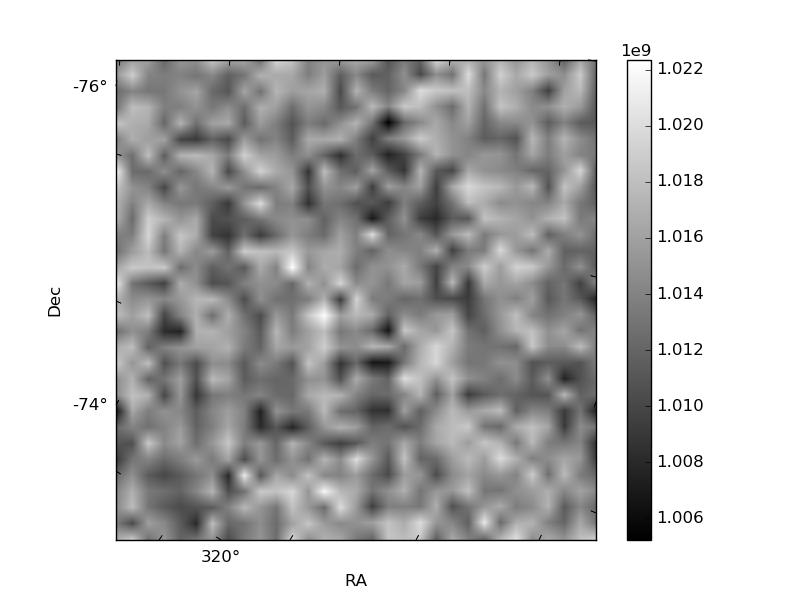
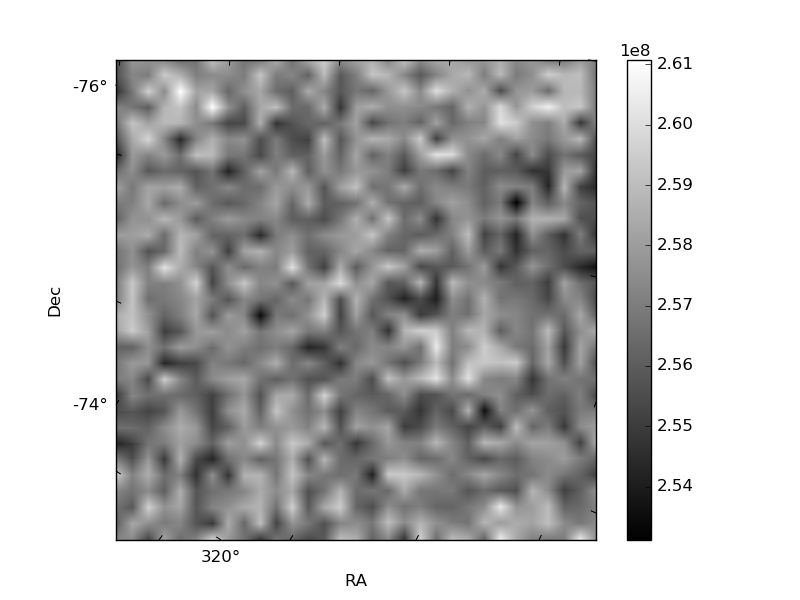
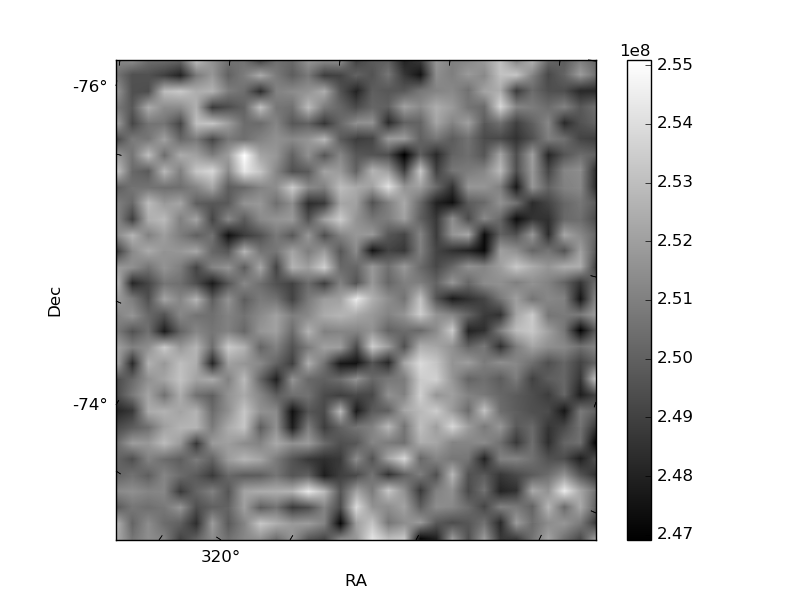
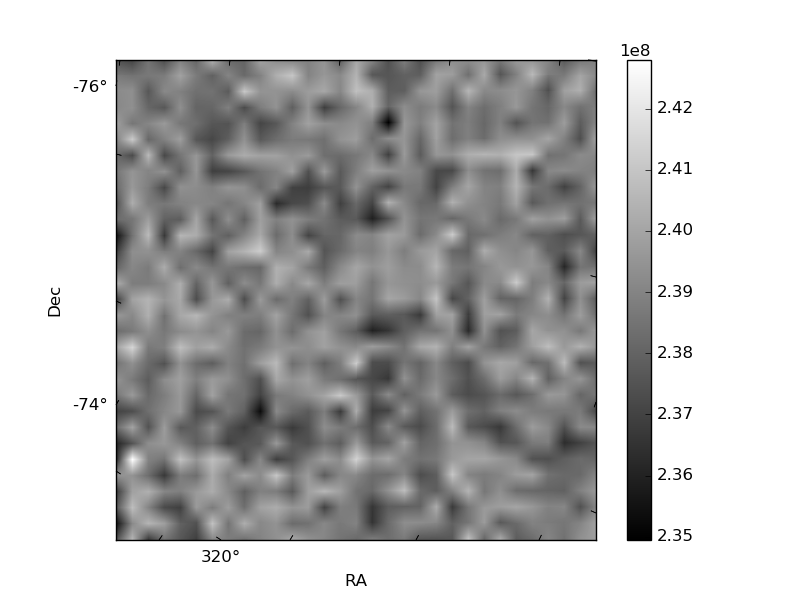
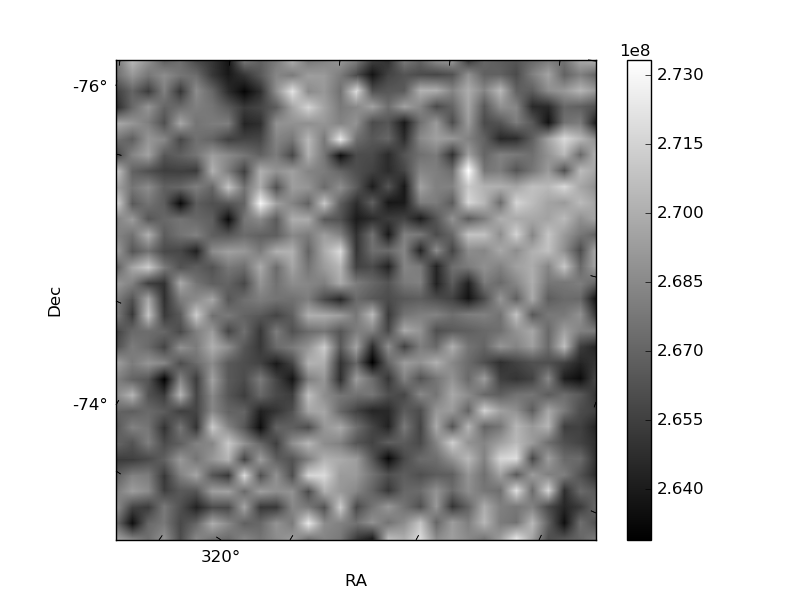
Histogram calculated using DETX and DETY for each event in the final _common_clean file
| Quadrant A | 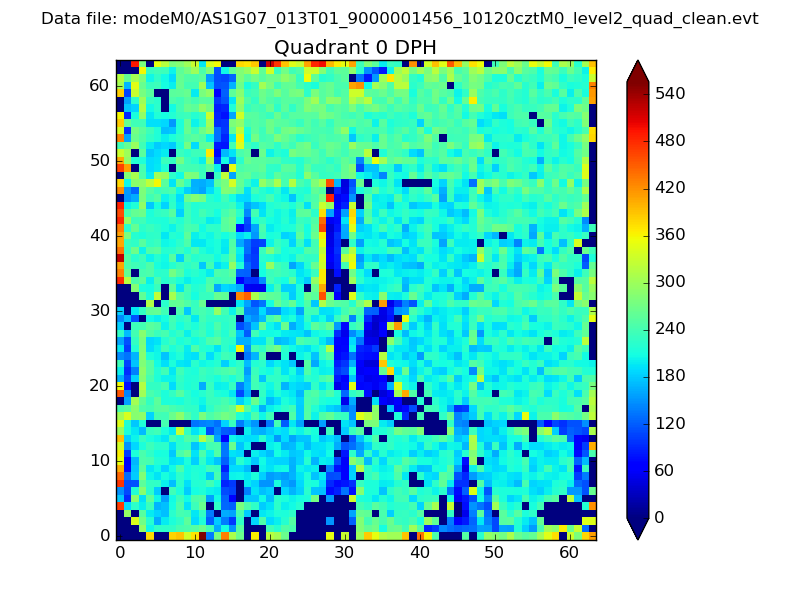 |
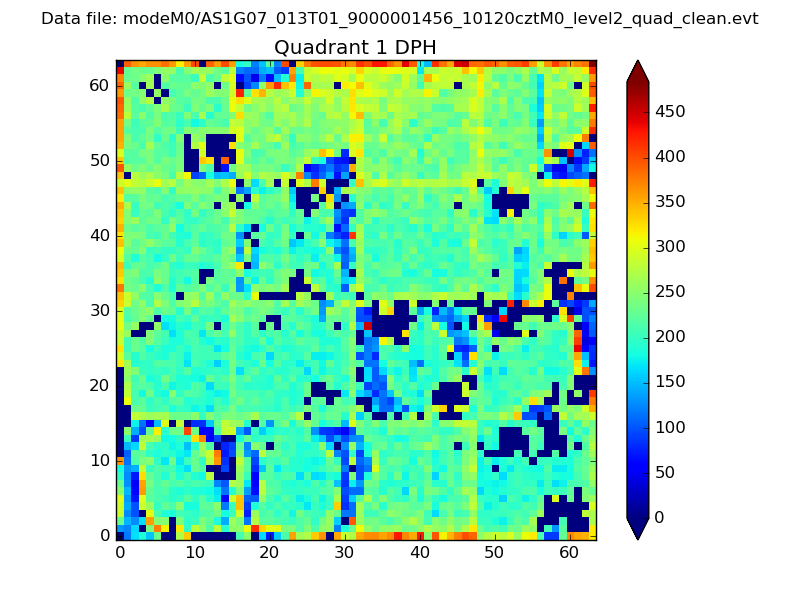 |
Quadrant B |
|---|---|---|---|
| Quadrant D | 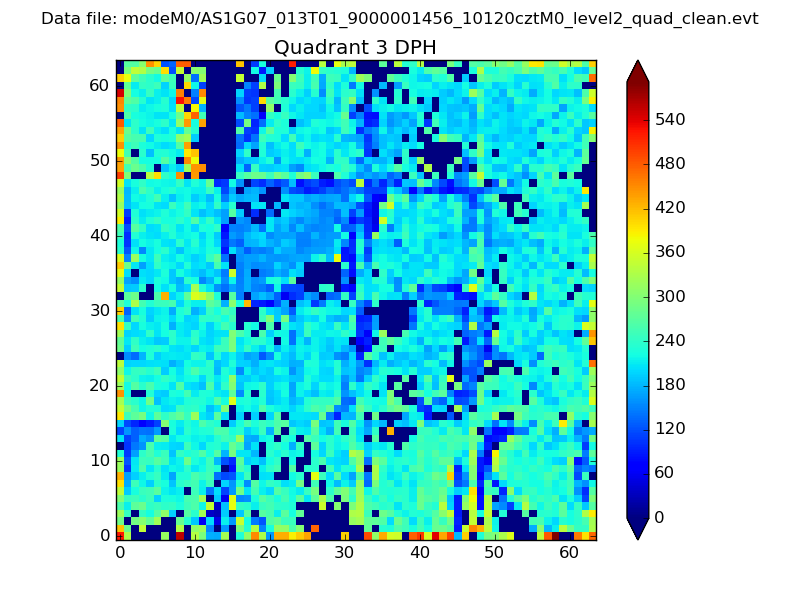 |
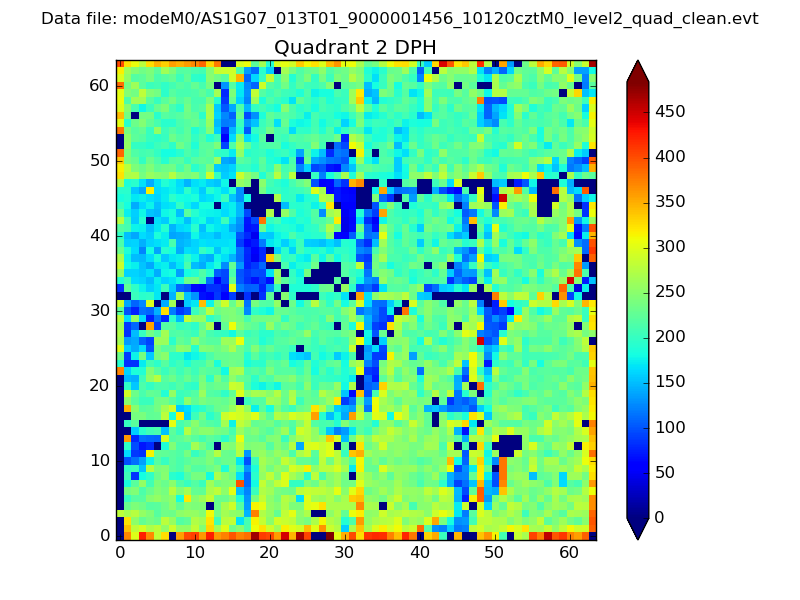 |
Quadrant C |
| Plot type | Count rate plots | Images |
|---|---|---|
| Comparison with Poisson distribution Blue bars denote a histogram of data divided into 1 sec bins. Red curve is a Poisson curve with rate = median count rate of data. |
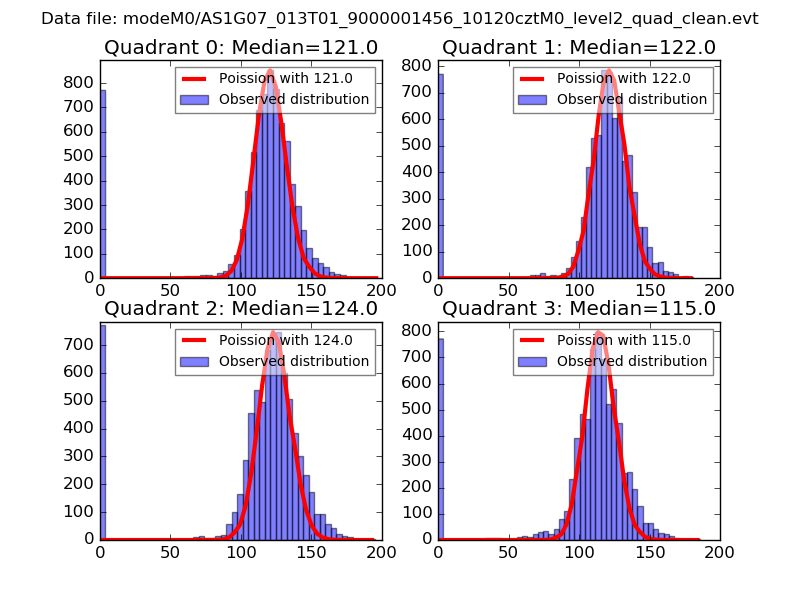 |
 |
| Quadrant-wise count rates Data is divided into 100 sec bins |
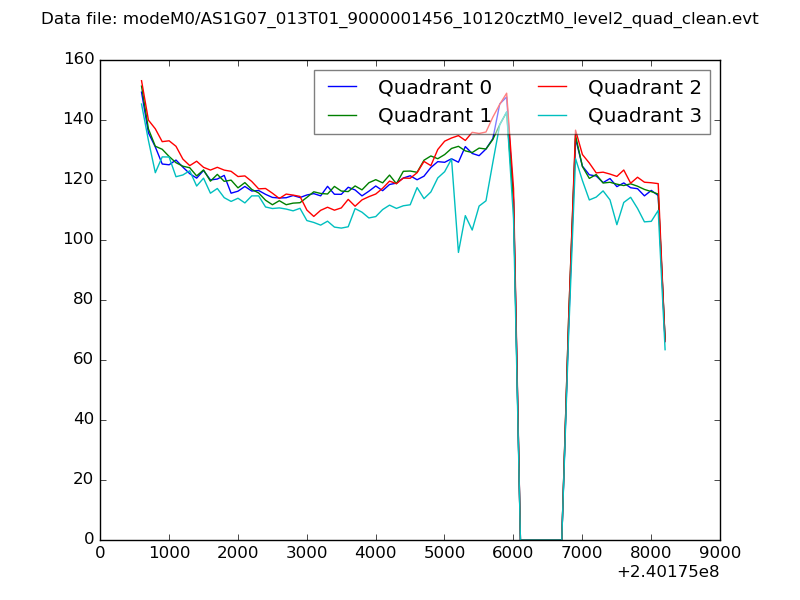 |
|
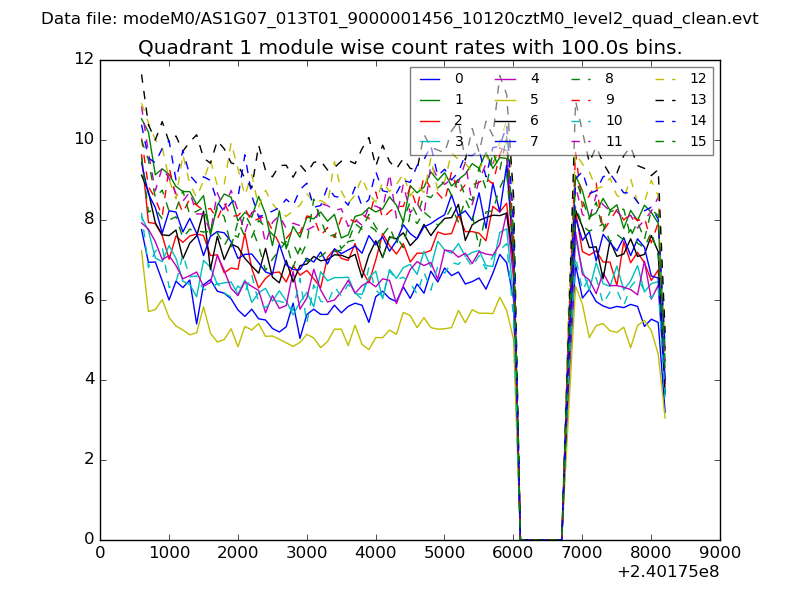
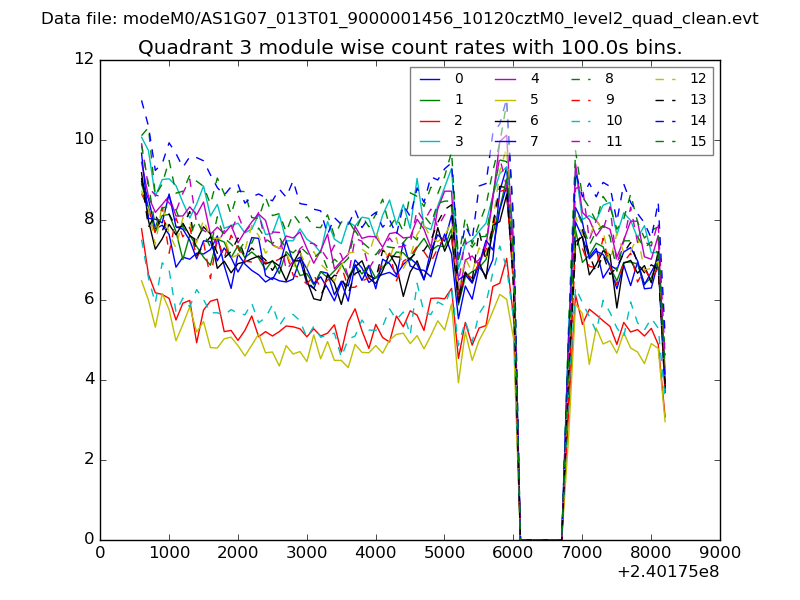
| Module-wise count rates for Quadrant A Data is divided into 100 sec bins |
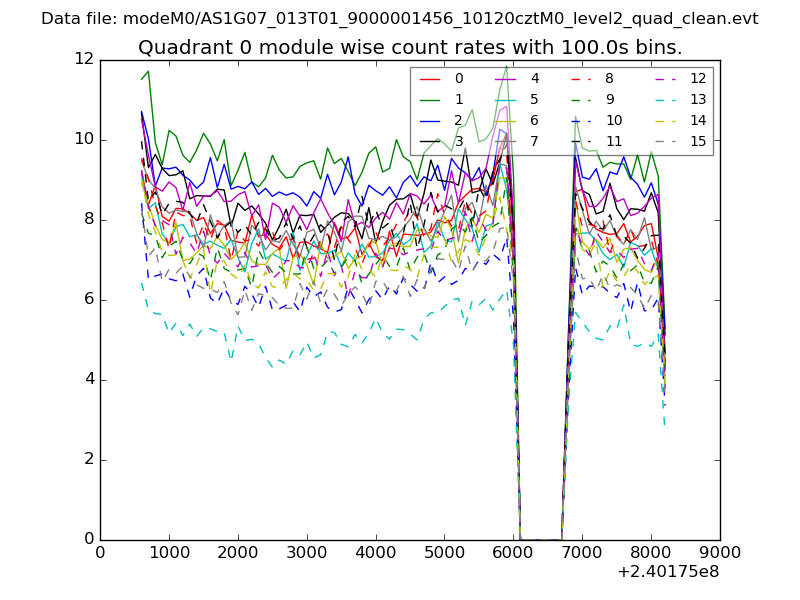 |
 |
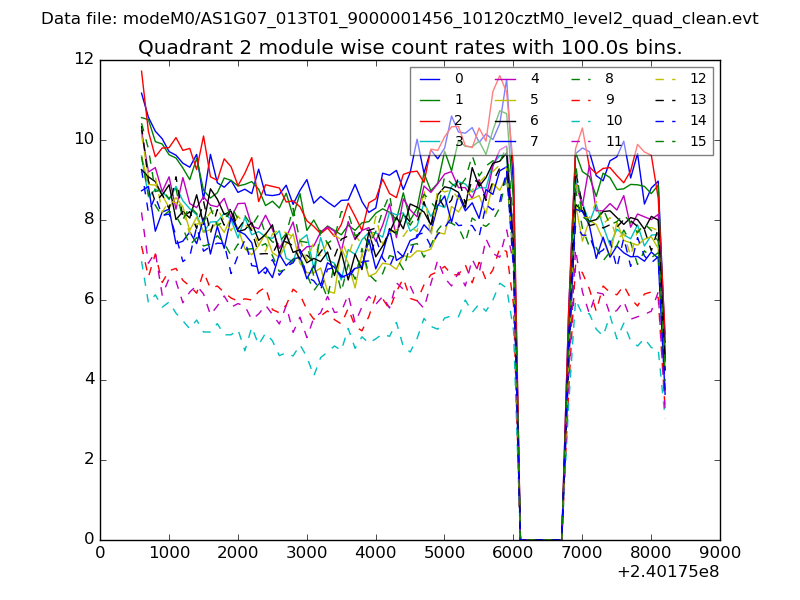
| Module-wise count rates for Quadrant B Data is divided into 100 sec bins |
 |
 |
| Module-wise count rates for Quadrant C Data is divided into 100 sec bins |
 |
 |
| Module-wise count rates for Quadrant D Data is divided into 100 sec bins |
 |
 |
| Parameter | Plot |
|---|---|
| CZT HV Monitor | 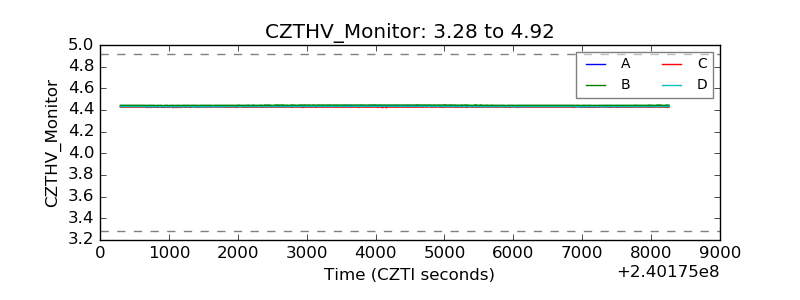 |
| D_VDD | 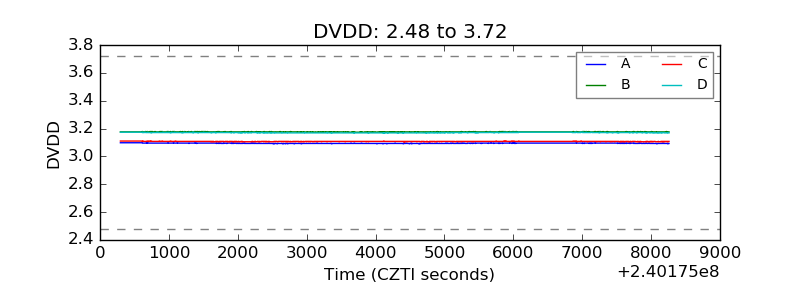 |
| Temperature 1 | 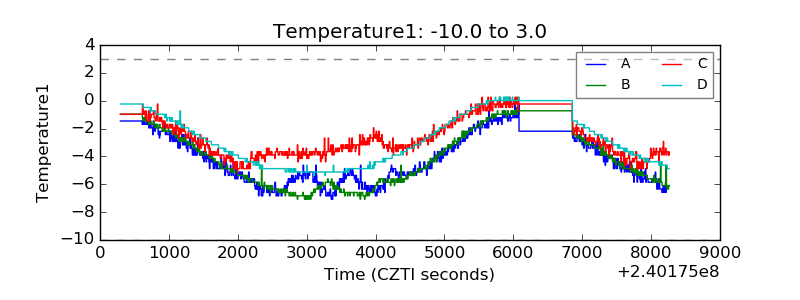 |
| Veto HV Monitor | 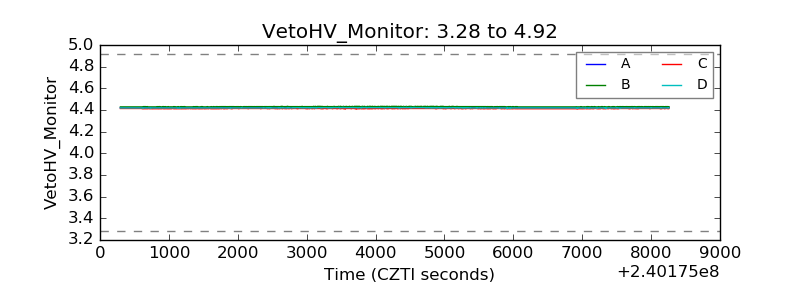 |
| Veto LLD | 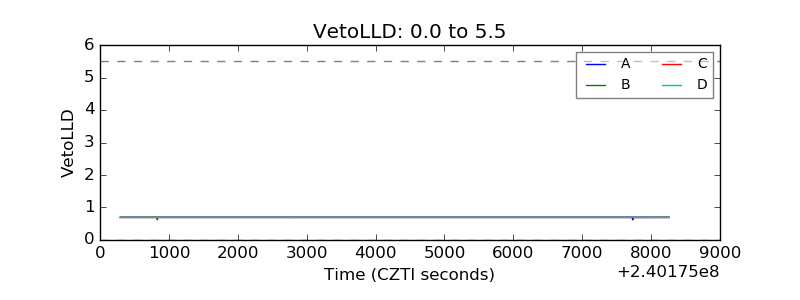 |
| Alpha Counter | 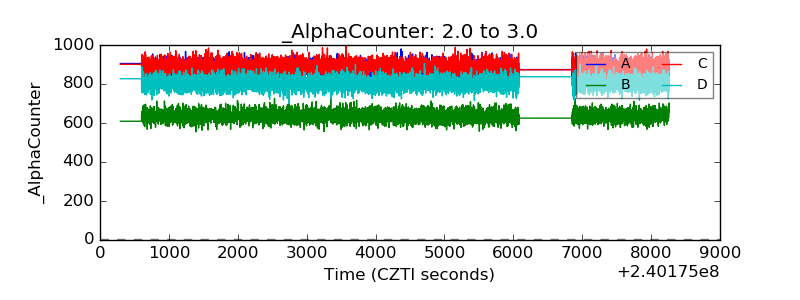 |
| _CPM_Rate | 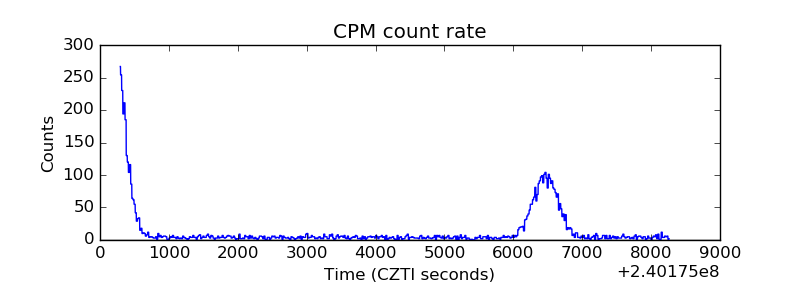 |
| CZT Counter | 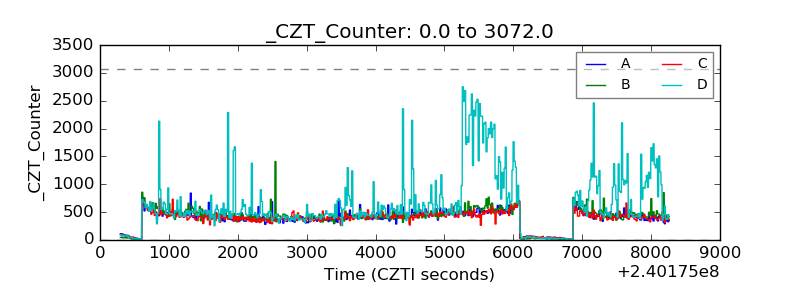 |
| +2.5 Volts monitor |  |
| +5 Volts monitor |  |
| _ROLL_ROT | 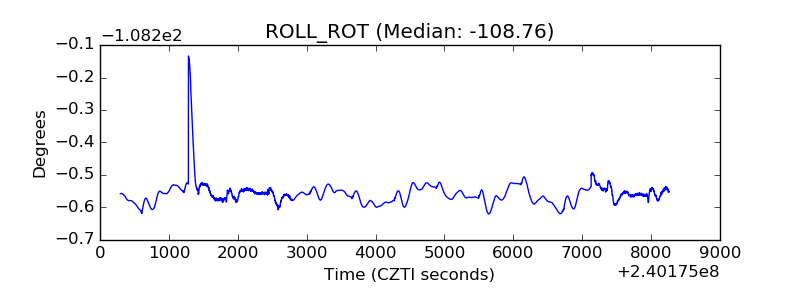 |
| _Roll_DEC |  |
| _Roll_RA | 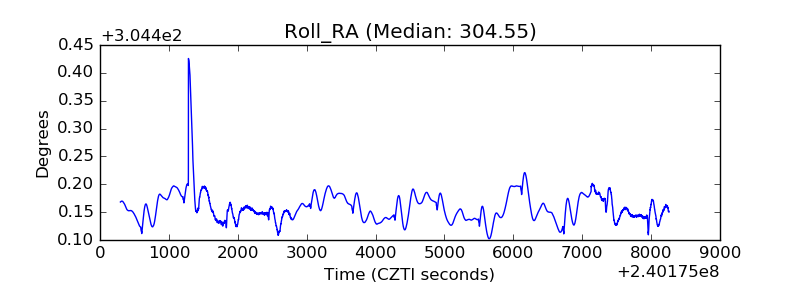 |
| Veto Counter | 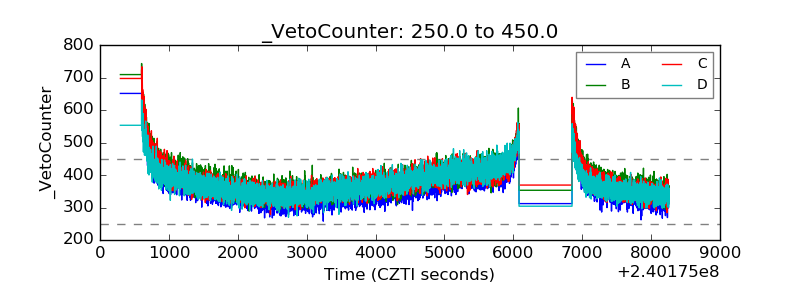 |