| Param | Original file | Final file |
|---|---|---|
| Filename | modeM0/AS1G07_013T01_9000001456_10123cztM0_level2.evt | modeM0/AS1G07_013T01_9000001456_10123cztM0_level2_quad_clean.evt |
| Size (bytes) | 150,796,800 | 42,082,560 |
| Size | 143.8 MB | 40.1 MB |
| Events in quadrant A | 1,058,660 | 285,380 |
| Events in quadrant B | 1,110,155 | 286,089 |
| Events in quadrant C | 1,045,476 | 287,531 |
| Events in quadrant D | 1,187,660 | 243,311 |
| Mode SS | |||
|---|---|---|---|
| Quadrant | BADHDUFLAG | Total packets | Discarded packets |
| A | 0 | 170 | 120 |
| B | 0 | 170 | 124 |
| C | 0 | 167 | 125 |
| D | 0 | 168 | 120 |
| Mode M9 | |||
|---|---|---|---|
| Quadrant | BADHDUFLAG | Total packets | Discarded packets |
| A | 0 | 8 | 5 |
| B | 0 | 8 | 4 |
| C | 0 | 8 | 4 |
| D | 0 | 8 | 4 |
| Mode M0 | |||
|---|---|---|---|
| Quadrant | BADHDUFLAG | Total packets | Discarded packets |
| A | 0 | 16837 | 11923 |
| B | 0 | 17314 | 12358 |
| C | 0 | 16722 | 11818 |
| D | 0 | 20973 | 15929 |
| Quadrant | Total seconds | Saturated seconds | Saturation percentage |
|---|---|---|---|
| A | 2426 | 27 | 1.112943% |
| B | 2414 | 37 | 1.532726% |
| C | 2430 | 19 | 0.781893% |
| D | 2162 | 51 | 2.358927% |
Noise dominated data is calculated using 1-second bins in cleaned event files. If a bin has >2000 counts, and if more than 50% of those come from <1% of pixels, then it is considered to be noise-dominated and hence unusable.
| Quadrant | # 1 sec bins | Bins with >0 counts | Bins with >2000 counts | High rate bins dominated by noise | Noise dominated (total time) | Noise dominated (detector-on time) | Marked lightcurve |
|---|---|---|---|---|---|---|---|
| A | 9117 | 3720 | 0 | 0 | 0.00% | 0.00% | 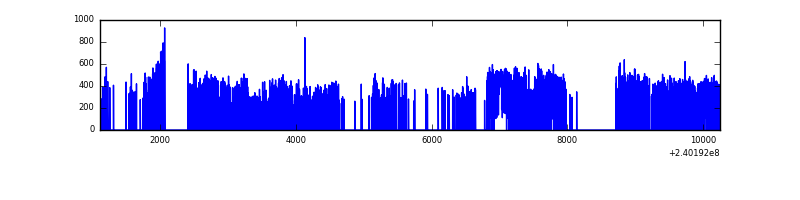 |
| B | 9087 | 3736 | 0 | 0 | 0.00% | 0.00% | 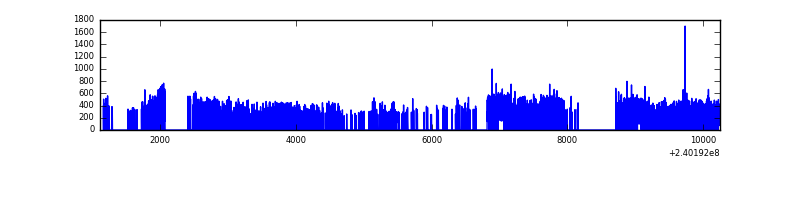 |
| C | 9138 | 3722 | 0 | 0 | 0.00% | 0.00% | 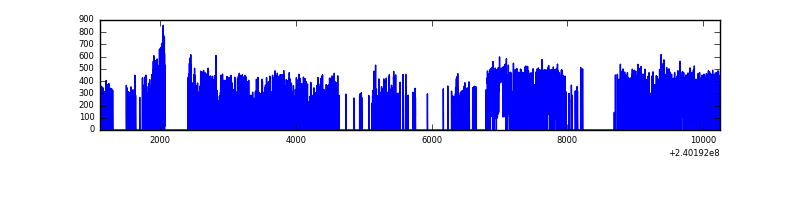 |
| D | 9118 | 3416 | 22 | 22 | 0.24% | 0.64% | 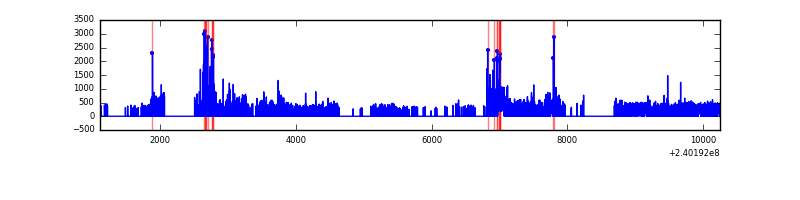 |
Top three noisy pixels from each quadrant. If the there are fewer than three noisy pixels in the level2.evt file, extra rows are filled as -1
| Pixel properties | Quadrant properties | ||||||
|---|---|---|---|---|---|---|---|
| Quadrant | DetID | PixID | Counts | Sigma | Mean | Median | Sigma |
| A | 8 | 15 | 4743 | 77.68 | 271 | 264 | 57.7 |
| A | 13 | 253 | 3520 | 56.47 | 271 | 264 | 57.7 |
| A | 15 | 174 | 3431 | 54.93 | 271 | 264 | 57.7 |
| B | 0 | 198 | 10460 | 188.08 | 273 | 266 | 54.2 |
| B | 0 | 219 | 10113 | 181.68 | 273 | 266 | 54.2 |
| B | 12 | 111 | 5465 | 95.92 | 273 | 266 | 54.2 |
| C | 14 | 67 | 3705 | 54.76 | 266 | 267 | 62.8 |
| C | 13 | 61 | 1967 | 27.08 | 266 | 267 | 62.8 |
| C | 8 | 128 | 1875 | 25.61 | 266 | 267 | 62.8 |
| D | 1 | 52 | 115942 | 2022.2 | 232 | 225 | 57.2 |
| D | 8 | 195 | 42035 | 730.65 | 232 | 225 | 57.2 |
| D | 2 | 136 | 40990 | 712.39 | 232 | 225 | 57.2 |
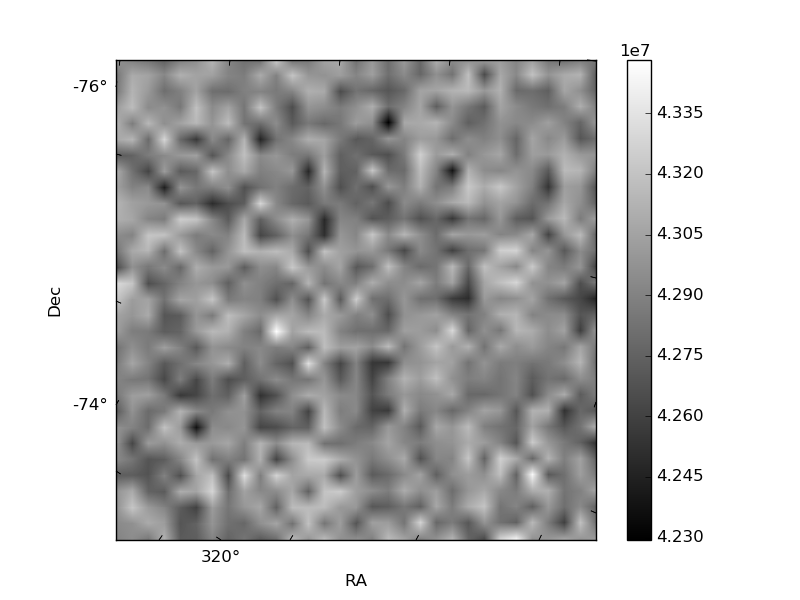
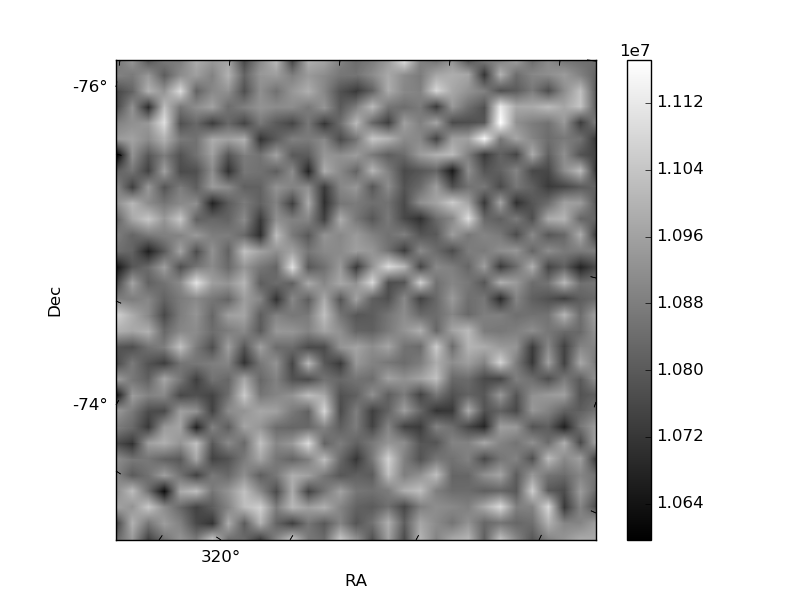
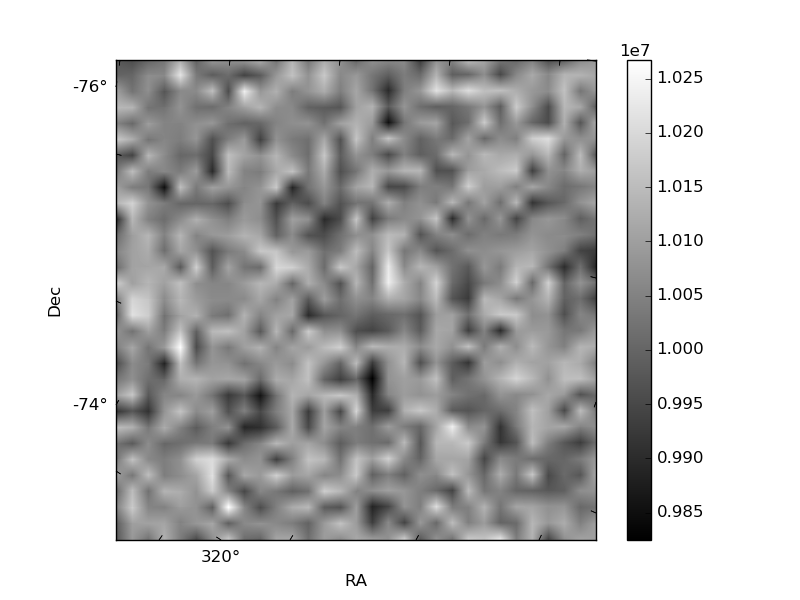
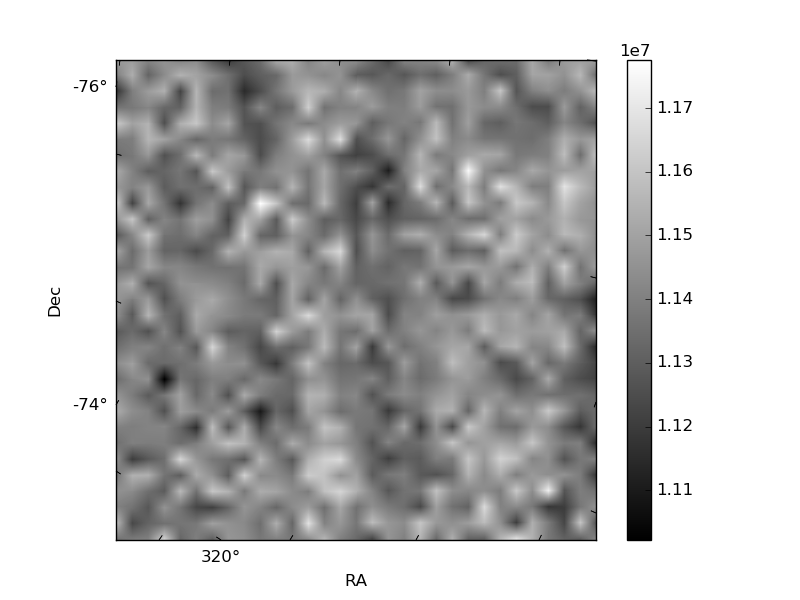
Histogram calculated using DETX and DETY for each event in the final _common_clean file
| Quadrant A | 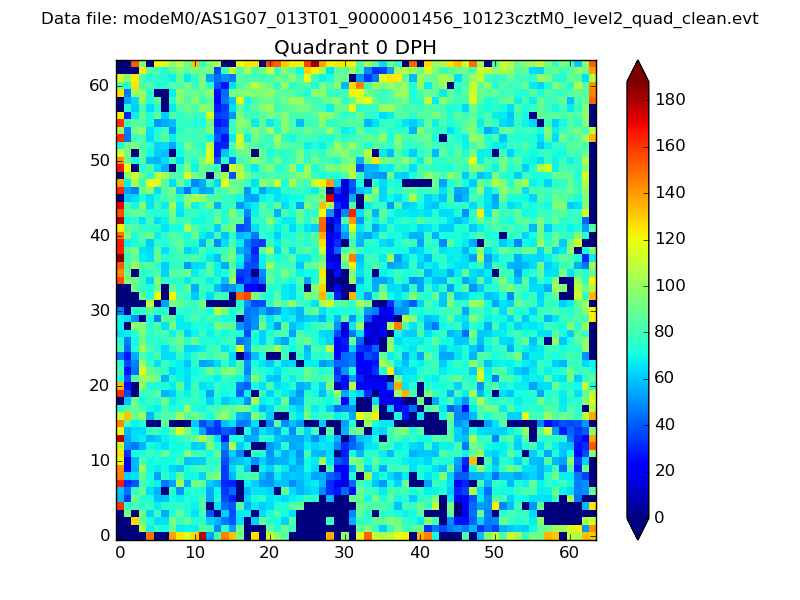 |
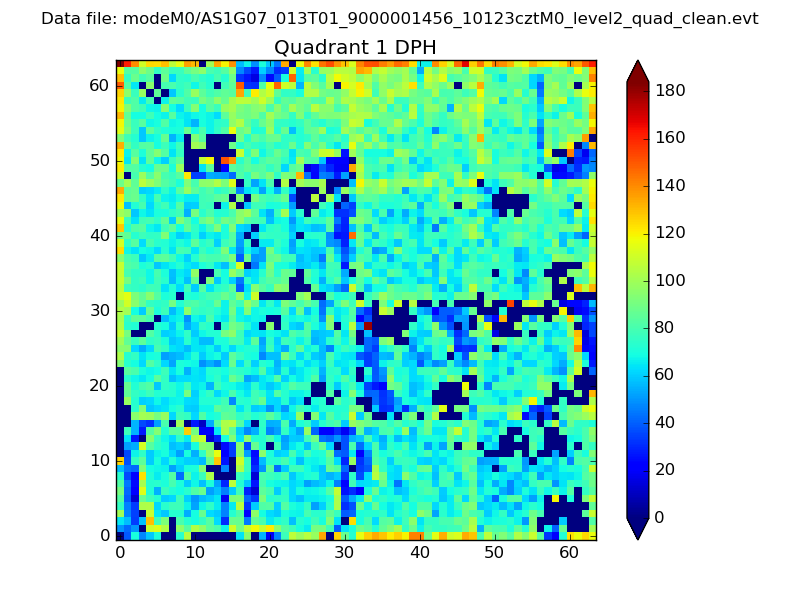 |
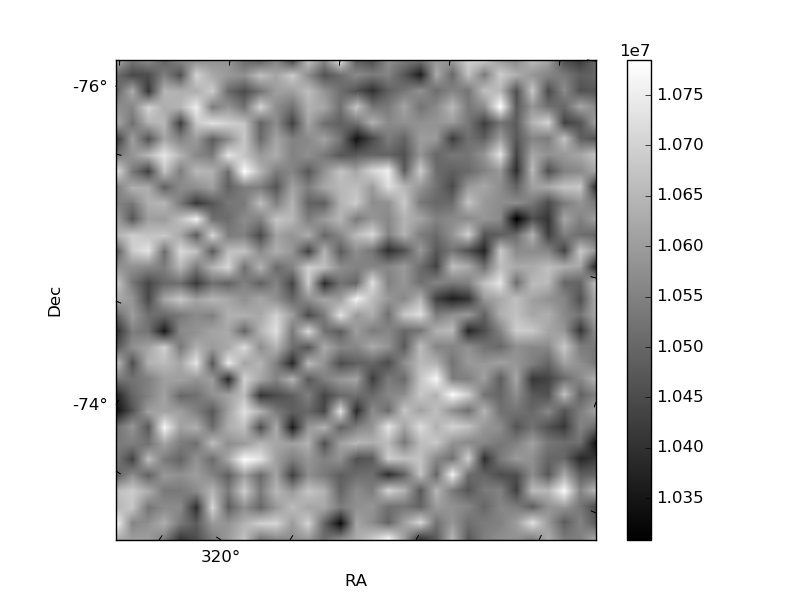
Quadrant B |
|---|---|---|---|
| Quadrant D | 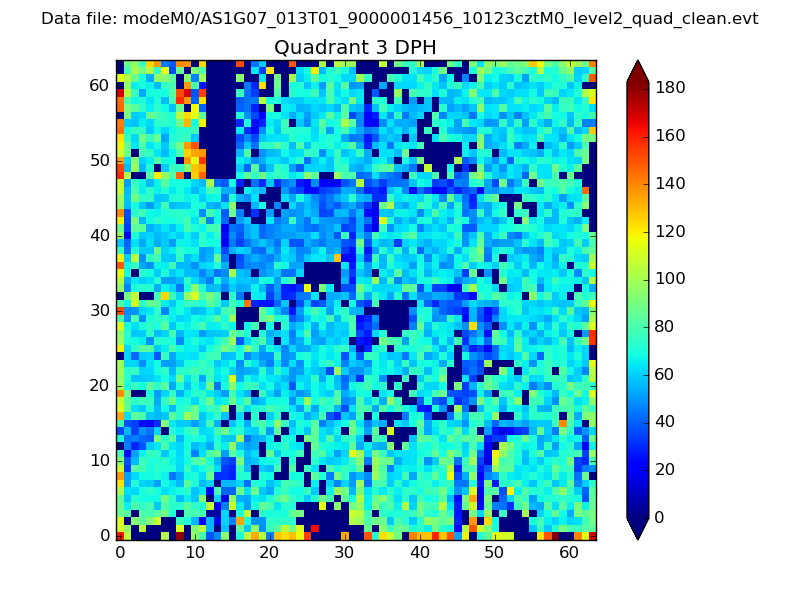 |
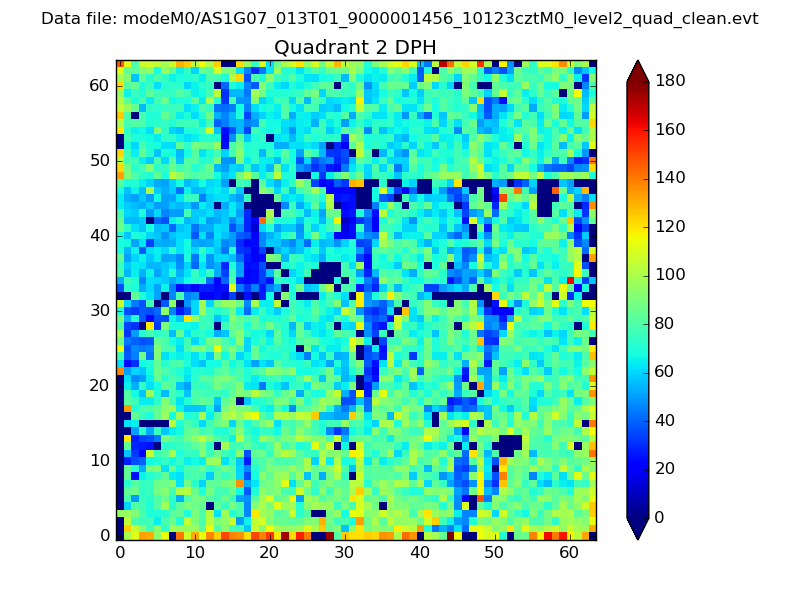 |
Quadrant C |
| Plot type | Count rate plots | Images |
|---|---|---|
| Comparison with Poisson distribution Blue bars denote a histogram of data divided into 1 sec bins. Red curve is a Poisson curve with rate = median count rate of data. |
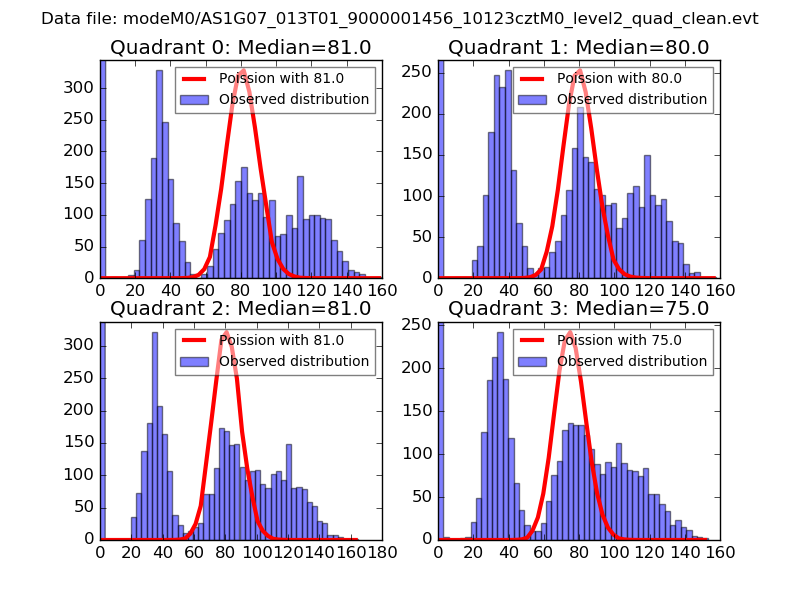 |
 |
| Quadrant-wise count rates Data is divided into 100 sec bins |
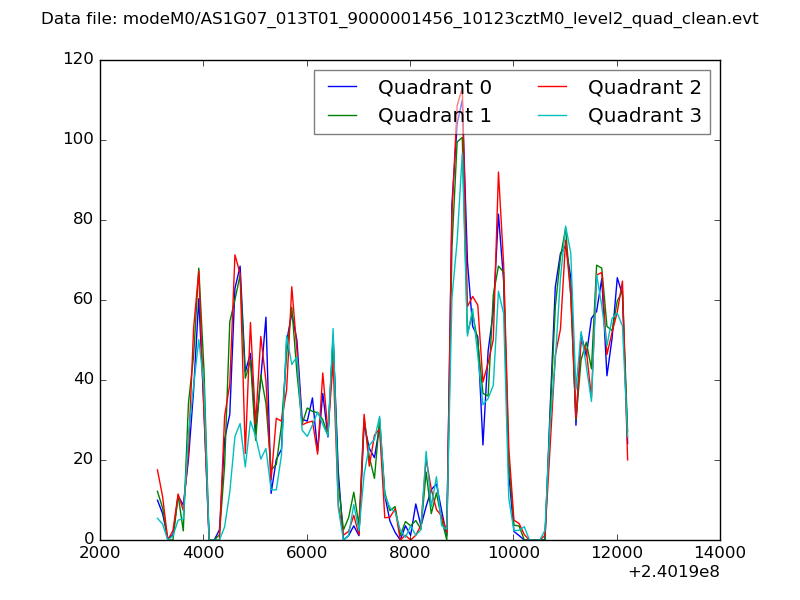 |
|
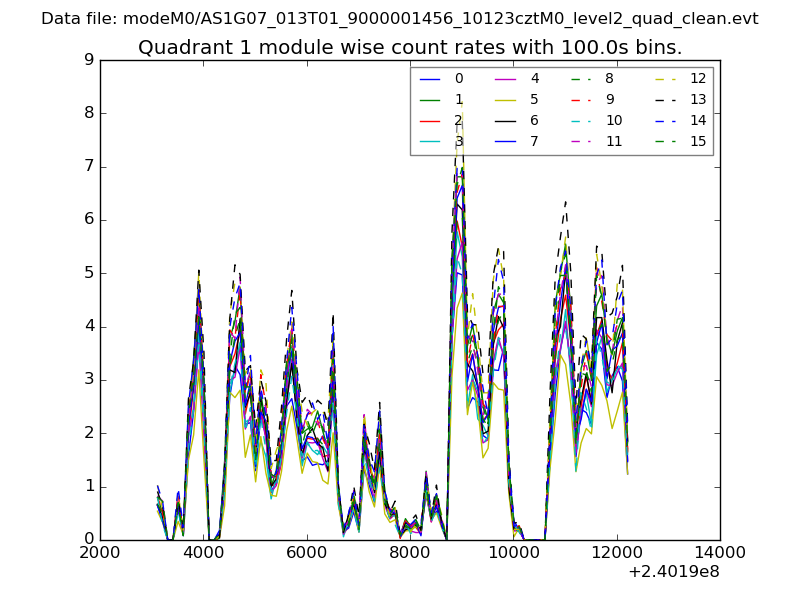
| Module-wise count rates for Quadrant A Data is divided into 100 sec bins |
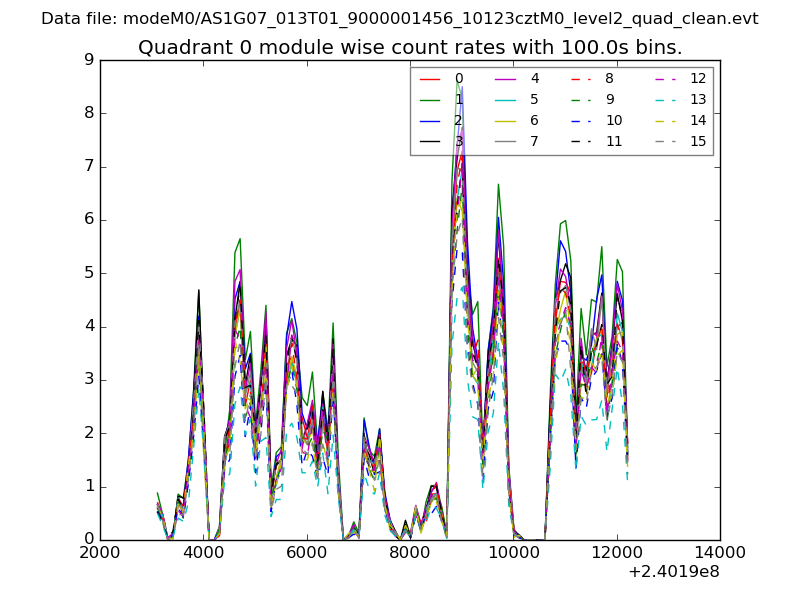 |
 |
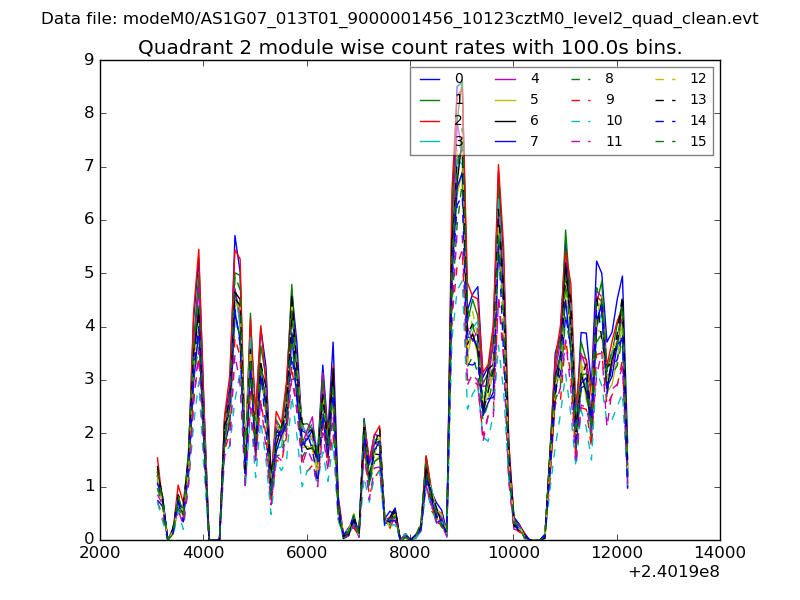
| Module-wise count rates for Quadrant B Data is divided into 100 sec bins |
 |
 |
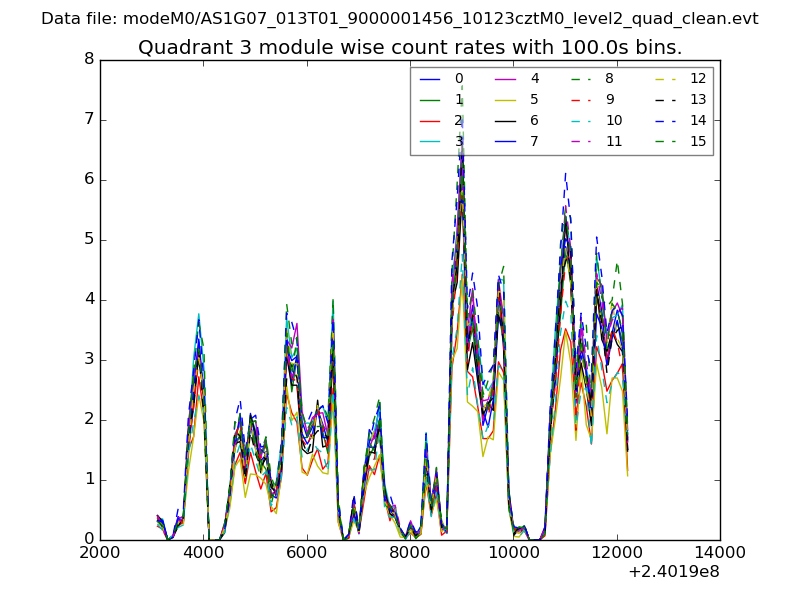
| Module-wise count rates for Quadrant C Data is divided into 100 sec bins |
 |
 |
| Module-wise count rates for Quadrant D Data is divided into 100 sec bins |
 |
 |
| Parameter | Plot |
|---|---|
| CZT HV Monitor | 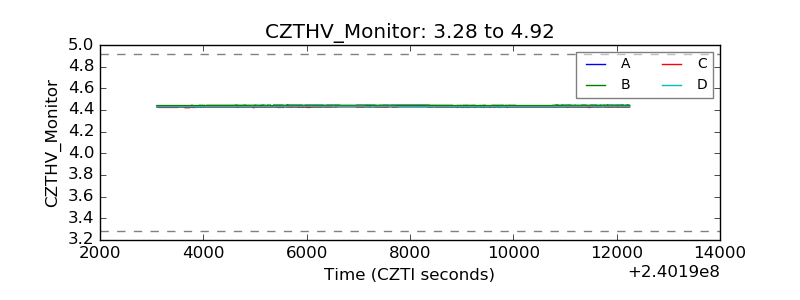 |
| D_VDD | 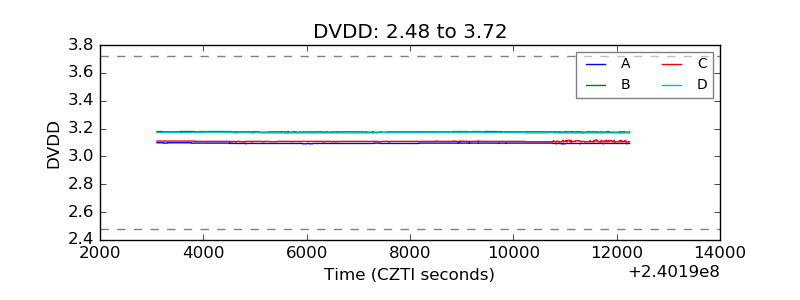 |
| Temperature 1 | 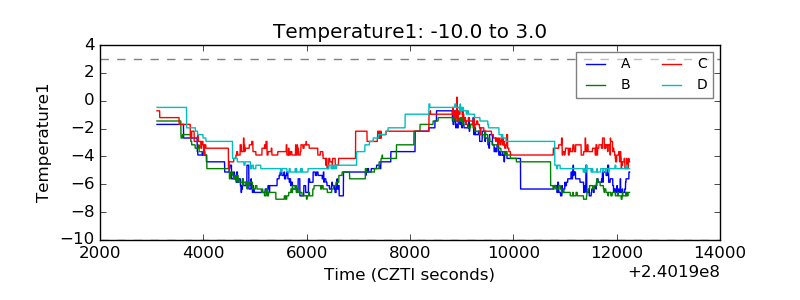 |
| Veto HV Monitor |  |
| Veto LLD | 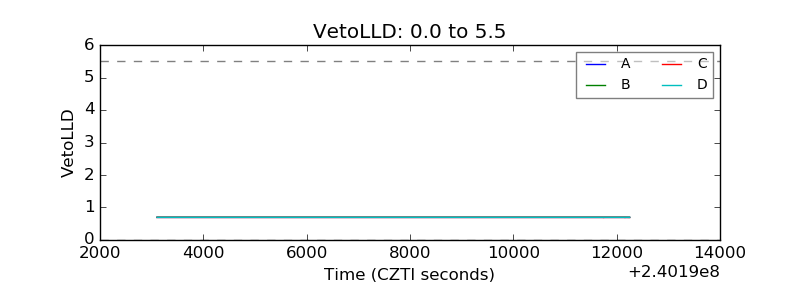 |
| Alpha Counter | 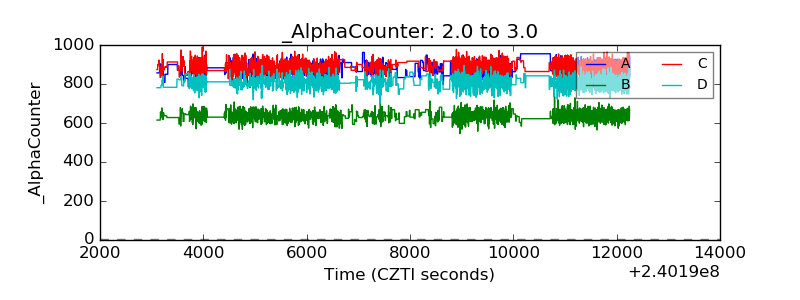 |
| _CPM_Rate | 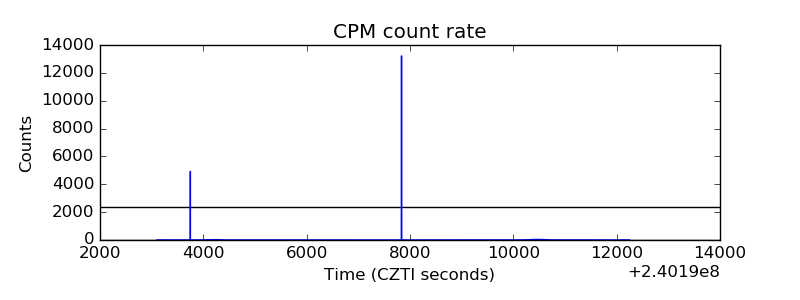 |
| CZT Counter | 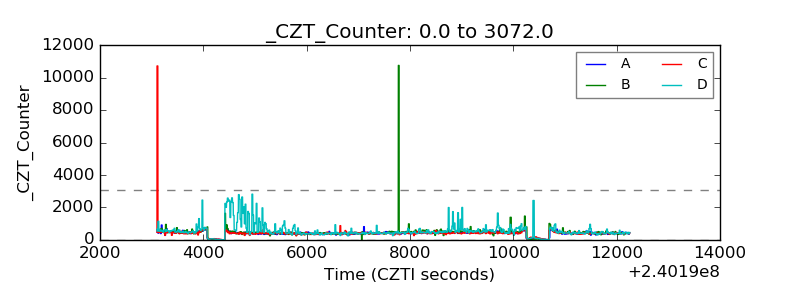 |
| +2.5 Volts monitor |  |
| +5 Volts monitor |  |
| _ROLL_ROT | 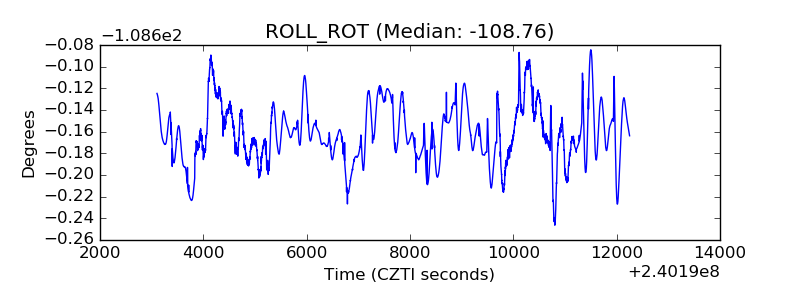 |
| _Roll_DEC | 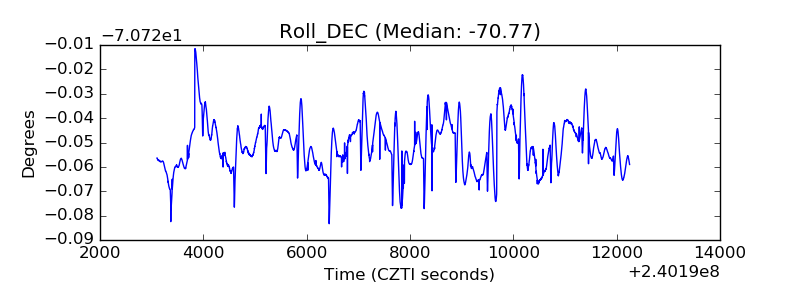 |
| _Roll_RA | 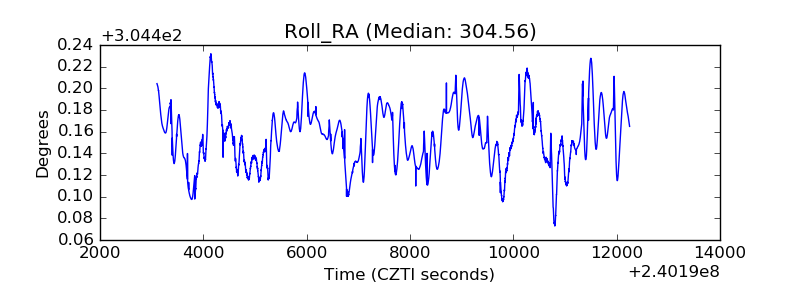 |
| Veto Counter | 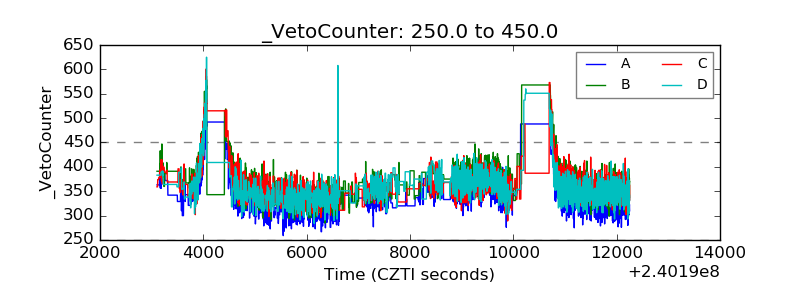 |