| Param | Original file | Final file |
|---|---|---|
| Filename | modeM0/AS1G07_013T01_9000001456_10125cztM0_level2.evt | modeM0/AS1G07_013T01_9000001456_10125cztM0_level2_quad_clean.evt |
| Size (bytes) | 505,696,320 | 135,095,040 |
| Size | 482.3 MB | 128.8 MB |
| Events in quadrant A | 3,417,556 | 895,114 |
| Events in quadrant B | 3,707,424 | 900,353 |
| Events in quadrant C | 3,352,108 | 908,149 |
| Events in quadrant D | 4,318,445 | 856,716 |
| Mode SS | |||
|---|---|---|---|
| Quadrant | BADHDUFLAG | Total packets | Discarded packets |
| A | 0 | 166 | 16 |
| B | 0 | 166 | 8 |
| C | 0 | 166 | 10 |
| D | 0 | 166 | 2 |
| Mode M9 | |||
|---|---|---|---|
| Quadrant | BADHDUFLAG | Total packets | Discarded packets |
| A | 0 | 10 | 0 |
| B | 0 | 10 | 0 |
| C | 0 | 10 | 1 |
| D | 0 | 10 | 0 |
| Mode M0 | |||
|---|---|---|---|
| Quadrant | BADHDUFLAG | Total packets | Discarded packets |
| A | 0 | 16494 | 863 |
| B | 0 | 17104 | 948 |
| C | 0 | 16373 | 872 |
| D | 0 | 19039 | 1203 |
| Quadrant | Total seconds | Saturated seconds | Saturation percentage |
|---|---|---|---|
| A | 7656 | 63 | 0.822884% |
| B | 7620 | 111 | 1.456693% |
| C | 7641 | 48 | 0.628190% |
| D | 7596 | 129 | 1.698262% |
Noise dominated data is calculated using 1-second bins in cleaned event files. If a bin has >2000 counts, and if more than 50% of those come from <1% of pixels, then it is considered to be noise-dominated and hence unusable.
| Quadrant | # 1 sec bins | Bins with >0 counts | Bins with >2000 counts | High rate bins dominated by noise | Noise dominated (total time) | Noise dominated (detector-on time) | Marked lightcurve |
|---|---|---|---|---|---|---|---|
| A | 9111 | 8016 | 0 | 0 | 0.00% | 0.00% | 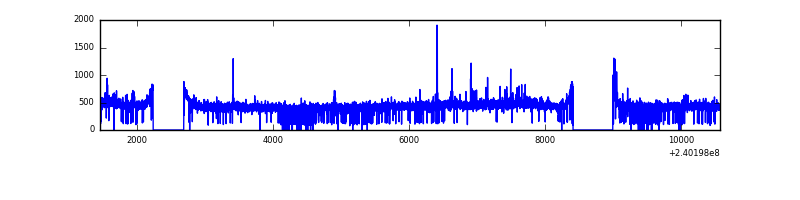 |
| B | 9111 | 8005 | 9 | 9 | 0.10% | 0.11% |  |
| C | 9111 | 7983 | 0 | 0 | 0.00% | 0.00% | 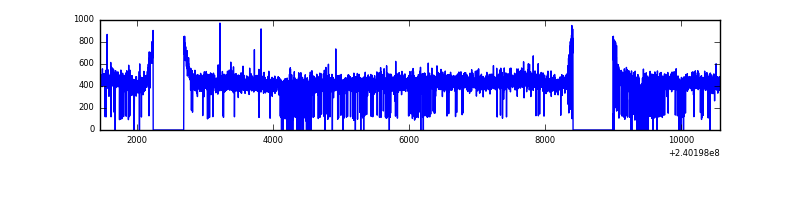 |
| D | 9111 | 7989 | 70 | 70 | 0.77% | 0.88% | 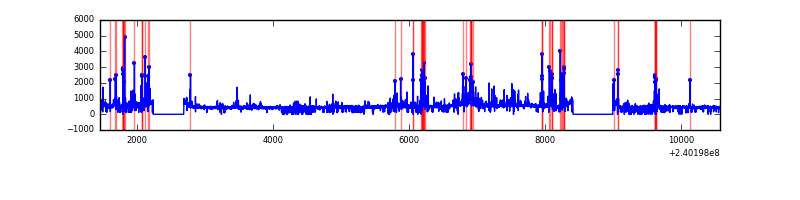 |
Top three noisy pixels from each quadrant. If the there are fewer than three noisy pixels in the level2.evt file, extra rows are filled as -1
| Pixel properties | Quadrant properties | ||||||
|---|---|---|---|---|---|---|---|
| Quadrant | DetID | PixID | Counts | Sigma | Mean | Median | Sigma |
| A | 3 | 1 | 26349 | 144.08 | 870 | 849 | 177.0 |
| A | 8 | 15 | 21996 | 119.48 | 870 | 849 | 177.0 |
| A | 15 | 174 | 10650 | 55.38 | 870 | 849 | 177.0 |
| B | 0 | 189 | 83397 | 504.14 | 873 | 852 | 163.7 |
| B | 4 | 239 | 49680 | 298.21 | 873 | 852 | 163.7 |
| B | 0 | 214 | 47318 | 283.79 | 873 | 852 | 163.7 |
| C | 14 | 67 | 10080 | 46.89 | 852 | 854 | 196.8 |
| C | 8 | 128 | 10026 | 46.61 | 852 | 854 | 196.8 |
| C | 13 | 61 | 6391 | 28.14 | 852 | 854 | 196.8 |
| D | 8 | 195 | 342377 | 1702.6 | 835 | 809 | 200.6 |
| D | 2 | 136 | 172307 | 854.86 | 835 | 809 | 200.6 |
| D | 7 | 71 | 126696 | 627.5 | 835 | 809 | 200.6 |
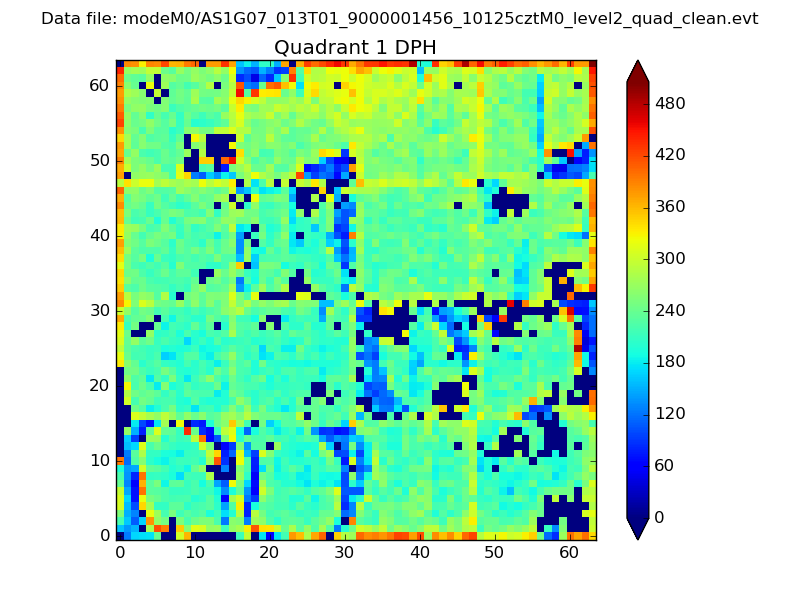
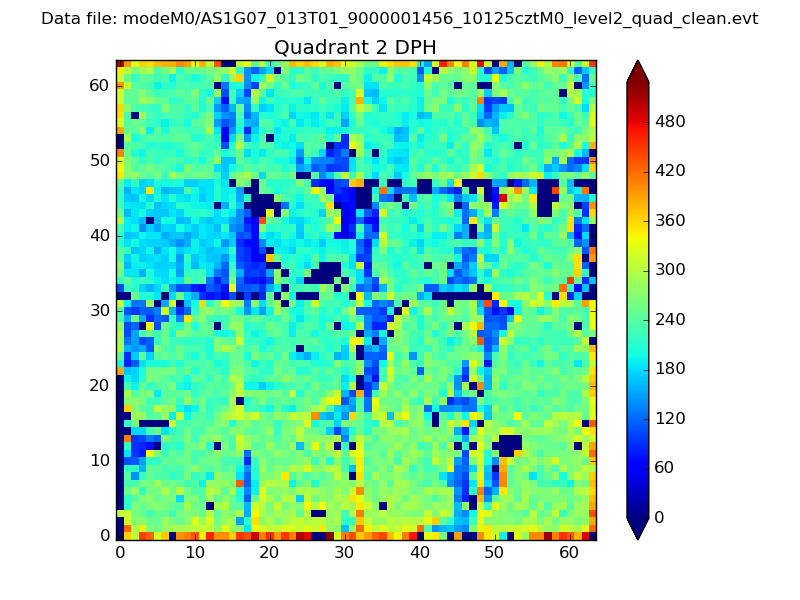
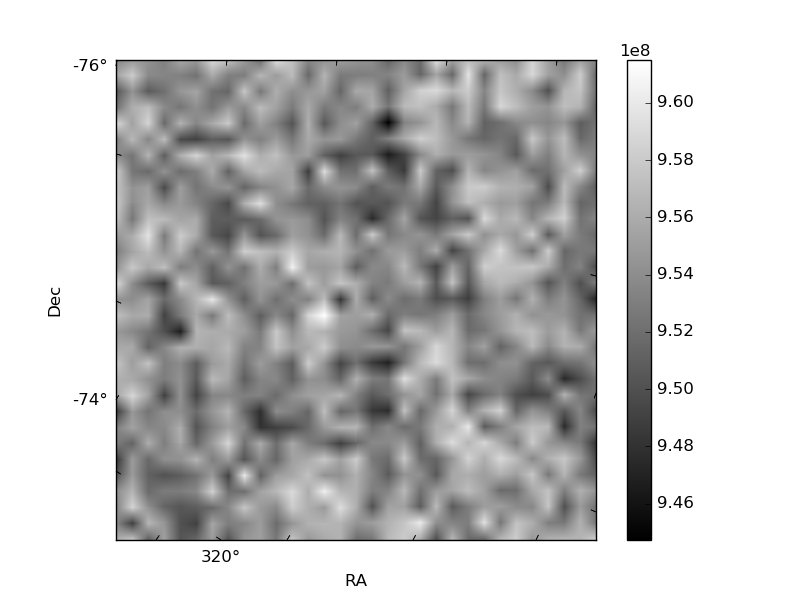
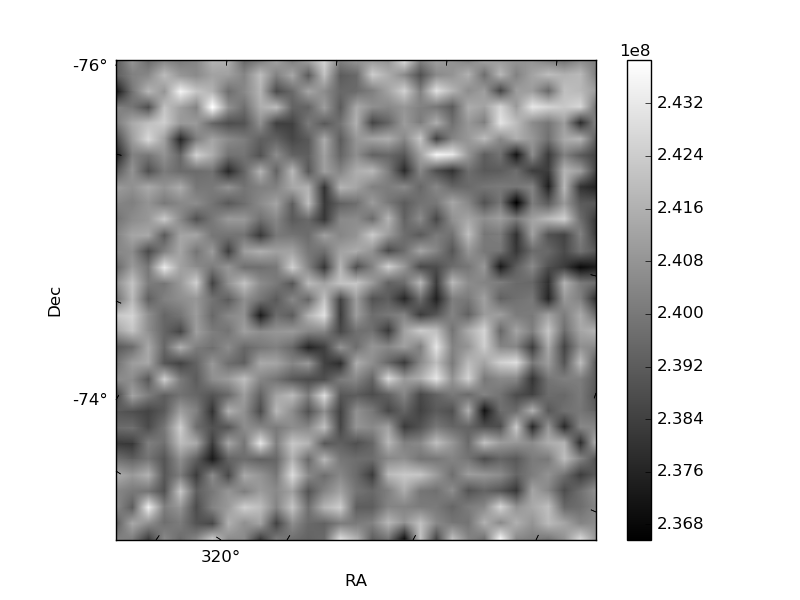
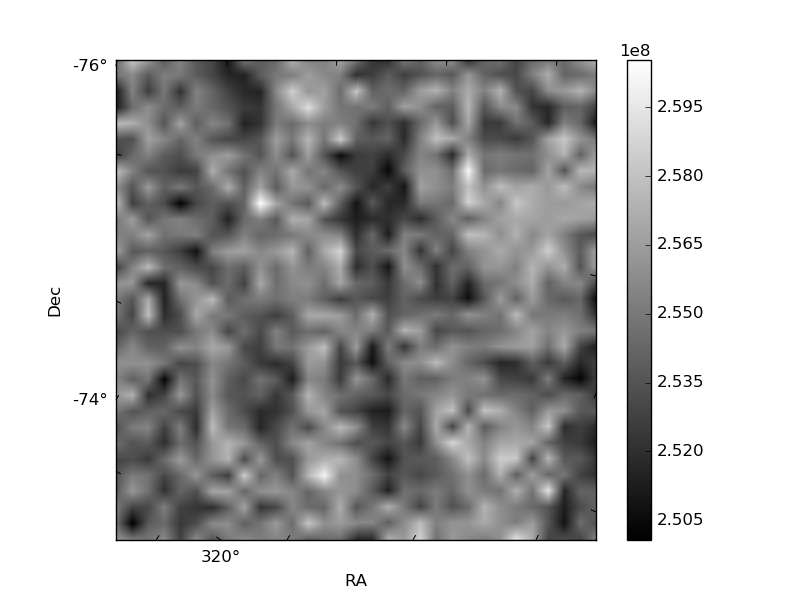
Histogram calculated using DETX and DETY for each event in the final _common_clean file
| Quadrant A | 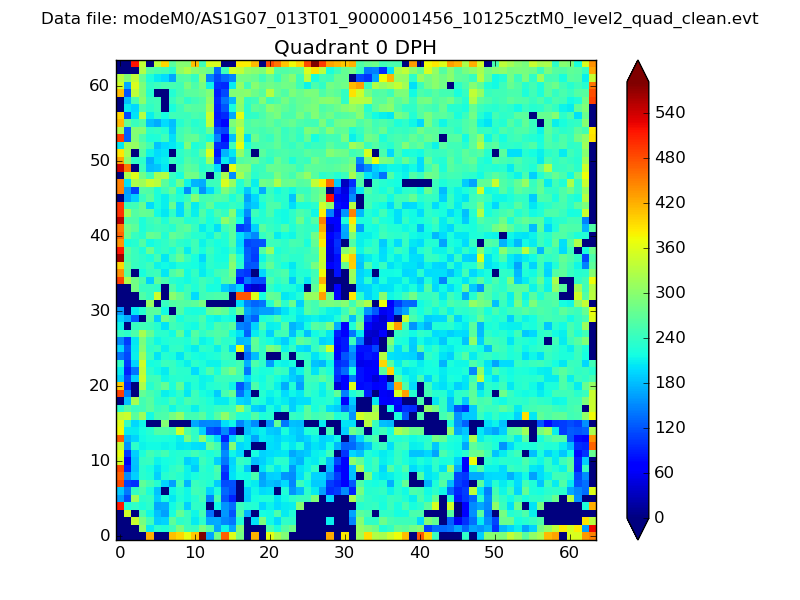 |
 |
Quadrant B |
|---|---|---|---|
| Quadrant D | 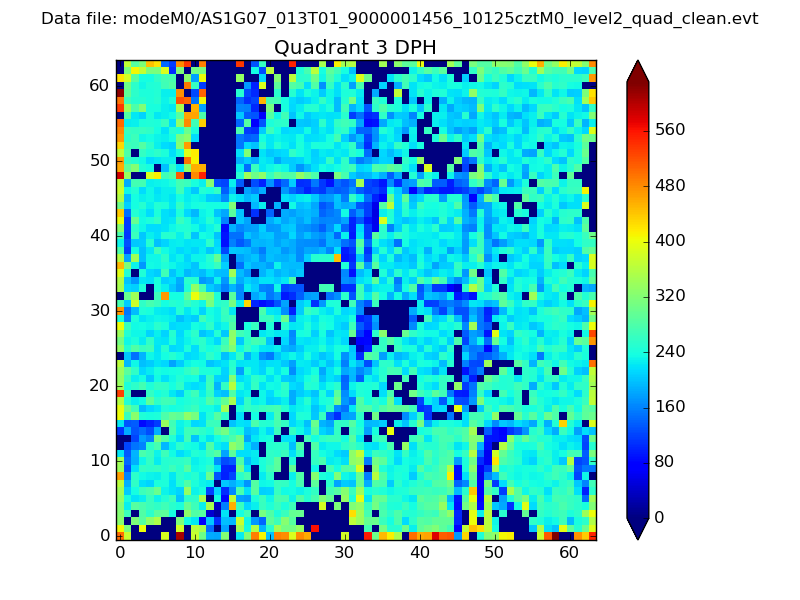 |
 |
Quadrant C |
| Plot type | Count rate plots | Images |
|---|---|---|
| Comparison with Poisson distribution Blue bars denote a histogram of data divided into 1 sec bins. Red curve is a Poisson curve with rate = median count rate of data. |
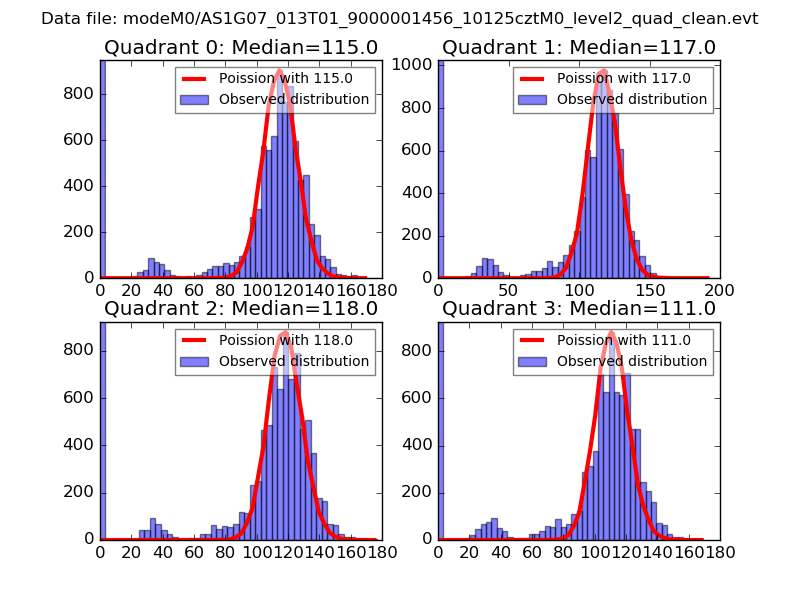 |
 |
| Quadrant-wise count rates Data is divided into 100 sec bins |
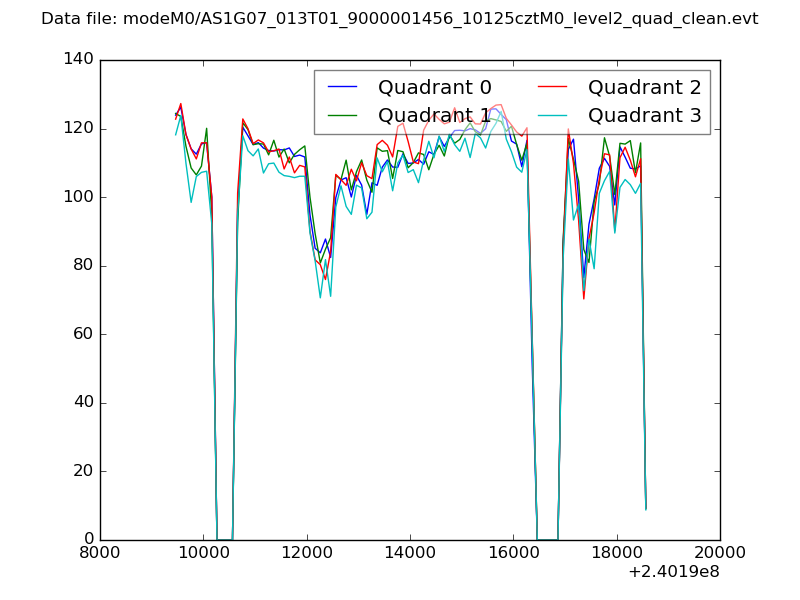 |
|
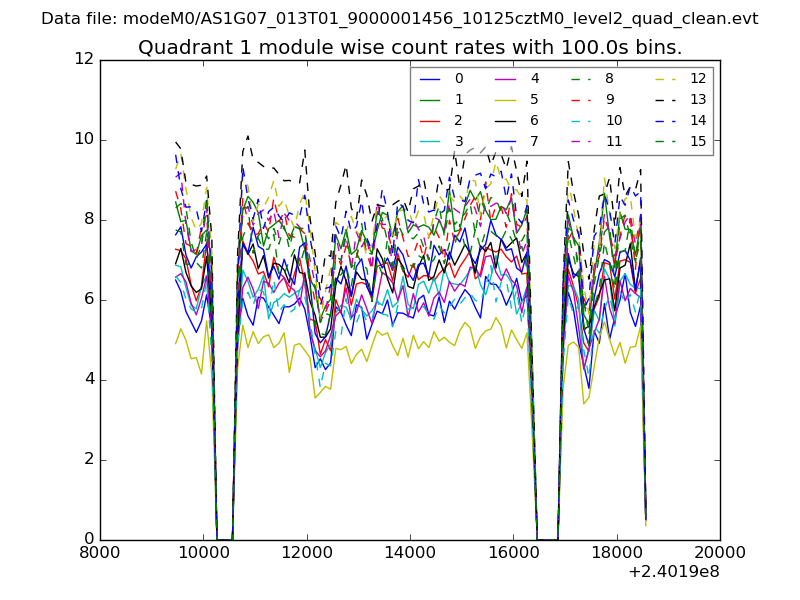
| Module-wise count rates for Quadrant A Data is divided into 100 sec bins |
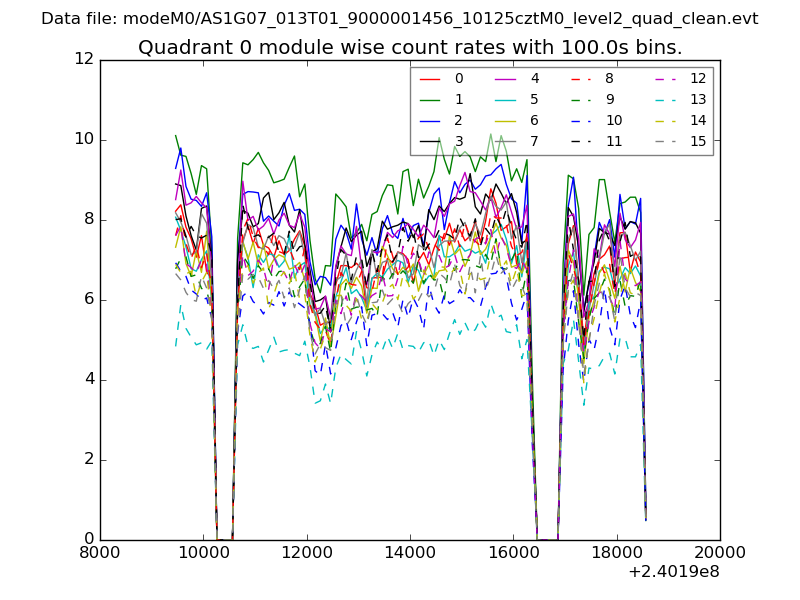 |
 |
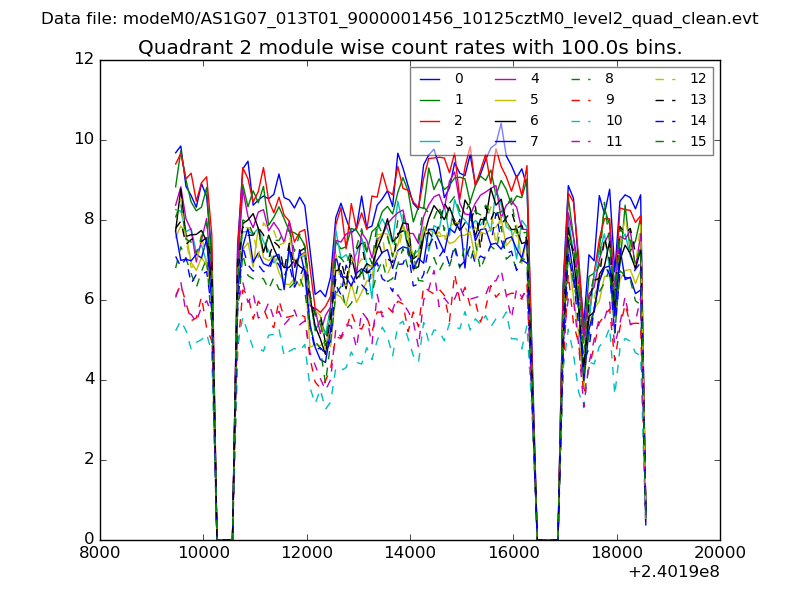
| Module-wise count rates for Quadrant B Data is divided into 100 sec bins |
 |
 |
| Module-wise count rates for Quadrant C Data is divided into 100 sec bins |
 |
 |
| Module-wise count rates for Quadrant D Data is divided into 100 sec bins |
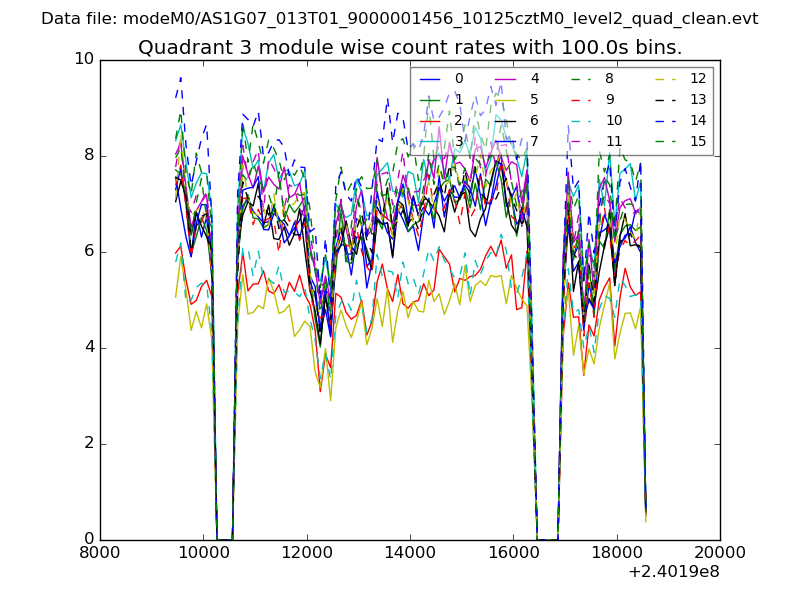 |
 |
| Parameter | Plot |
|---|---|
| CZT HV Monitor | 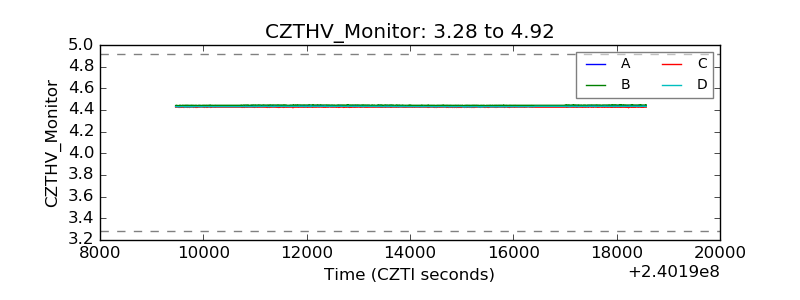 |
| D_VDD |  |
| Temperature 1 | 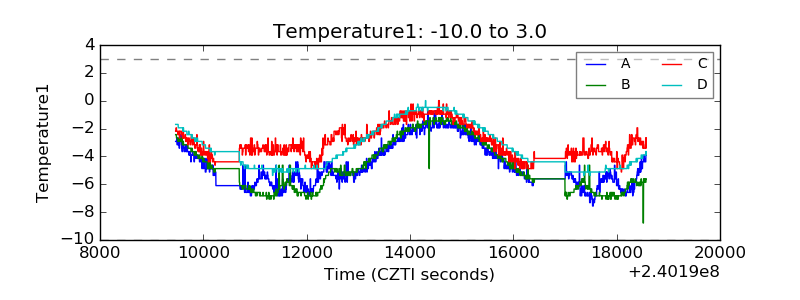 |
| Veto HV Monitor | 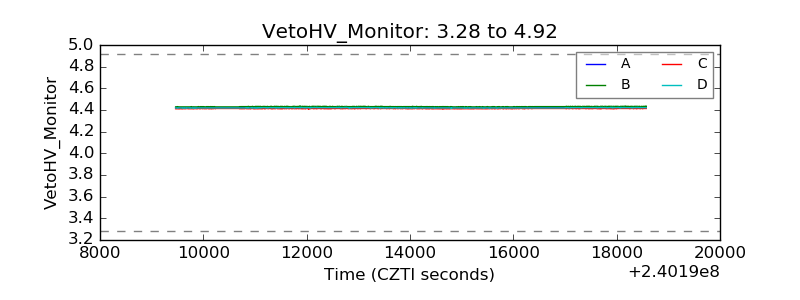 |
| Veto LLD | 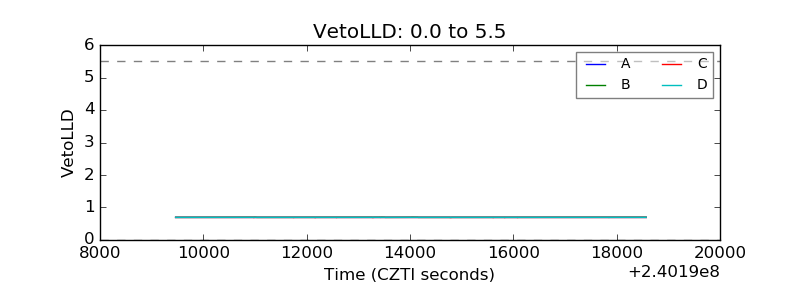 |
| Alpha Counter | 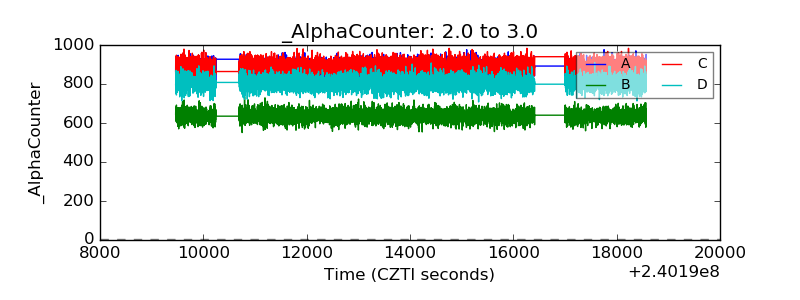 |
| _CPM_Rate | 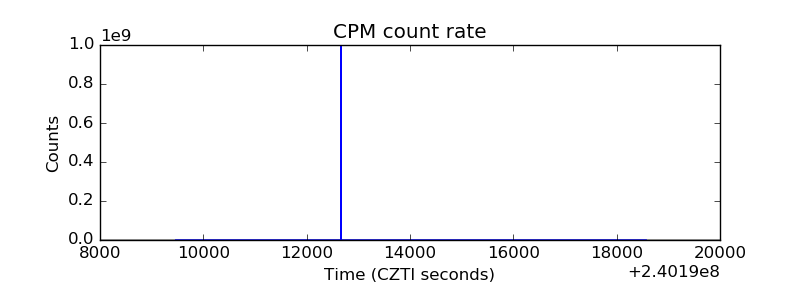 |
| CZT Counter |  |
| +2.5 Volts monitor |  |
| +5 Volts monitor |  |
| _ROLL_ROT | 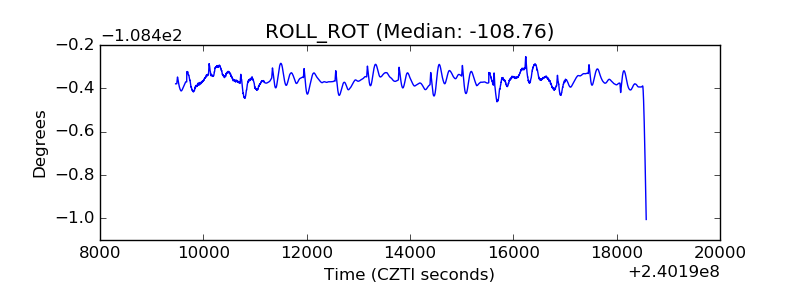 |
| _Roll_DEC | 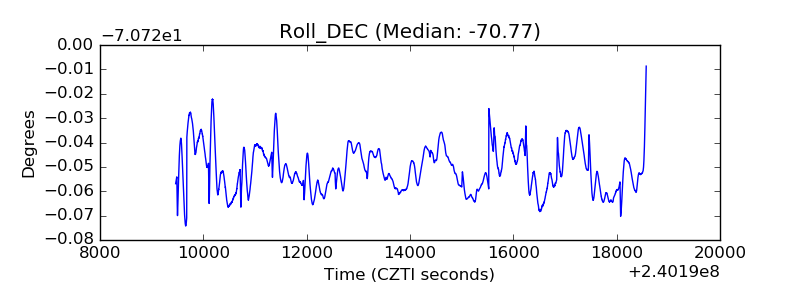 |
| _Roll_RA | 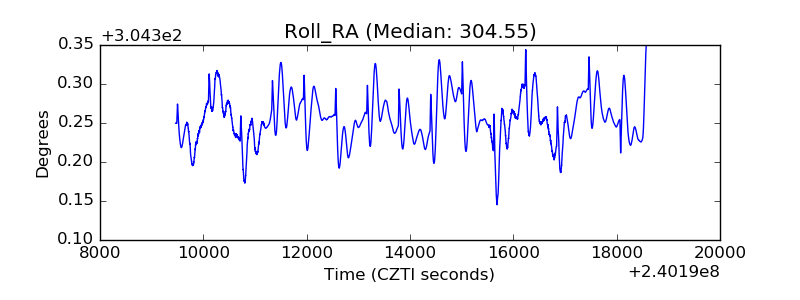 |
| Veto Counter | 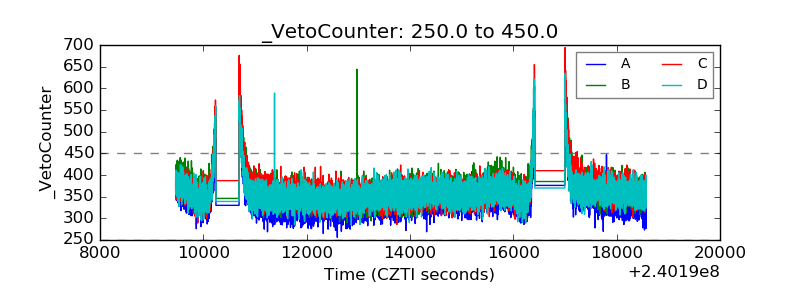 |