| Param | Original file | Final file |
|---|---|---|
| Filename | modeM0/AS1G07_013T01_9000001456_10126cztM0_level2.evt | modeM0/AS1G07_013T01_9000001456_10126cztM0_level2_quad_clean.evt |
| Size (bytes) | 762,321,600 | 204,324,480 |
| Size | 727.0 MB | 194.9 MB |
| Events in quadrant A | 5,316,006 | 1,338,041 |
| Events in quadrant B | 5,494,695 | 1,363,832 |
| Events in quadrant C | 5,012,958 | 1,391,985 |
| Events in quadrant D | 6,493,070 | 1,308,932 |
| Mode SS | |||
|---|---|---|---|
| Quadrant | BADHDUFLAG | Total packets | Discarded packets |
| A | 0 | 236 | 6 |
| B | 0 | 236 | 2 |
| C | 0 | 235 | 2 |
| D | 0 | 236 | 2 |
| Mode M9 | |||
|---|---|---|---|
| Quadrant | BADHDUFLAG | Total packets | Discarded packets |
| A | 0 | 15 | 0 |
| B | 0 | 15 | 0 |
| C | 0 | 15 | 0 |
| D | 0 | 15 | 0 |
| Mode M0 | |||
|---|---|---|---|
| Quadrant | BADHDUFLAG | Total packets | Discarded packets |
| A | 0 | 24228 | 369 |
| B | 0 | 24219 | 363 |
| C | 0 | 23371 | 300 |
| D | 0 | 27127 | 575 |
| Quadrant | Total seconds | Saturated seconds | Saturation percentage |
|---|---|---|---|
| A | 11357 | 219 | 1.928326% |
| B | 11363 | 162 | 1.425680% |
| C | 11377 | 111 | 0.975653% |
| D | 11309 | 226 | 1.998408% |
Noise dominated data is calculated using 1-second bins in cleaned event files. If a bin has >2000 counts, and if more than 50% of those come from <1% of pixels, then it is considered to be noise-dominated and hence unusable.
| Quadrant | # 1 sec bins | Bins with >0 counts | Bins with >2000 counts | High rate bins dominated by noise | Noise dominated (total time) | Noise dominated (detector-on time) | Marked lightcurve |
|---|---|---|---|---|---|---|---|
| A | 13131 | 11518 | 78 | 78 | 0.59% | 0.68% | 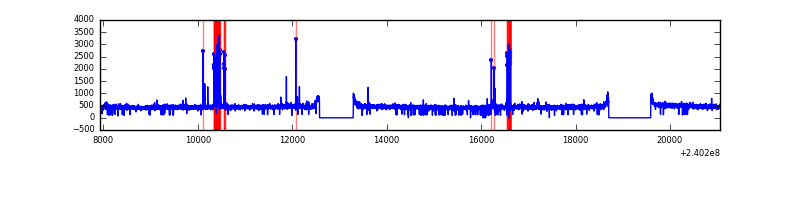 |
| B | 13131 | 11519 | 18 | 18 | 0.14% | 0.16% | 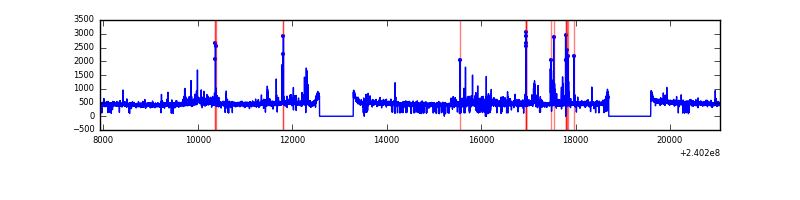 |
| C | 13131 | 11519 | 2 | 2 | 0.02% | 0.02% | 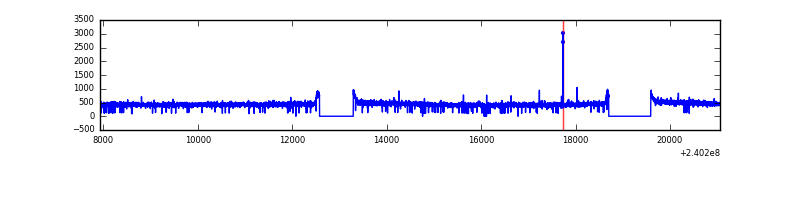 |
| D | 13131 | 11507 | 98 | 98 | 0.75% | 0.85% | 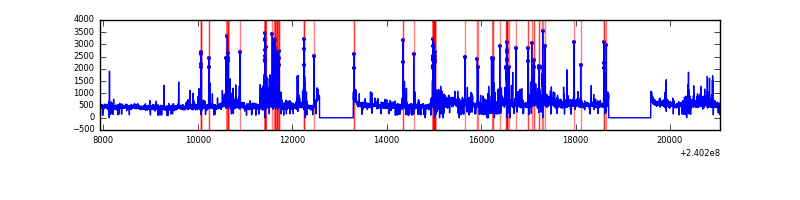 |
Top three noisy pixels from each quadrant. If the there are fewer than three noisy pixels in the level2.evt file, extra rows are filled as -1
| Pixel properties | Quadrant properties | ||||||
|---|---|---|---|---|---|---|---|
| Quadrant | DetID | PixID | Counts | Sigma | Mean | Median | Sigma |
| A | 15 | 174 | 314342 | 1200.32 | 1292 | 1260 | 260.8 |
| A | 8 | 5 | 13650 | 47.5 | 1292 | 1260 | 260.8 |
| A | 0 | 226 | 11891 | 40.76 | 1292 | 1260 | 260.8 |
| B | 0 | 214 | 151950 | 612.35 | 1302 | 1269 | 246.1 |
| B | 4 | 239 | 132059 | 531.52 | 1302 | 1269 | 246.1 |
| B | 0 | 219 | 36931 | 144.93 | 1302 | 1269 | 246.1 |
| C | 14 | 67 | 11129 | 33.66 | 1280 | 1282 | 292.6 |
| C | 14 | 234 | 10815 | 32.58 | 1280 | 1282 | 292.6 |
| C | 13 | 61 | 9550 | 28.26 | 1280 | 1282 | 292.6 |
| D | 8 | 195 | 574735 | 1913.4 | 1262 | 1224 | 299.7 |
| D | 2 | 16 | 250154 | 830.5 | 1262 | 1224 | 299.7 |
| D | 12 | 233 | 246730 | 819.08 | 1262 | 1224 | 299.7 |
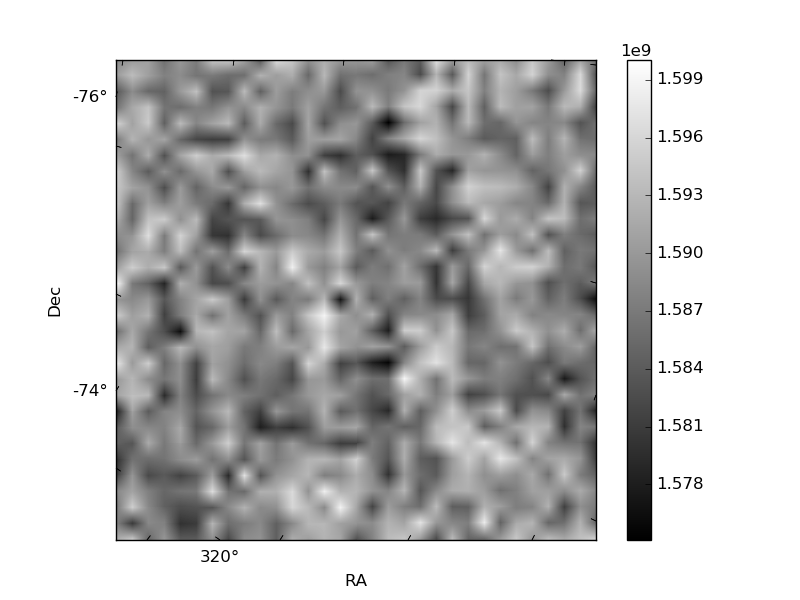
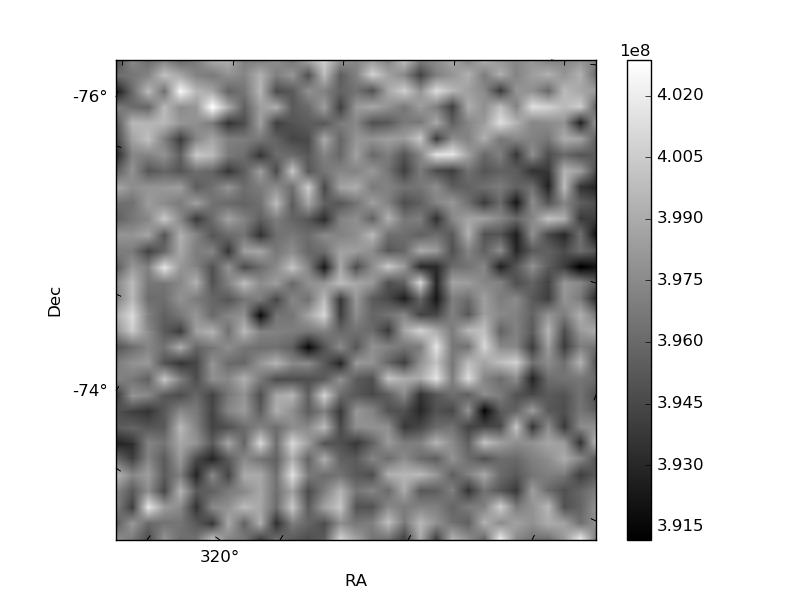
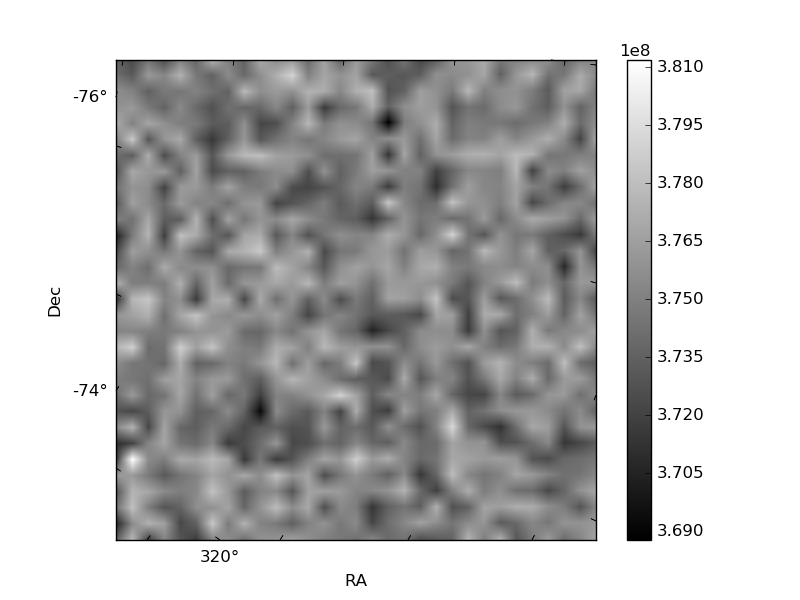
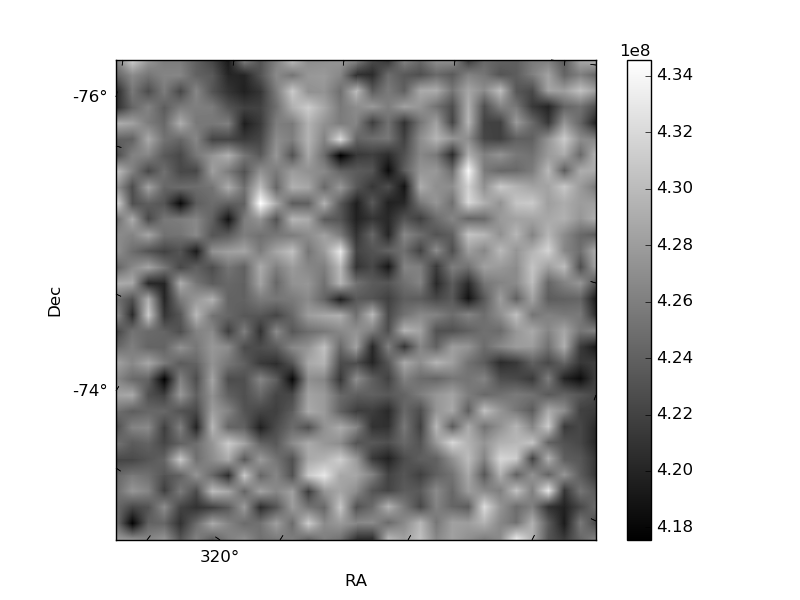
Histogram calculated using DETX and DETY for each event in the final _common_clean file
| Quadrant A | 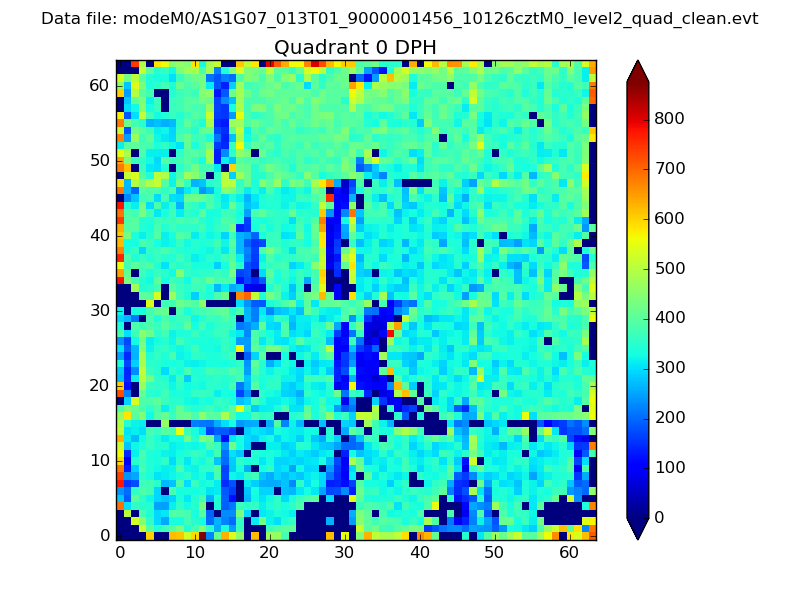 |
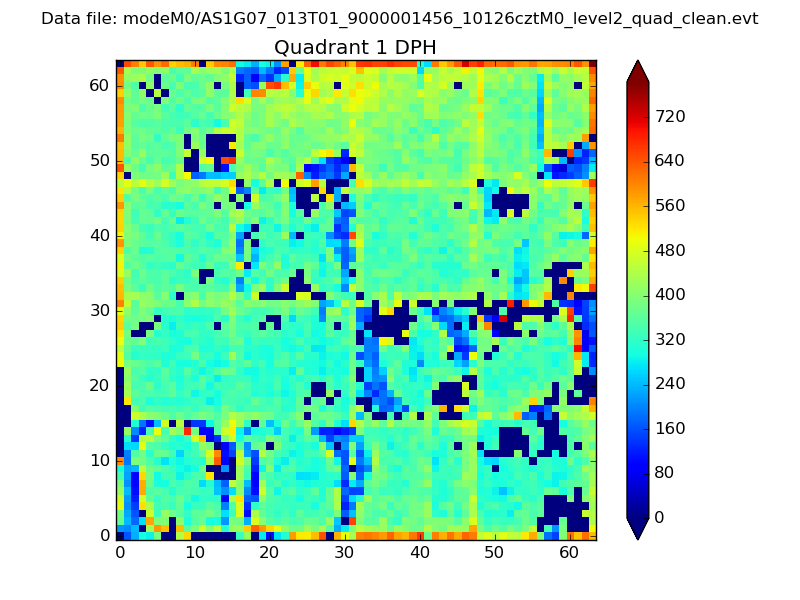 |
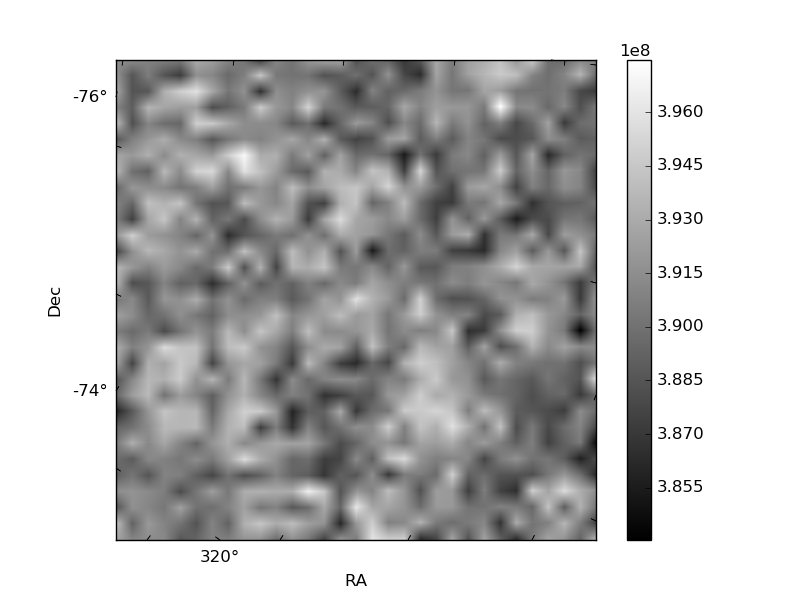
Quadrant B |
|---|---|---|---|
| Quadrant D | 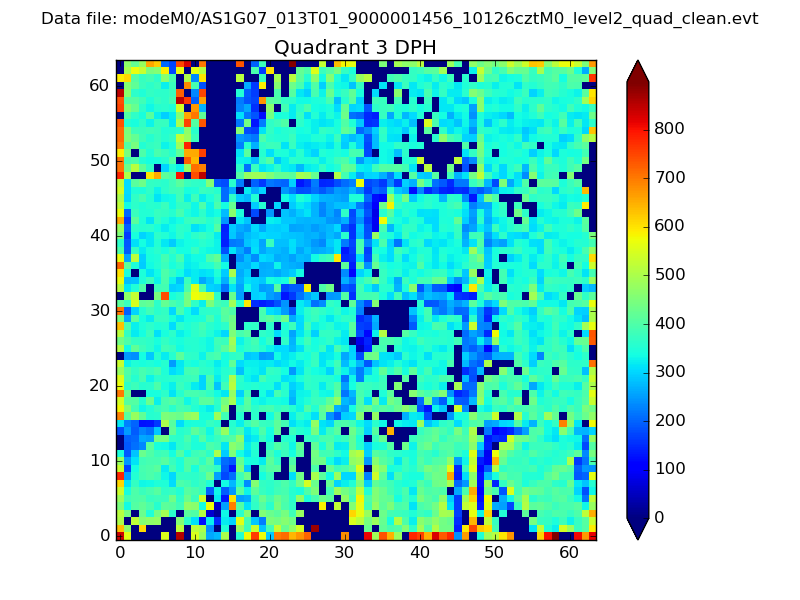 |
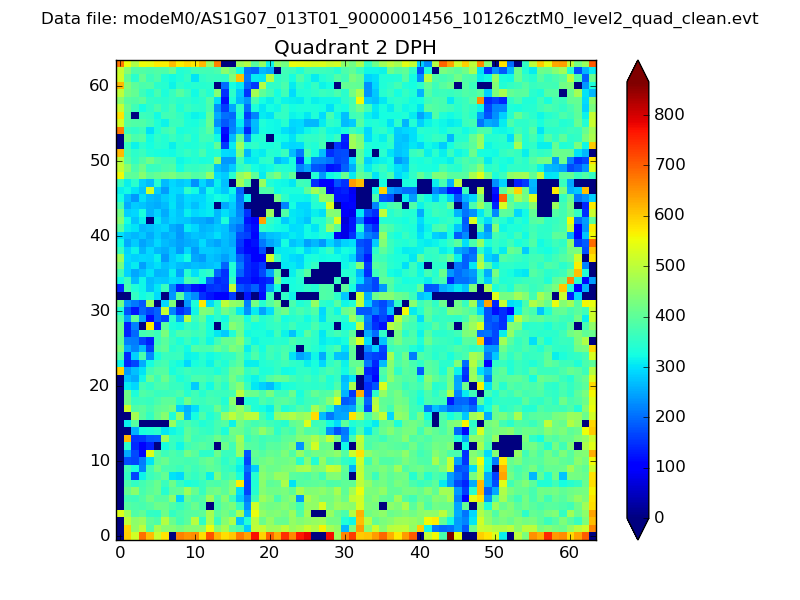 |
Quadrant C |
| Plot type | Count rate plots | Images |
|---|---|---|
| Comparison with Poisson distribution Blue bars denote a histogram of data divided into 1 sec bins. Red curve is a Poisson curve with rate = median count rate of data. |
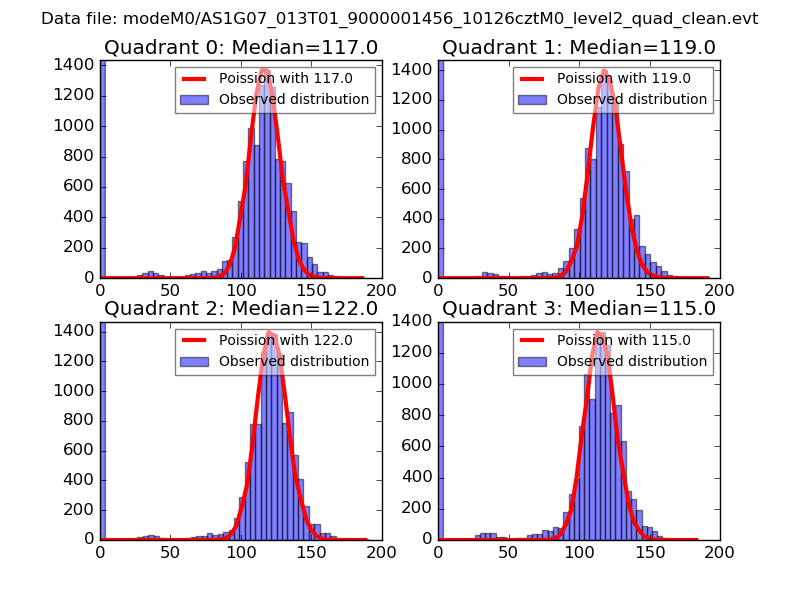 |
 |
| Quadrant-wise count rates Data is divided into 100 sec bins |
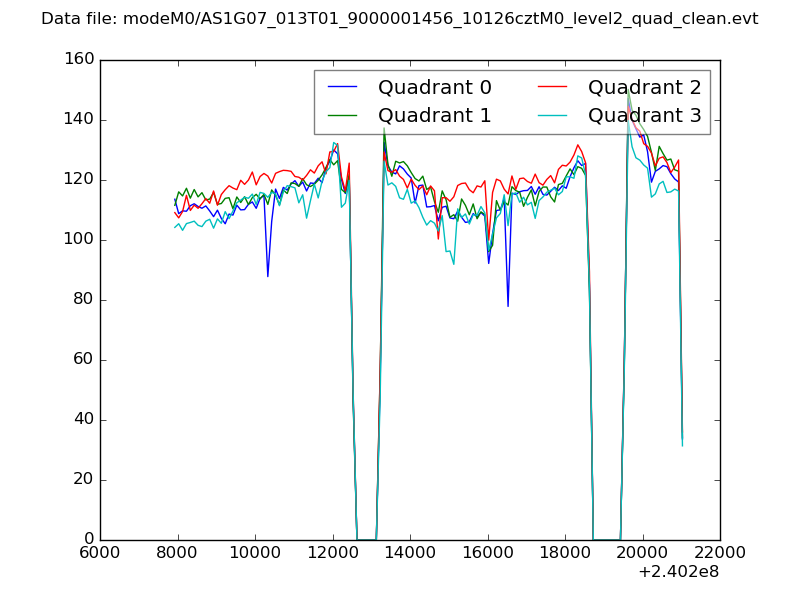 |
|
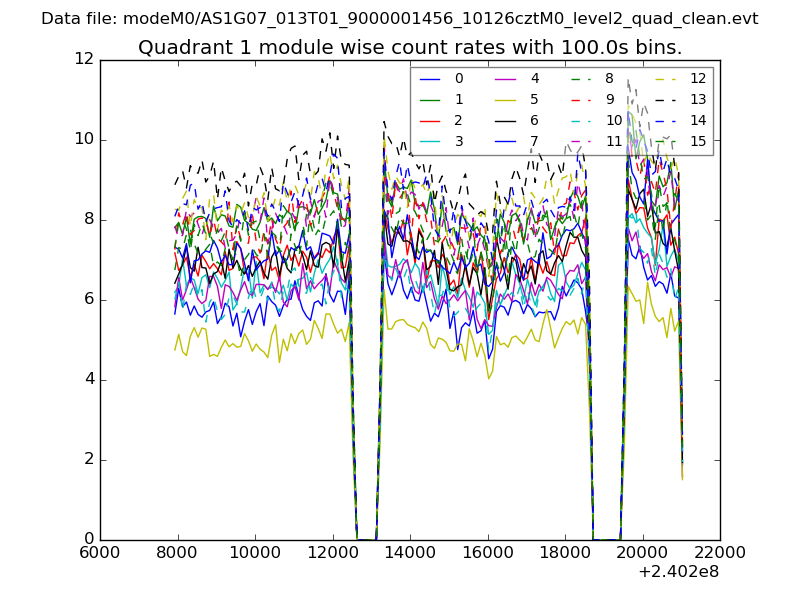
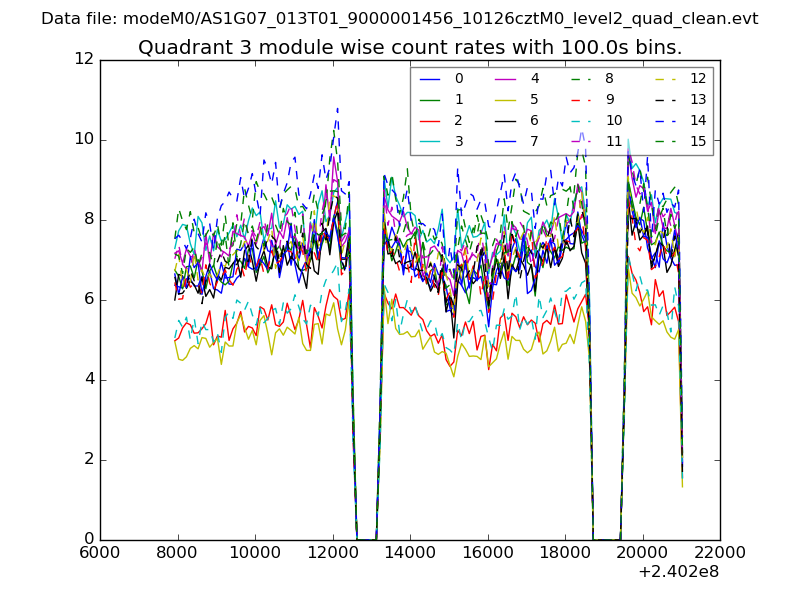
| Module-wise count rates for Quadrant A Data is divided into 100 sec bins |
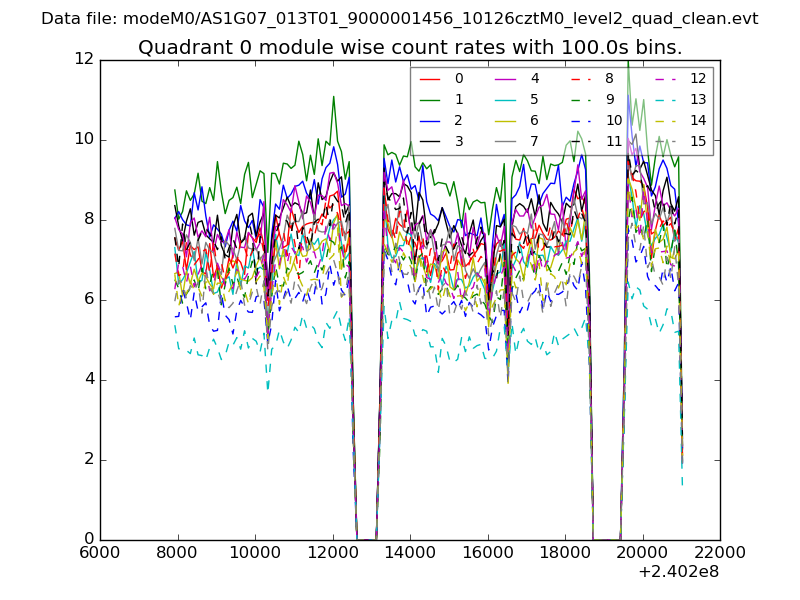 |
 |
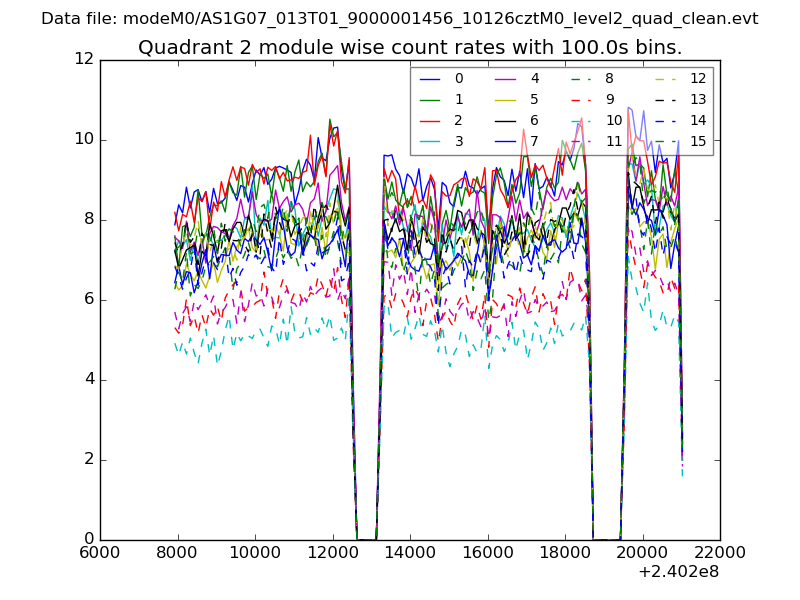
| Module-wise count rates for Quadrant B Data is divided into 100 sec bins |
 |
 |
| Module-wise count rates for Quadrant C Data is divided into 100 sec bins |
 |
 |
| Module-wise count rates for Quadrant D Data is divided into 100 sec bins |
 |
 |
| Parameter | Plot |
|---|---|
| CZT HV Monitor | 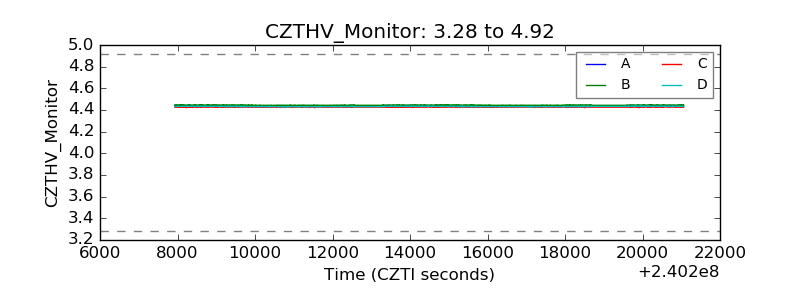 |
| D_VDD | 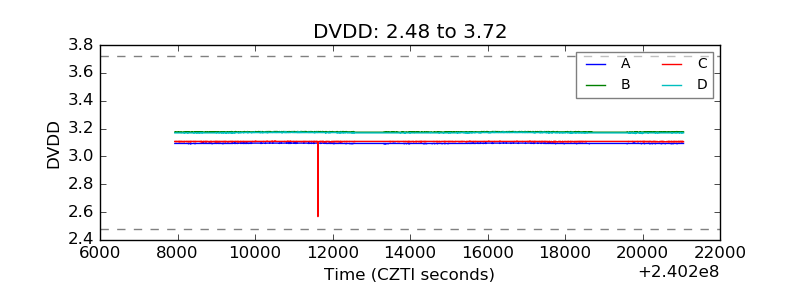 |
| Temperature 1 | 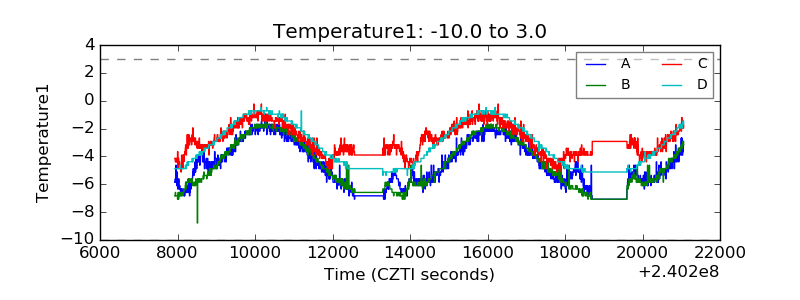 |
| Veto HV Monitor | 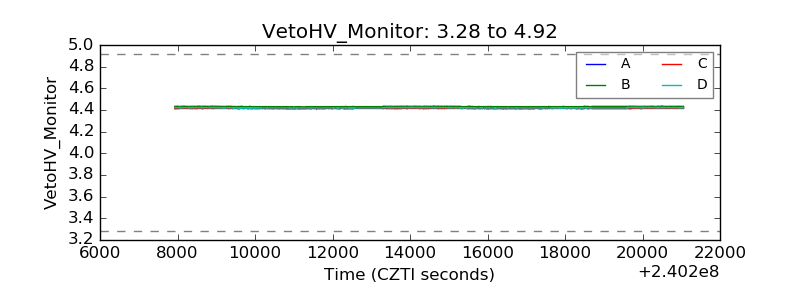 |
| Veto LLD | 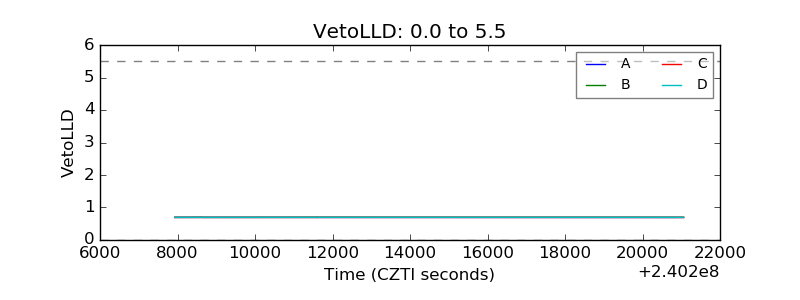 |
| Alpha Counter | 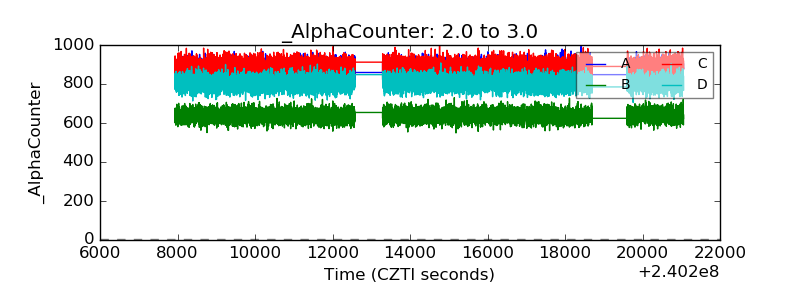 |
| _CPM_Rate | 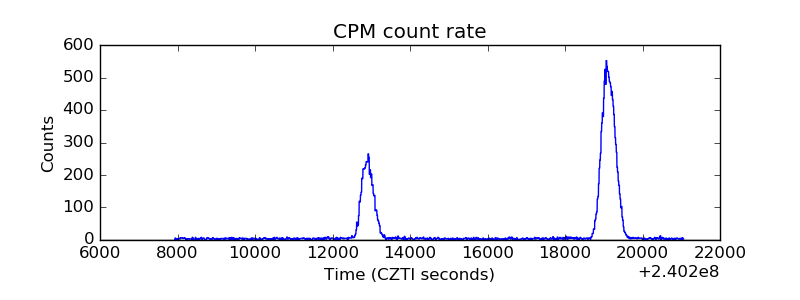 |
| CZT Counter | 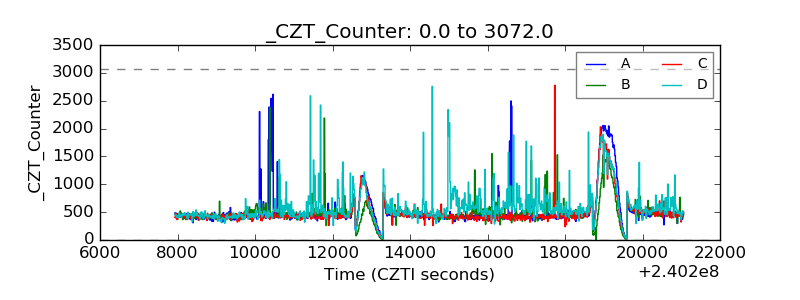 |
| +2.5 Volts monitor |  |
| +5 Volts monitor | 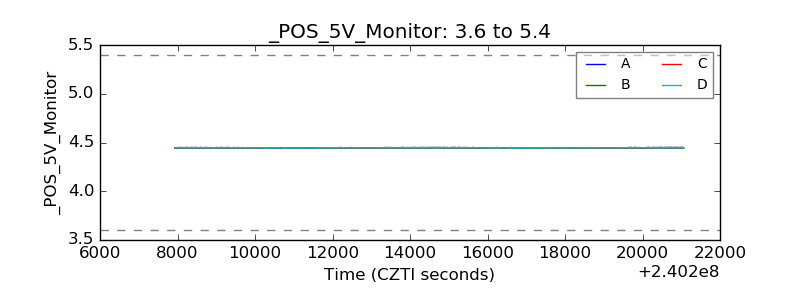 |
| _ROLL_ROT |  |
| _Roll_DEC |  |
| _Roll_RA | 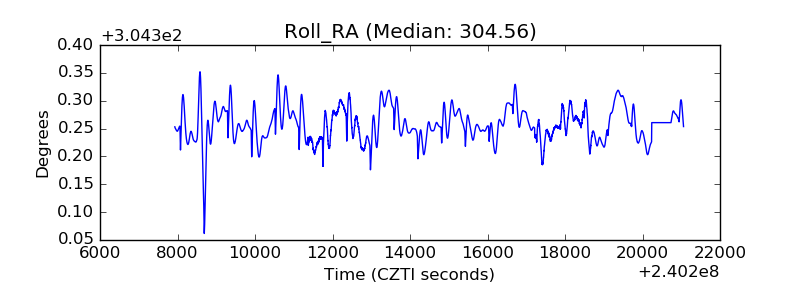 |
| Veto Counter | 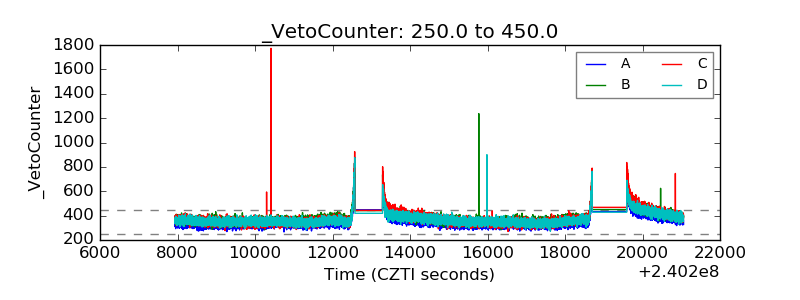 |