| Param | Original file | Final file |
|---|---|---|
| Filename | modeM0/AS1G07_013T01_9000001456_10127cztM0_level2.evt | modeM0/AS1G07_013T01_9000001456_10127cztM0_level2_quad_clean.evt |
| Size (bytes) | 2,200,121,280 | 580,115,520 |
| Size | 2.0 GB | 553.2 MB |
| Events in quadrant A | 14,535,261 | 3,844,284 |
| Events in quadrant B | 15,527,706 | 3,885,797 |
| Events in quadrant C | 14,180,809 | 3,915,023 |
| Events in quadrant D | 20,191,537 | 3,694,432 |
| Mode SS | |||
|---|---|---|---|
| Quadrant | BADHDUFLAG | Total packets | Discarded packets |
| A | 0 | 660 | 0 |
| B | 0 | 660 | 0 |
| C | 0 | 660 | 0 |
| D | 0 | 660 | 0 |
| Mode M9 | |||
|---|---|---|---|
| Quadrant | BADHDUFLAG | Total packets | Discarded packets |
| A | 0 | 26 | 0 |
| B | 0 | 26 | 0 |
| C | 0 | 26 | 0 |
| D | 0 | 26 | 0 |
| Mode M0 | |||
|---|---|---|---|
| Quadrant | BADHDUFLAG | Total packets | Discarded packets |
| A | 0 | 66705 | 130 |
| B | 0 | 68712 | 90 |
| C | 0 | 65875 | 127 |
| D | 0 | 82235 | 103 |
| Quadrant | Total seconds | Saturated seconds | Saturation percentage |
|---|---|---|---|
| A | 32494 | 215 | 0.661661% |
| B | 32511 | 322 | 0.990434% |
| C | 32494 | 129 | 0.396996% |
| D | 32509 | 969 | 2.980713% |
Noise dominated data is calculated using 1-second bins in cleaned event files. If a bin has >2000 counts, and if more than 50% of those come from <1% of pixels, then it is considered to be noise-dominated and hence unusable.
| Quadrant | # 1 sec bins | Bins with >0 counts | Bins with >2000 counts | High rate bins dominated by noise | Noise dominated (total time) | Noise dominated (detector-on time) | Marked lightcurve |
|---|---|---|---|---|---|---|---|
| A | 44979 | 32555 | 29 | 29 | 0.06% | 0.09% | 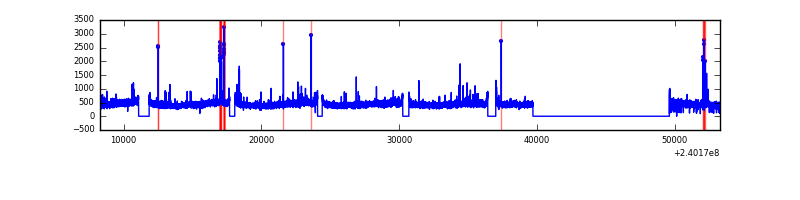 |
| B | 44979 | 32556 | 40 | 40 | 0.09% | 0.12% | 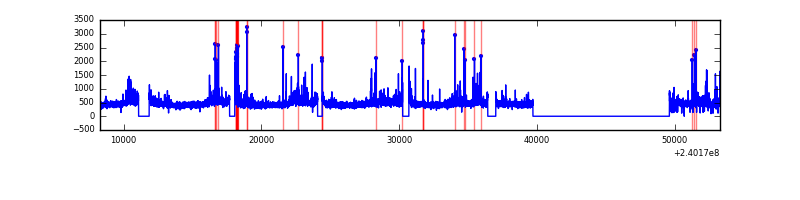 |
| C | 44979 | 32554 | 5 | 5 | 0.01% | 0.02% | 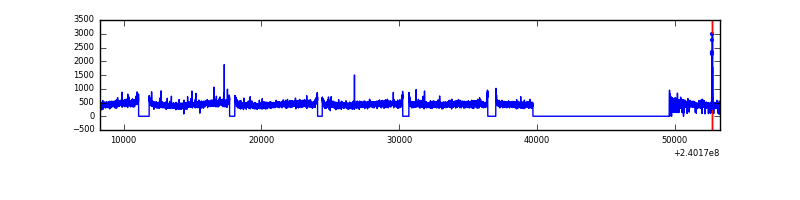 |
| D | 44979 | 32556 | 724 | 724 | 1.61% | 2.22% | 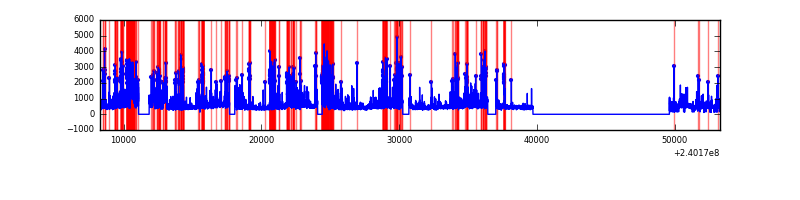 |
Top three noisy pixels from each quadrant. If the there are fewer than three noisy pixels in the level2.evt file, extra rows are filled as -1
| Pixel properties | Quadrant properties | ||||||
|---|---|---|---|---|---|---|---|
| Quadrant | DetID | PixID | Counts | Sigma | Mean | Median | Sigma |
| A | 15 | 174 | 234553 | 312.77 | 3673 | 3589 | 738.4 |
| A | 8 | 5 | 75847 | 97.85 | 3673 | 3589 | 738.4 |
| A | 8 | 15 | 49571 | 62.27 | 3673 | 3589 | 738.4 |
| B | 0 | 214 | 415089 | 599.26 | 3689 | 3603 | 686.7 |
| B | 0 | 189 | 166718 | 237.55 | 3689 | 3603 | 686.7 |
| B | 4 | 81 | 153899 | 218.88 | 3689 | 3603 | 686.7 |
| C | 14 | 67 | 44619 | 49.59 | 3612 | 3623 | 826.7 |
| C | 8 | 222 | 41607 | 45.94 | 3612 | 3623 | 826.7 |
| C | 13 | 61 | 27271 | 28.6 | 3612 | 3623 | 826.7 |
| D | 1 | 52 | 2778085 | 3271.17 | 3557 | 3452 | 848.2 |
| D | 8 | 195 | 1014467 | 1191.94 | 3557 | 3452 | 848.2 |
| D | 4 | 95 | 492071 | 576.06 | 3557 | 3452 | 848.2 |
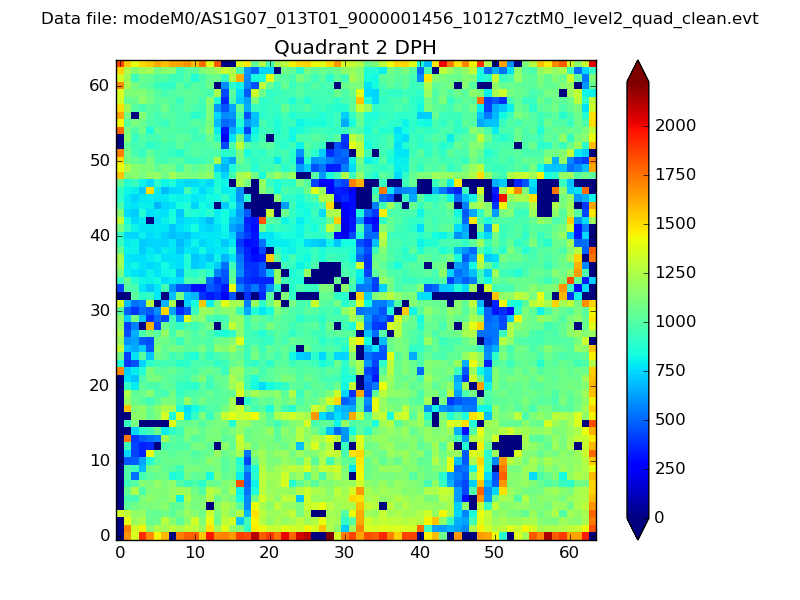
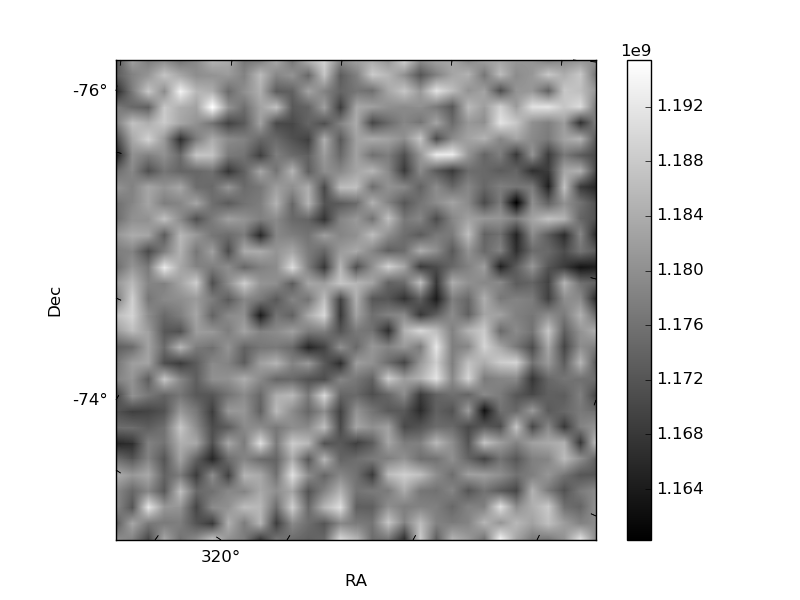
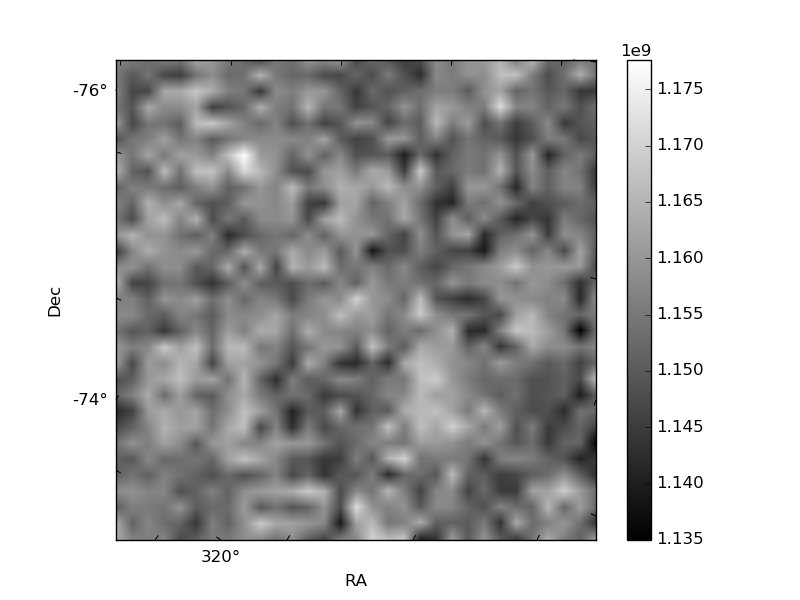
Histogram calculated using DETX and DETY for each event in the final _common_clean file
| Quadrant A | 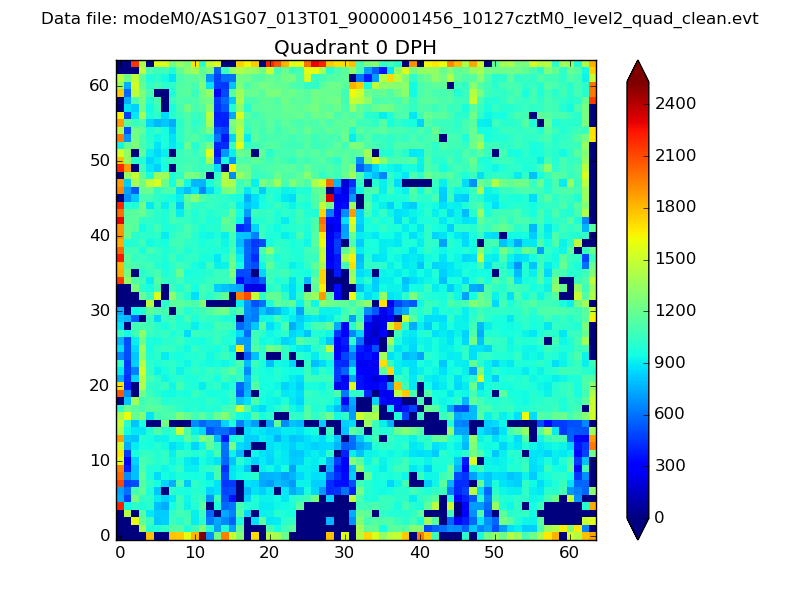 |
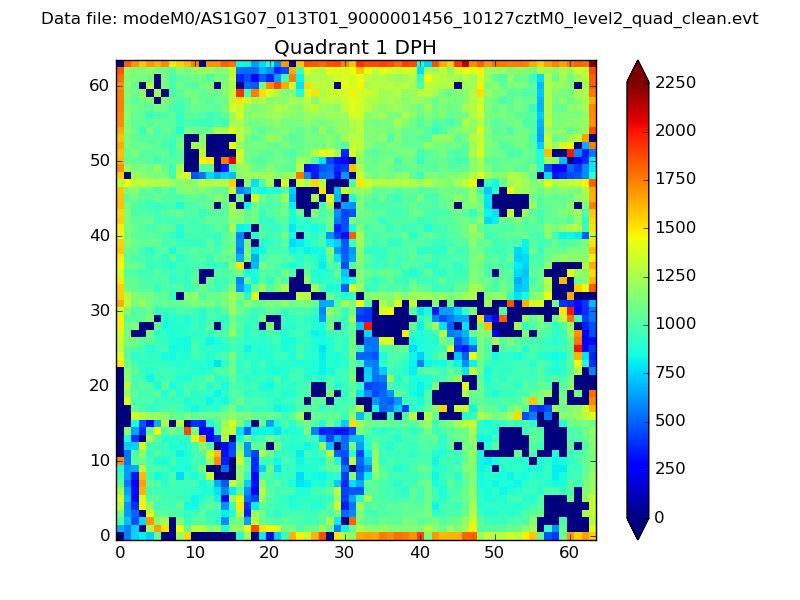 |
Quadrant B |
|---|---|---|---|
| Quadrant D | 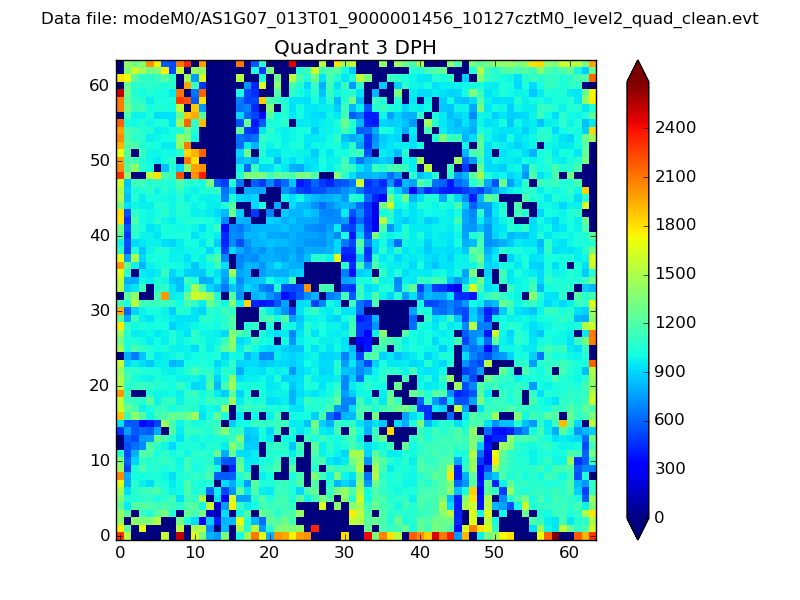 |
 |
Quadrant C |
| Plot type | Count rate plots | Images |
|---|---|---|
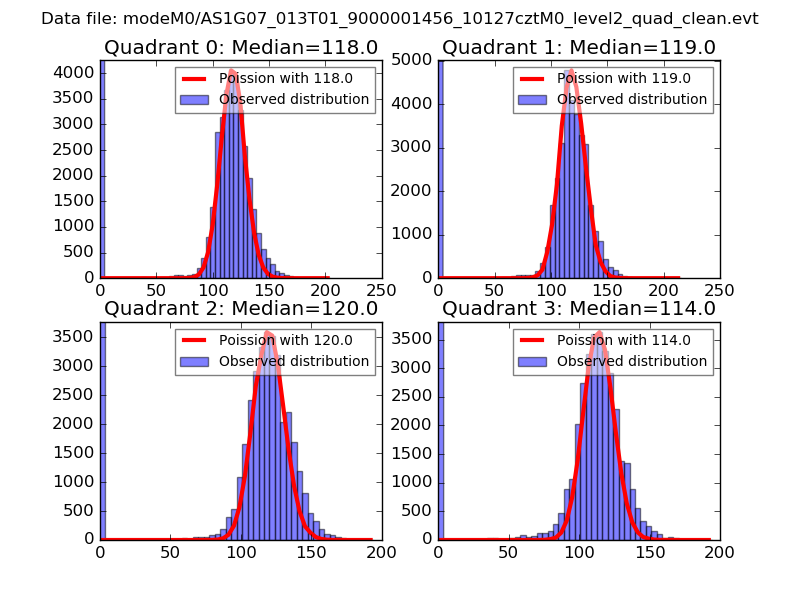
| Comparison with Poisson distribution Blue bars denote a histogram of data divided into 1 sec bins. Red curve is a Poisson curve with rate = median count rate of data. |
 |
 |
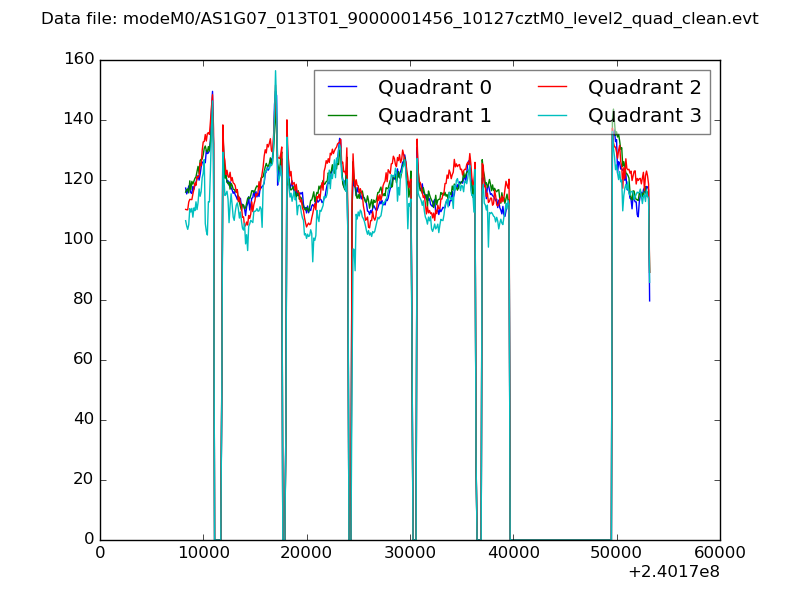
| Quadrant-wise count rates Data is divided into 100 sec bins |
 |
|
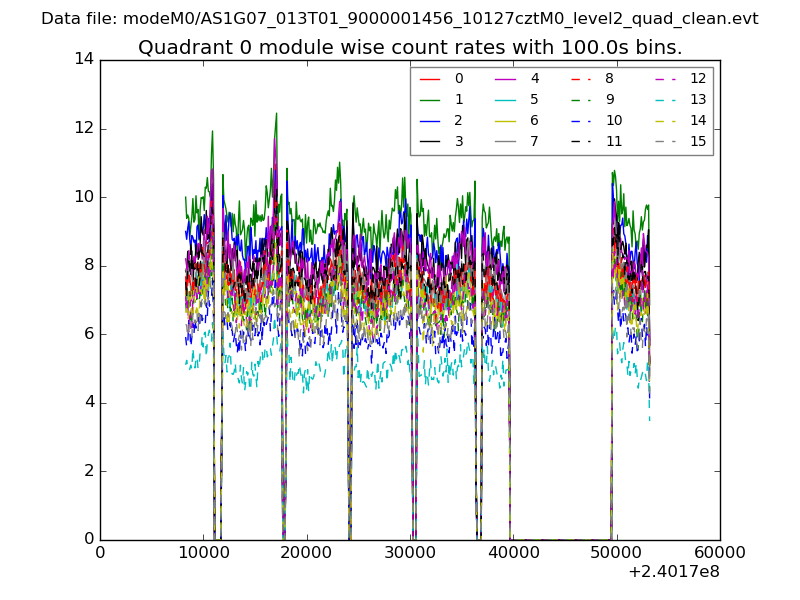
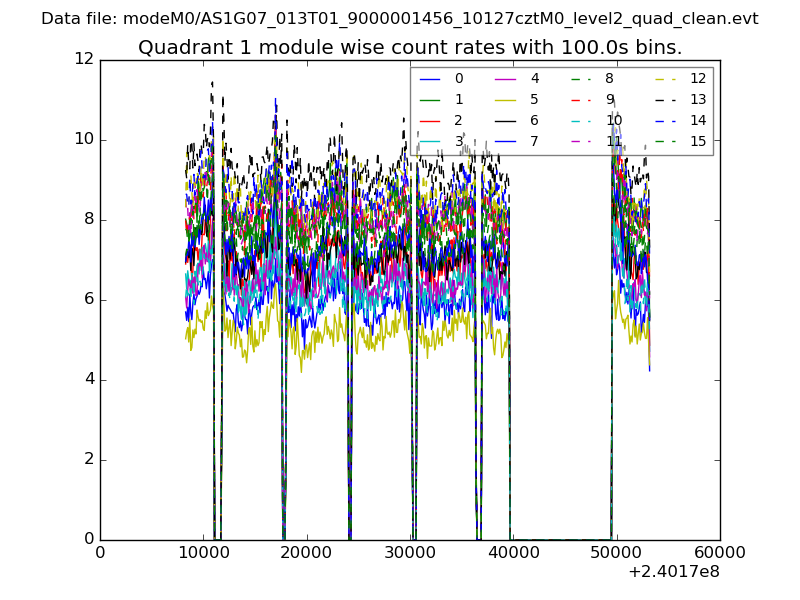
| Module-wise count rates for Quadrant A Data is divided into 100 sec bins |
 |
 |
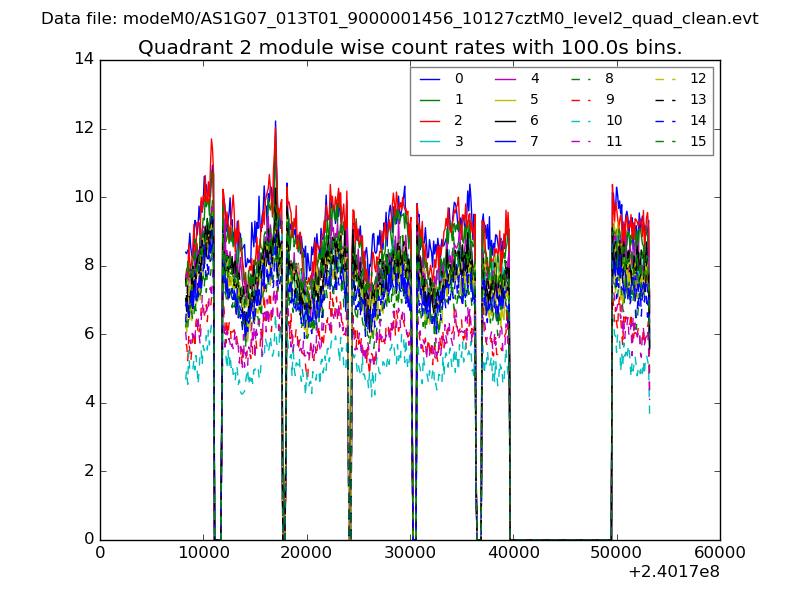
| Module-wise count rates for Quadrant B Data is divided into 100 sec bins |
 |
 |
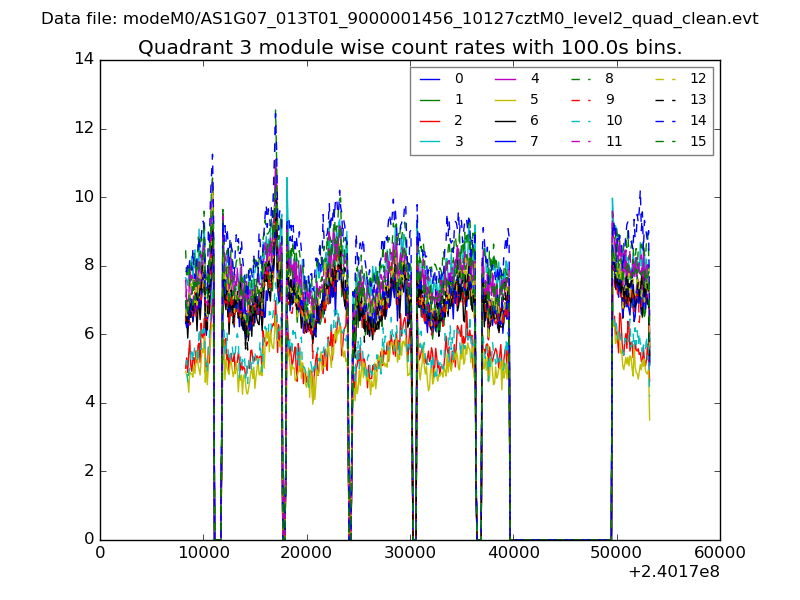
| Module-wise count rates for Quadrant C Data is divided into 100 sec bins |
 |
 |
| Module-wise count rates for Quadrant D Data is divided into 100 sec bins |
 |
 |
| Parameter | Plot |
|---|---|
| CZT HV Monitor | 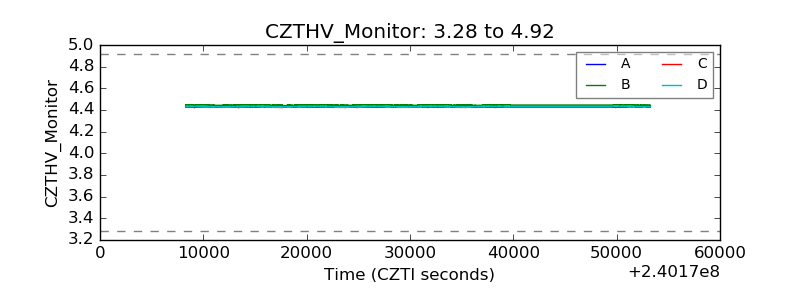 |
| D_VDD | 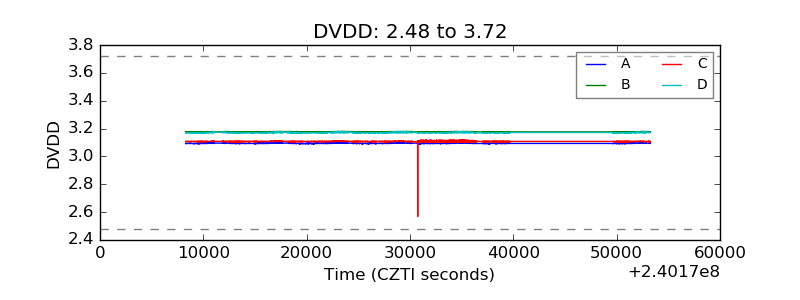 |
| Temperature 1 | 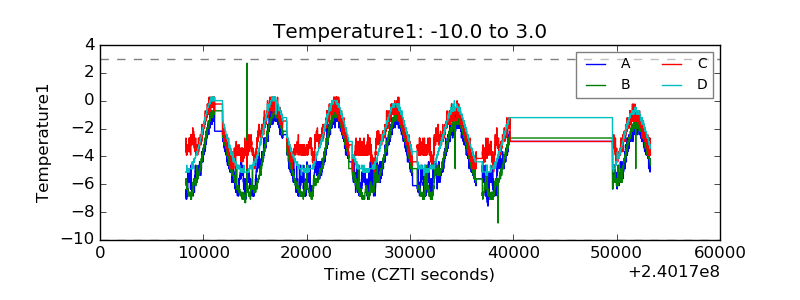 |
| Veto HV Monitor | 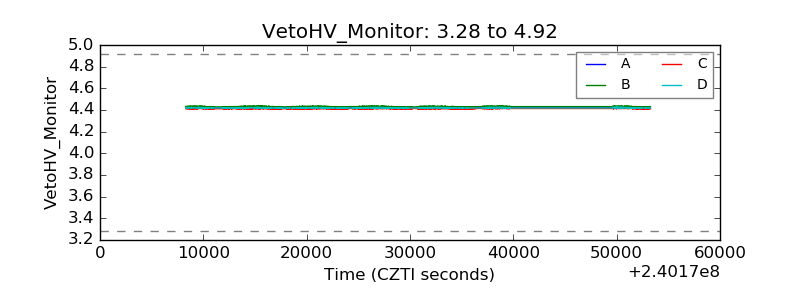 |
| Veto LLD | 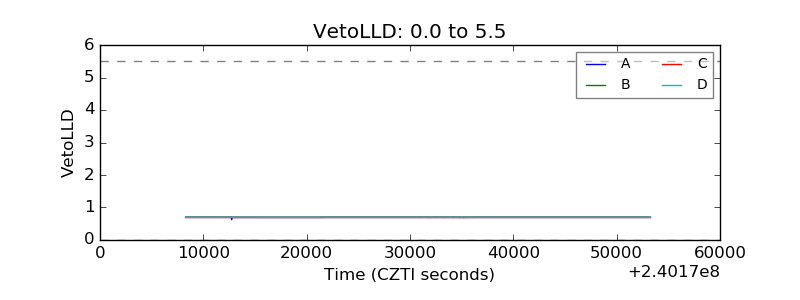 |
| Alpha Counter | 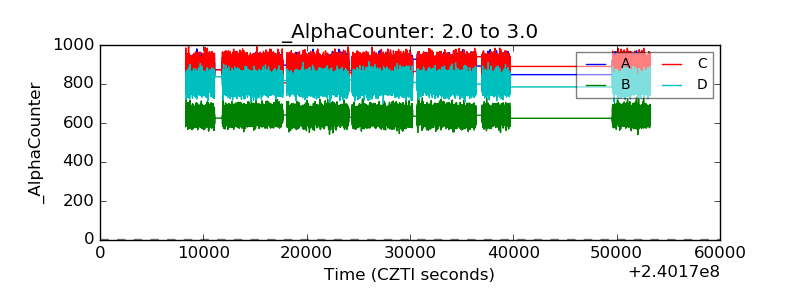 |
| _CPM_Rate | 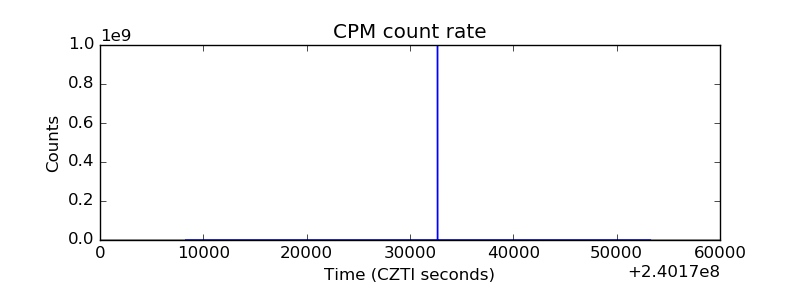 |
| CZT Counter | 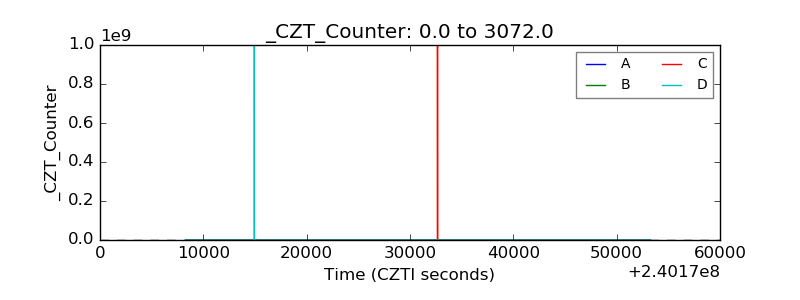 |
| +2.5 Volts monitor |  |
| +5 Volts monitor |  |
| _ROLL_ROT | 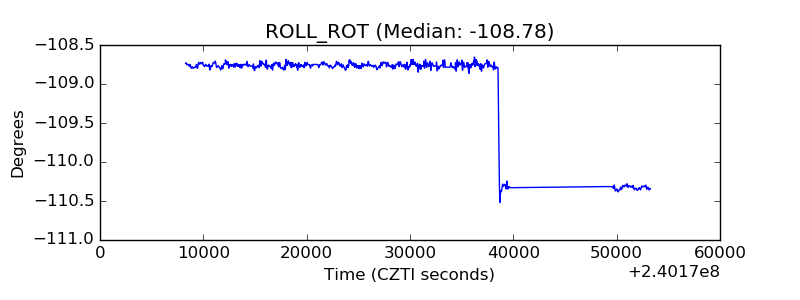 |
| _Roll_DEC |  |
| _Roll_RA | 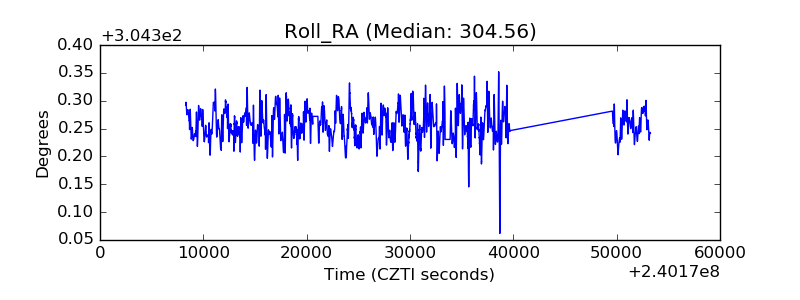 |
| Veto Counter | 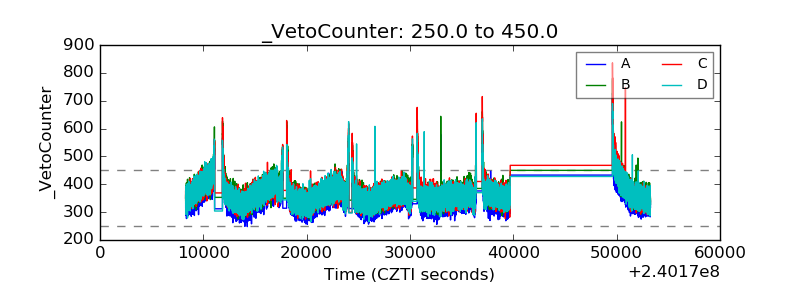 |