| Param | Original file | Final file |
|---|---|---|
| Filename | modeM0/AS1A03_079T02_9000001458cztM0_level2.fits | modeM0/AS1A03_079T02_9000001458cztM0_level2_quad_clean.evt |
| Size (bytes) | 126,737,280 | 98,441,280 |
| Size | 120.9 MB | 93.9 MB |
| Events in quadrant A | 786,962 | 553,751 |
| Events in quadrant B | 746,458 | 549,044 |
| Events in quadrant C | 767,766 | 523,649 |
| Events in quadrant D | 661,318 | 477,951 |
| Mode SS | |||
|---|---|---|---|
| Quadrant | BADHDUFLAG | Total packets | Discarded packets |
| A | 0 | 260 | 0 |
| B | 0 | 262 | 0 |
| C | 0 | 262 | 0 |
| D | 0 | 260 | 0 |
| Mode M0 | |||
|---|---|---|---|
| Quadrant | BADHDUFLAG | Total packets | Discarded packets |
| A | 0 | 26946 | 0 |
| B | 0 | 27430 | 0 |
| C | 0 | 25958 | 0 |
| D | 0 | 31815 | 0 |
| Mode M9 | |||
|---|---|---|---|
| Quadrant | BADHDUFLAG | Total packets | Discarded packets |
| A | 0 | 34 | 0 |
| B | 0 | 34 | 0 |
| C | 0 | 34 | 0 |
| D | 0 | 34 | 0 |
| Quadrant | Total seconds | Saturated seconds | Saturation percentage |
|---|---|---|---|
| A | 12671 | 176 | 1.388999% |
| B | 12666 | 164 | 1.294805% |
| C | 12669 | 96 | 0.757755% |
| D | 12663 | 379 | 2.992972% |
Noise dominated data is calculated using 1-second bins in cleaned event files. If a bin has >2000 counts, and if more than 50% of those come from <1% of pixels, then it is considered to be noise-dominated and hence unusable.
| Quadrant | # 1 sec bins | Bins with >0 counts | Bins with >2000 counts | High rate bins dominated by noise | Noise dominated (total time) | Noise dominated (detector-on time) | Marked lightcurve |
|---|---|---|---|---|---|---|---|
| A | 16141 | 12703 | 0 | 0 | 0.00% | 0.00% | 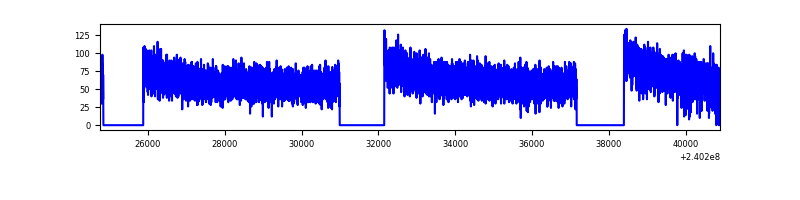 |
| B | 16142 | 12707 | 0 | 0 | 0.00% | 0.00% | 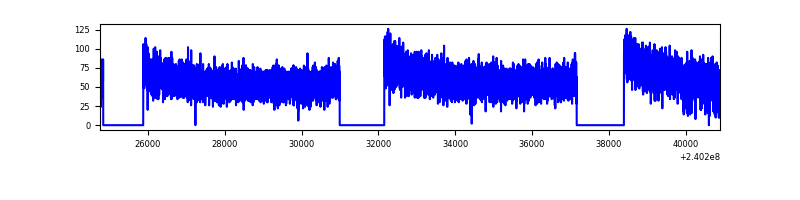 |
| C | 16142 | 12712 | 0 | 0 | 0.00% | 0.00% | 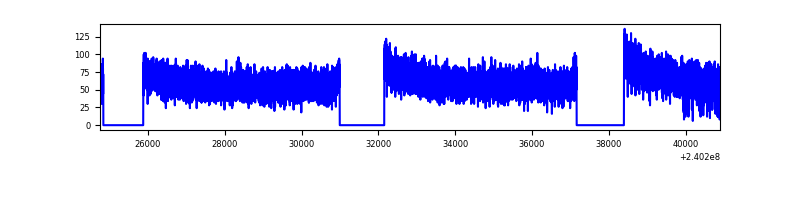 |
| D | 16142 | 12703 | 0 | 0 | 0.00% | 0.00% | 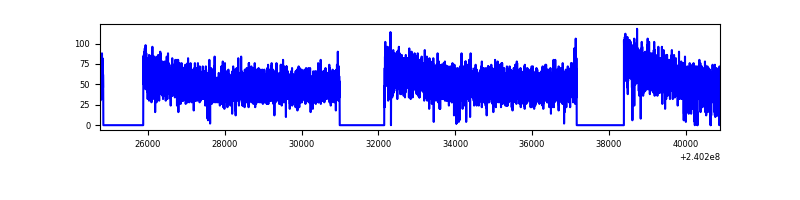 |
Top three noisy pixels from each quadrant. If the there are fewer than three noisy pixels in the level2.evt file, extra rows are filled as -1
| Pixel properties | Quadrant properties | ||||||
|---|---|---|---|---|---|---|---|
| Quadrant | DetID | PixID | Counts | Sigma | Mean | Median | Sigma |
| A | 0 | 29 | 757 | 10.85 | 204 | 193 | 52.0 |
| A | 7 | 110 | 650 | 8.79 | 204 | 193 | 52.0 |
| A | 9 | 19 | 617 | 8.15 | 204 | 193 | 52.0 |
| B | 2 | 9 | 628 | 10.55 | 198 | 189 | 41.6 |
| B | 3 | 80 | 493 | 7.3 | 198 | 189 | 41.6 |
| B | 2 | 8 | 481 | 7.01 | 198 | 189 | 41.6 |
| C | 1 | 80 | 569 | 7.08 | 202 | 190 | 53.5 |
| C | 1 | 81 | 532 | 6.39 | 202 | 190 | 53.5 |
| C | 3 | 126 | 526 | 6.28 | 202 | 190 | 53.5 |
| D | 6 | 231 | 507 | 6.43 | 188 | 172 | 52.1 |
| D | 10 | 189 | 506 | 6.41 | 188 | 172 | 52.1 |
| D | 6 | 83 | 499 | 6.28 | 188 | 172 | 52.1 |
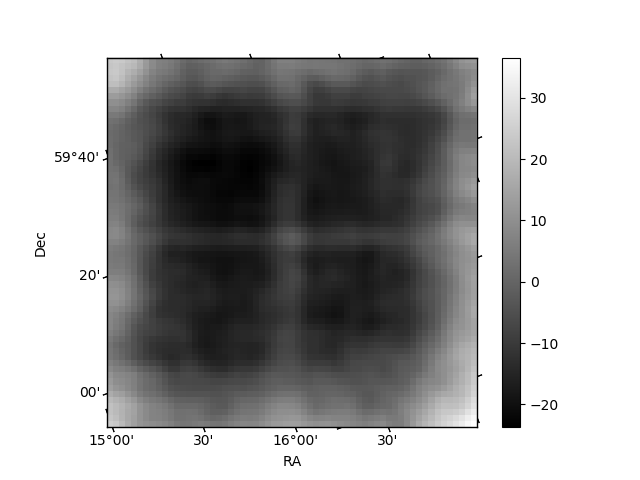
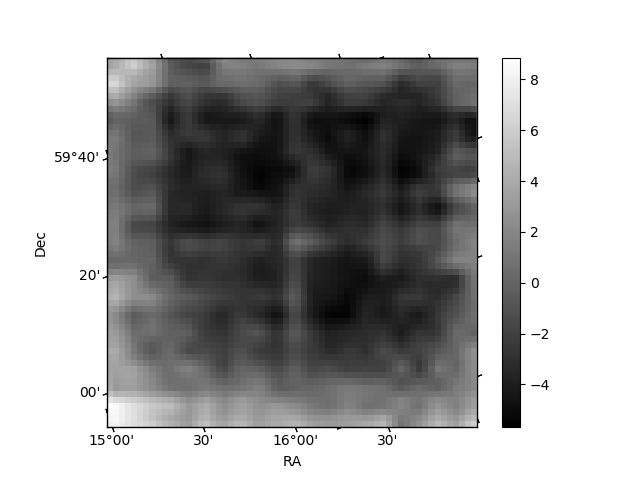
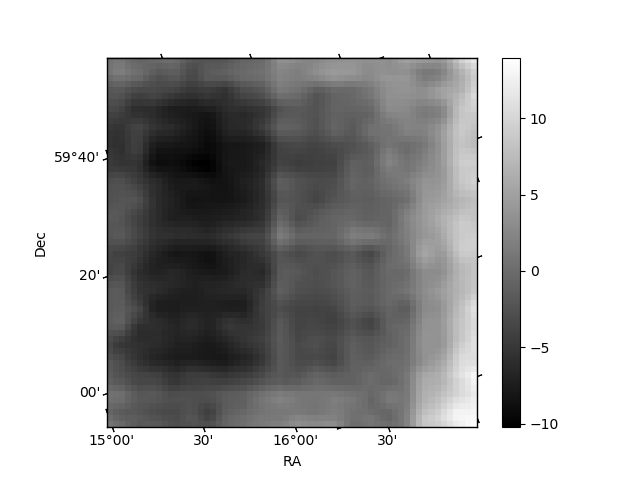
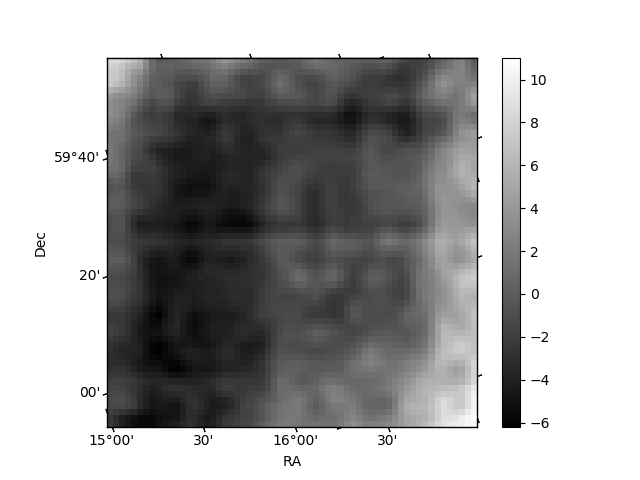
Histogram calculated using DETX and DETY for each event in the final _common_clean file
| Quadrant A | 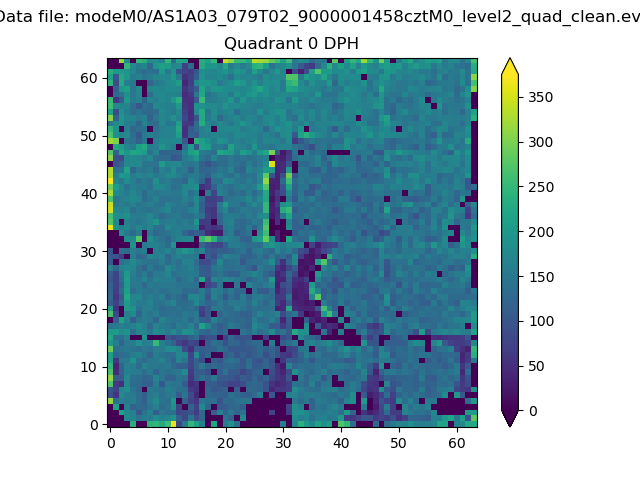 |
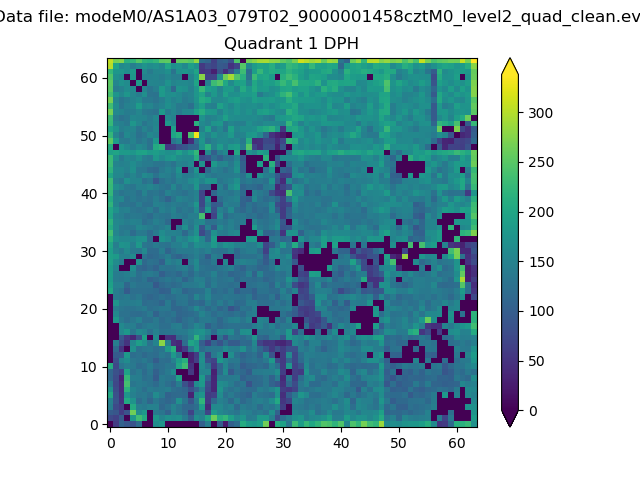 |
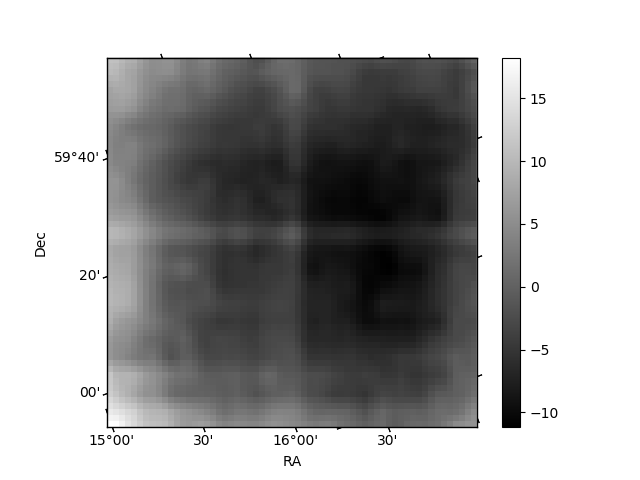
Quadrant B |
|---|---|---|---|
| Quadrant D | 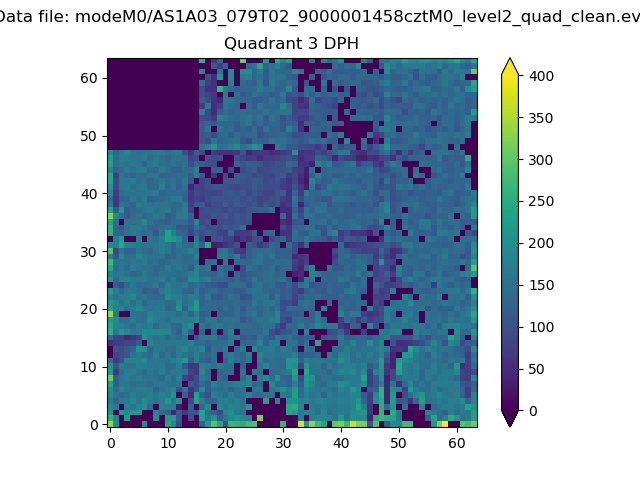 |
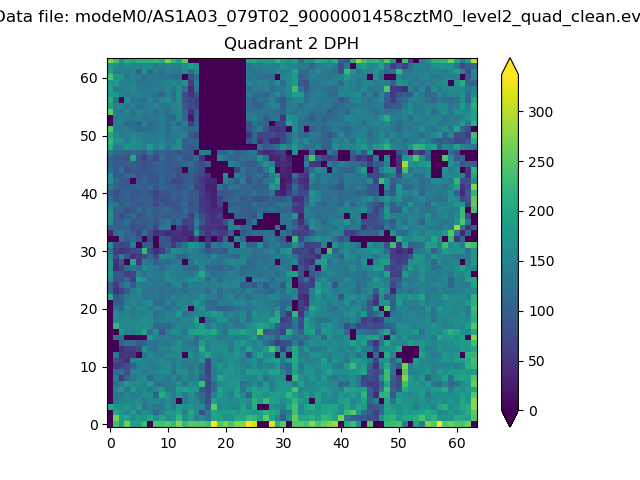 |
Quadrant C |
| Plot type | Count rate plots | Images |
|---|---|---|
| Comparison with Poisson distribution Blue bars denote a histogram of data divided into 1 sec bins. Red curve is a Poisson curve with rate = median count rate of data. |
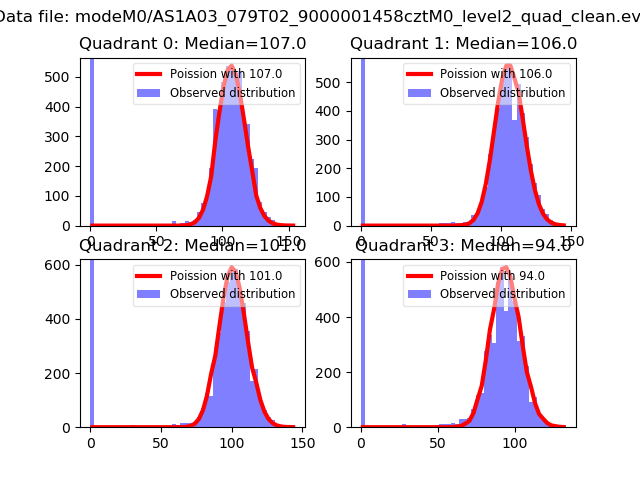 |
 |
| Quadrant-wise count rates Data is divided into 100 sec bins |
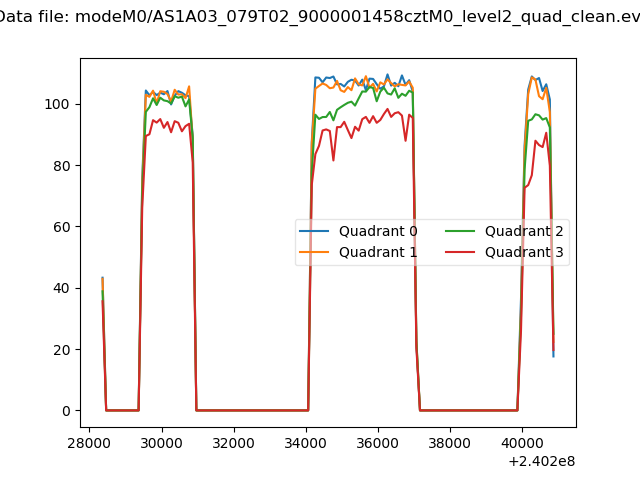 |
|
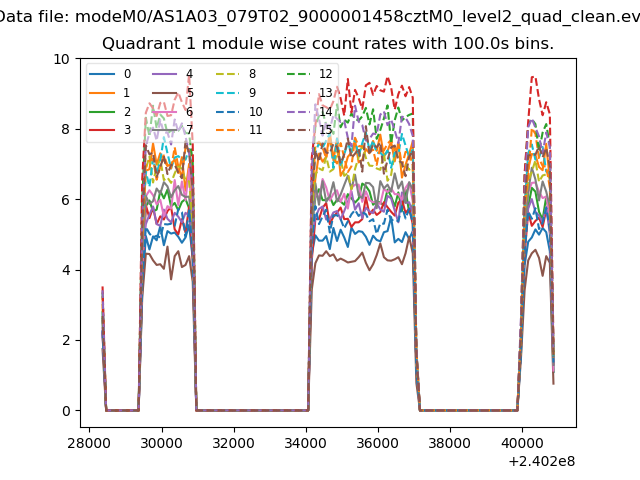
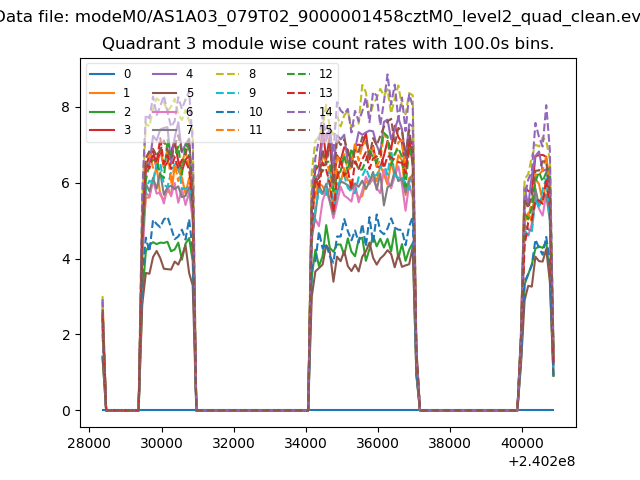
| Module-wise count rates for Quadrant A Data is divided into 100 sec bins |
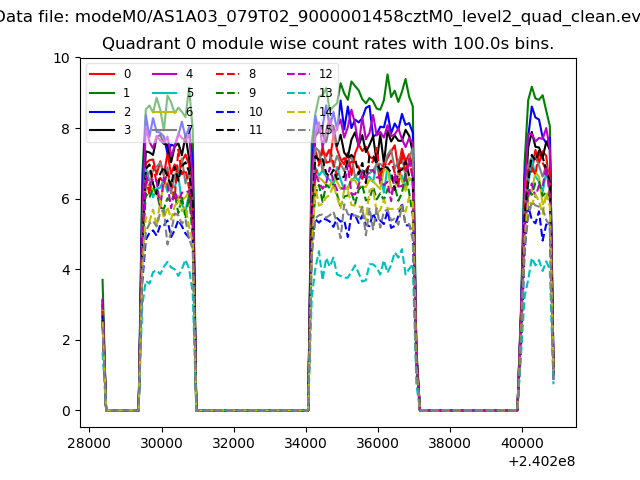 |
 |
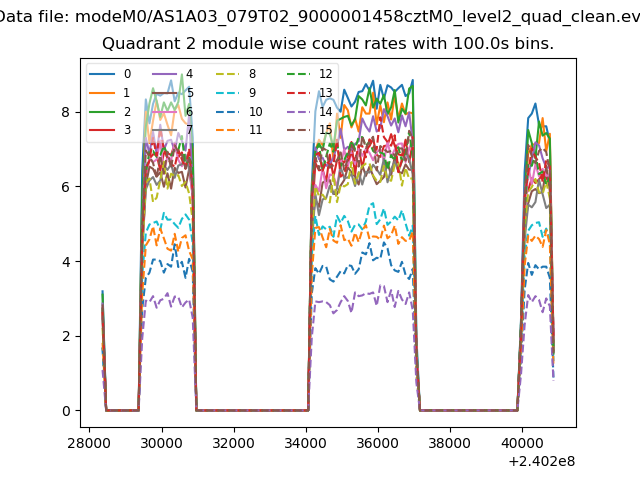
| Module-wise count rates for Quadrant B Data is divided into 100 sec bins |
 |
 |
| Module-wise count rates for Quadrant C Data is divided into 100 sec bins |
 |
 |
| Module-wise count rates for Quadrant D Data is divided into 100 sec bins |
 |
 |
| Parameter | Plot |
|---|---|
| CZT HV Monitor | 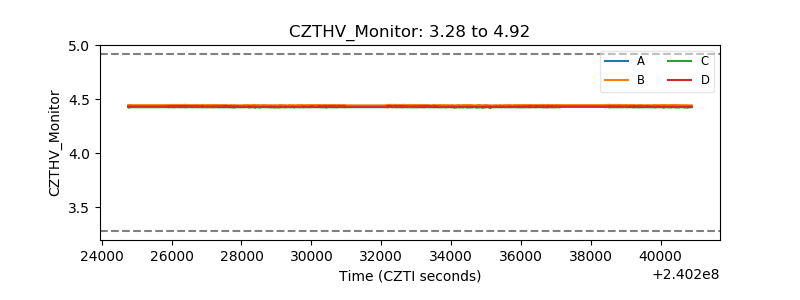 |
| D_VDD | 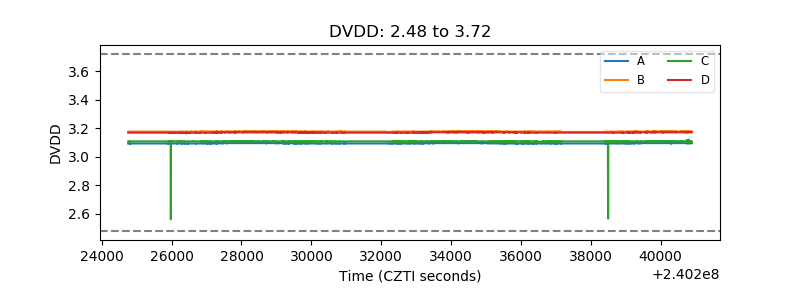 |
| Temperature 1 | 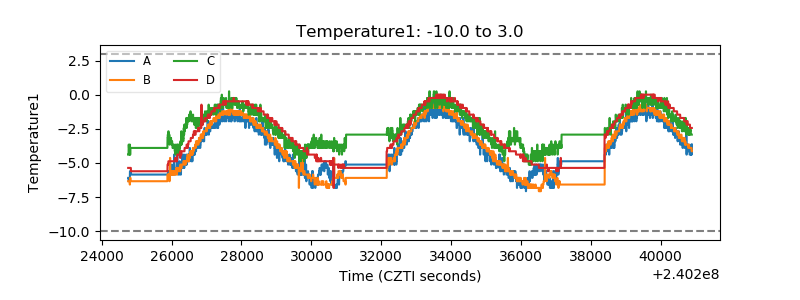 |
| Veto HV Monitor | 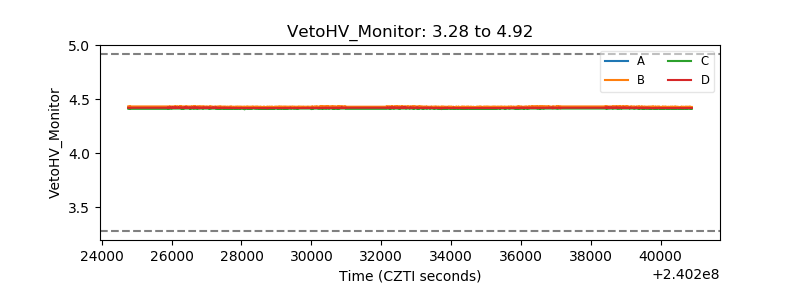 |
| Veto LLD | 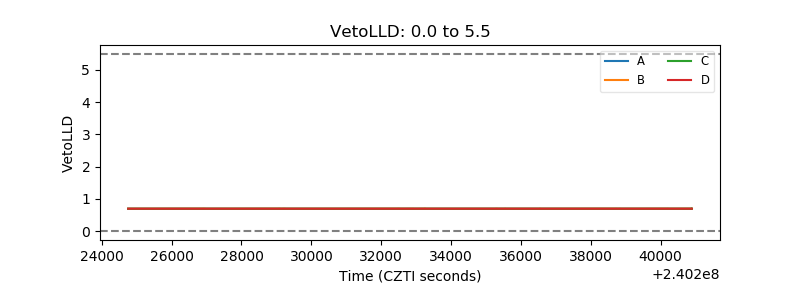 |
| Alpha Counter | 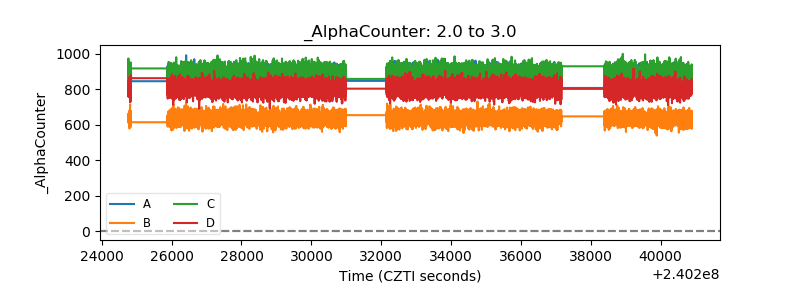 |
| _CPM_Rate | 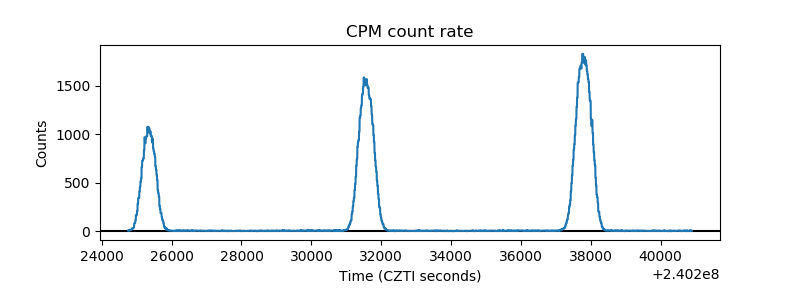 |
| CZT Counter | 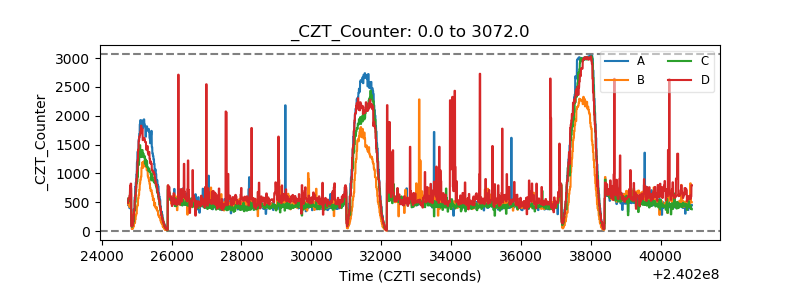 |
| +2.5 Volts monitor | 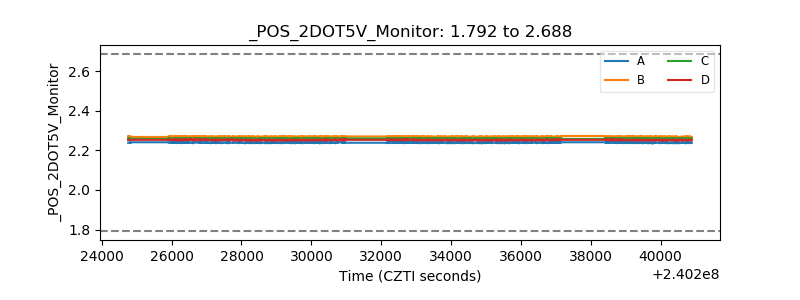 |
| +5 Volts monitor | 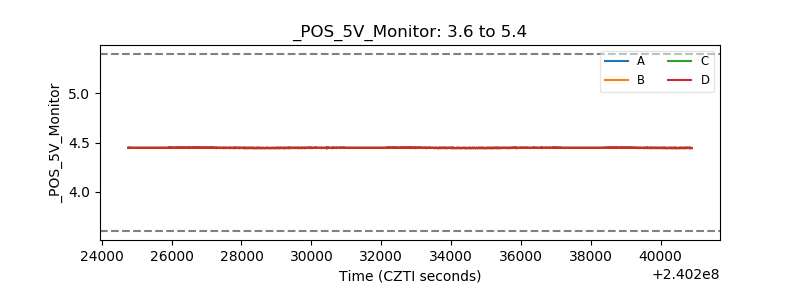 |
| _ROLL_ROT | 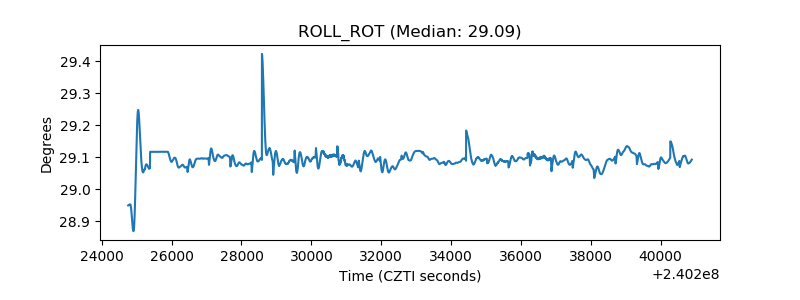 |
| _Roll_DEC | 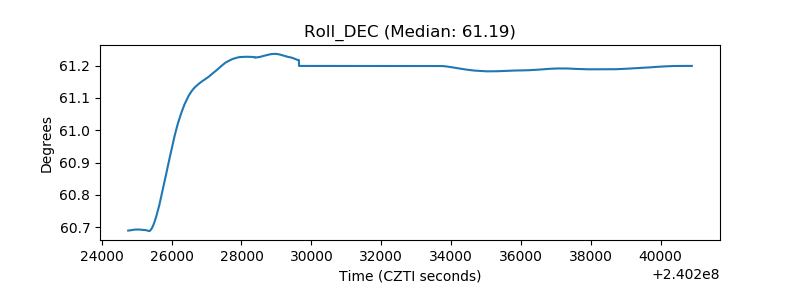 |
| _Roll_RA | 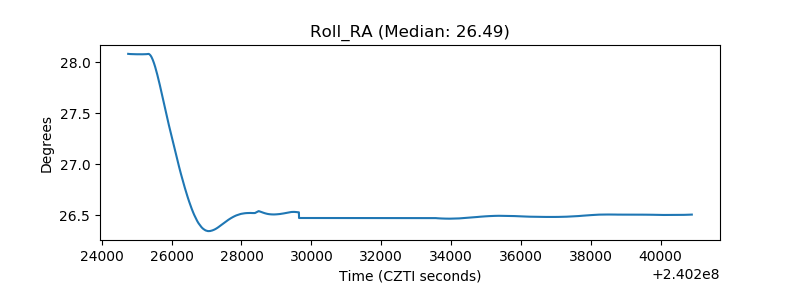 |
| Veto Counter | 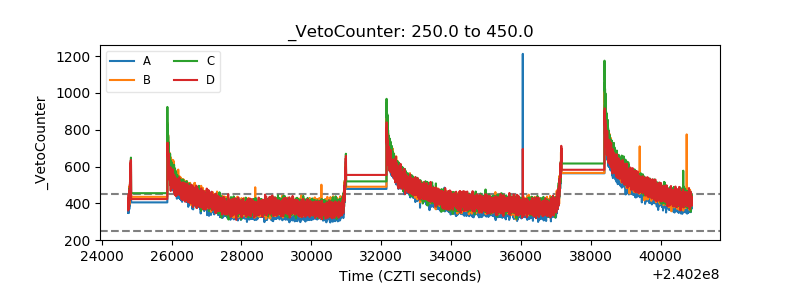 |