| Param | Original file | Final file |
|---|---|---|
| Filename | modeM0/AS1A03_079T02_9000001458_10127cztM0_level2.evt | modeM0/AS1A03_079T02_9000001458_10127cztM0_level2_quad_clean.evt |
| Size (bytes) | 109,964,160 | 24,324,480 |
| Size | 104.9 MB | 23.2 MB |
| Events in quadrant A | 829,804 | 155,087 |
| Events in quadrant B | 774,861 | 159,038 |
| Events in quadrant C | 717,842 | 158,737 |
| Events in quadrant D | 904,131 | 153,171 |
| Mode SS | |||
|---|---|---|---|
| Quadrant | BADHDUFLAG | Total packets | Discarded packets |
| A | 0 | 32 | 0 |
| B | 0 | 32 | 0 |
| C | 0 | 32 | 0 |
| D | 0 | 32 | 0 |
| Mode M0 | |||
|---|---|---|---|
| Quadrant | BADHDUFLAG | Total packets | Discarded packets |
| A | 0 | 3372 | 5 |
| B | 0 | 3161 | 4 |
| C | 0 | 3064 | 3 |
| D | 0 | 3612 | 1 |
| Mode M9 | |||
|---|---|---|---|
| Quadrant | BADHDUFLAG | Total packets | Discarded packets |
| A | 0 | 10 | 0 |
| B | 0 | 10 | 0 |
| C | 0 | 10 | 0 |
| D | 0 | 10 | 0 |
| Quadrant | Total seconds | Saturated seconds | Saturation percentage |
|---|---|---|---|
| A | 1481 | 47 | 3.173531% |
| B | 1480 | 33 | 2.229730% |
| C | 1481 | 15 | 1.012829% |
| D | 1482 | 37 | 2.496626% |
Noise dominated data is calculated using 1-second bins in cleaned event files. If a bin has >2000 counts, and if more than 50% of those come from <1% of pixels, then it is considered to be noise-dominated and hence unusable.
| Quadrant | # 1 sec bins | Bins with >0 counts | Bins with >2000 counts | High rate bins dominated by noise | Noise dominated (total time) | Noise dominated (detector-on time) | Marked lightcurve |
|---|---|---|---|---|---|---|---|
| A | 2522 | 1482 | 4 | 4 | 0.16% | 0.27% | 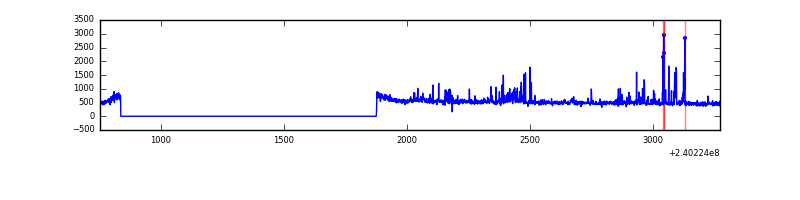 |
| B | 2522 | 1482 | 0 | 0 | 0.00% | 0.00% | 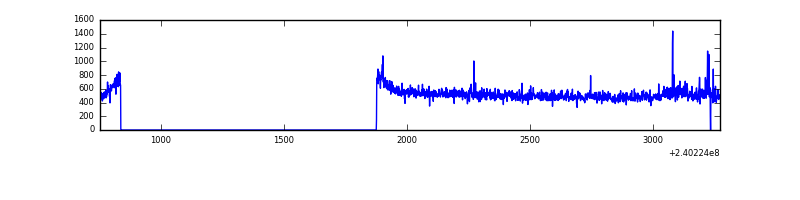 |
| C | 2522 | 1483 | 0 | 0 | 0.00% | 0.00% |  |
| D | 2522 | 1483 | 10 | 10 | 0.40% | 0.67% | 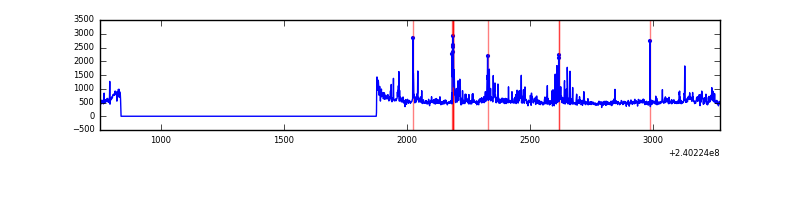 |
Top three noisy pixels from each quadrant. If the there are fewer than three noisy pixels in the level2.evt file, extra rows are filled as -1
| Pixel properties | Quadrant properties | ||||||
|---|---|---|---|---|---|---|---|
| Quadrant | DetID | PixID | Counts | Sigma | Mean | Median | Sigma |
| A | 13 | 248 | 78669 | 1885.6 | 194 | 189 | 41.6 |
| A | 8 | 5 | 3269 | 74.0 | 194 | 189 | 41.6 |
| A | 0 | 226 | 1792 | 38.51 | 194 | 189 | 41.6 |
| B | 0 | 214 | 18974 | 477.21 | 192 | 187 | 39.4 |
| B | 12 | 111 | 4205 | 102.06 | 192 | 187 | 39.4 |
| B | 11 | 111 | 3380 | 81.1 | 192 | 187 | 39.4 |
| C | 13 | 61 | 1422 | 28.25 | 183 | 184 | 43.8 |
| C | 14 | 234 | 789 | 13.81 | 183 | 184 | 43.8 |
| C | 14 | 67 | 557 | 8.51 | 183 | 184 | 43.8 |
| D | 4 | 95 | 77759 | 1735.5 | 184 | 179 | 44.7 |
| D | 2 | 136 | 56790 | 1266.41 | 184 | 179 | 44.7 |
| D | 8 | 195 | 40241 | 896.2 | 184 | 179 | 44.7 |
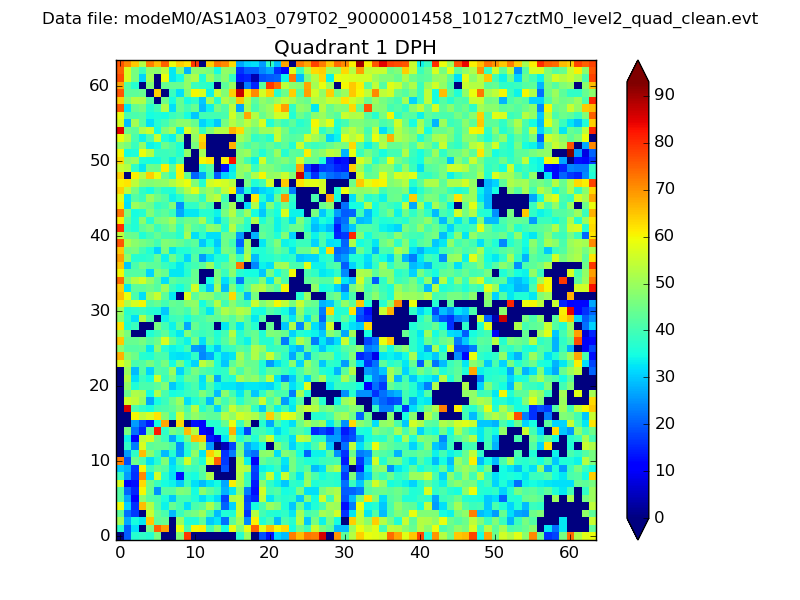
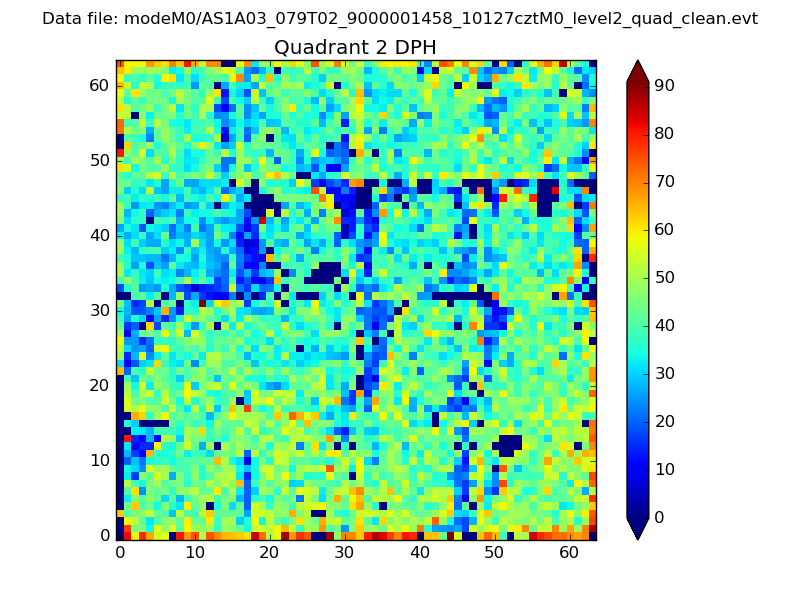
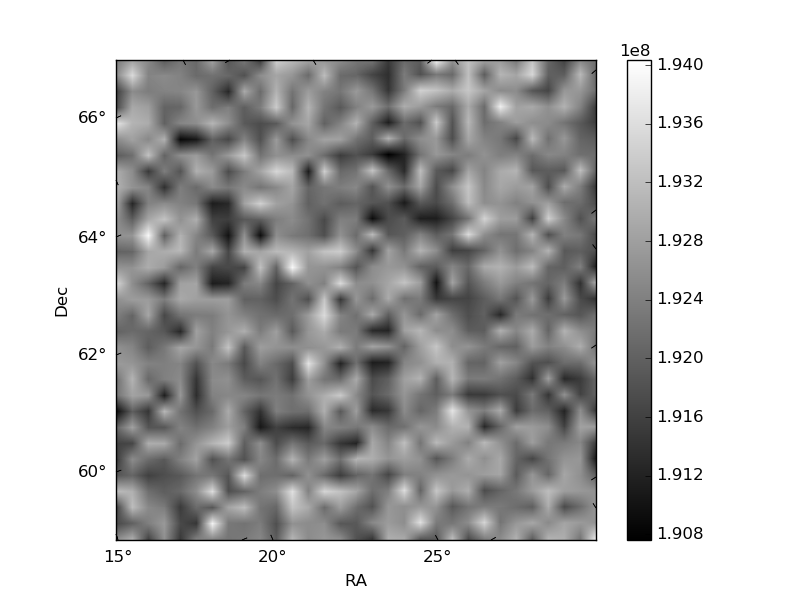
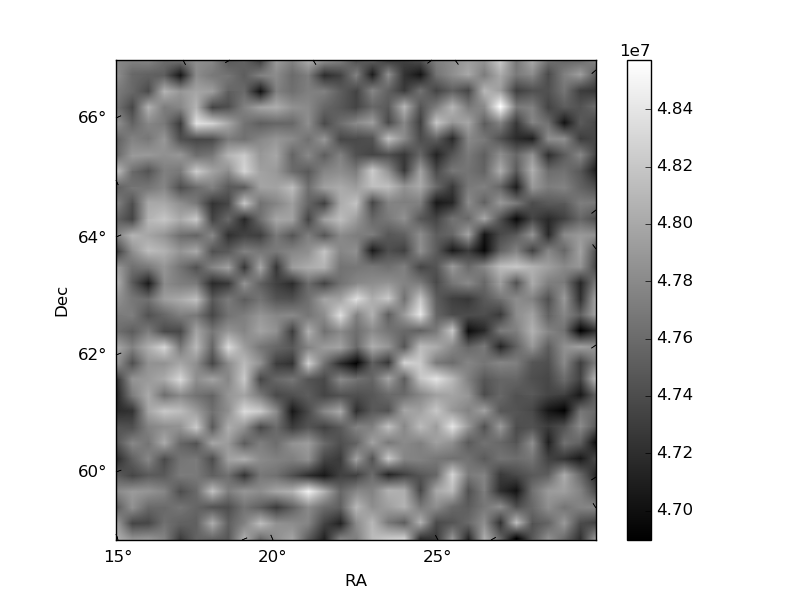
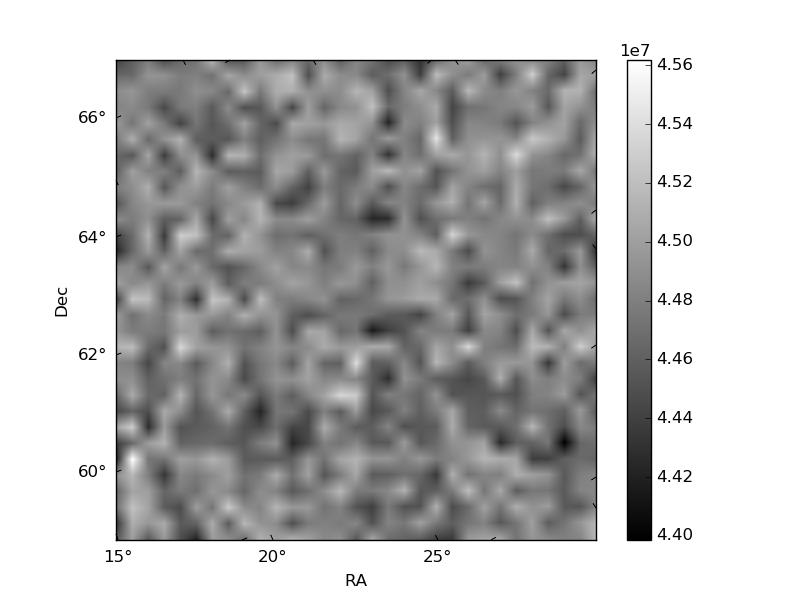
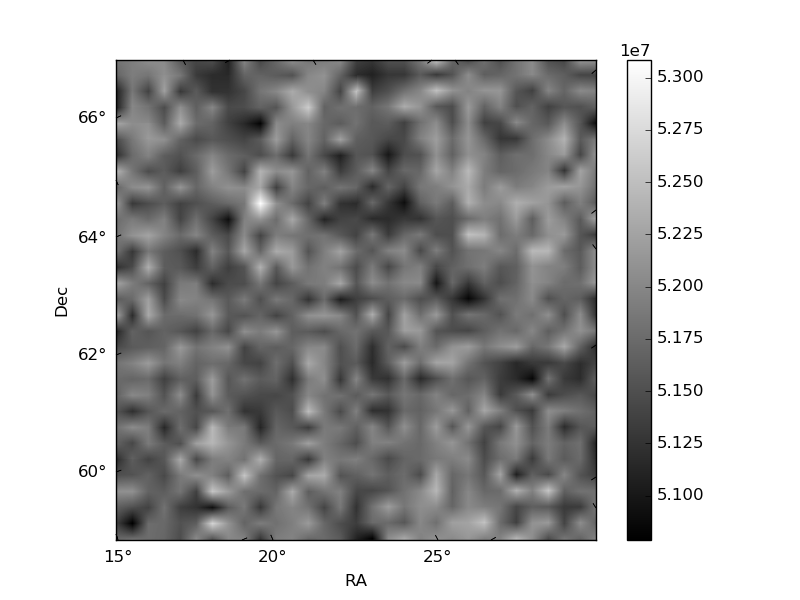
Histogram calculated using DETX and DETY for each event in the final _common_clean file
| Quadrant A | 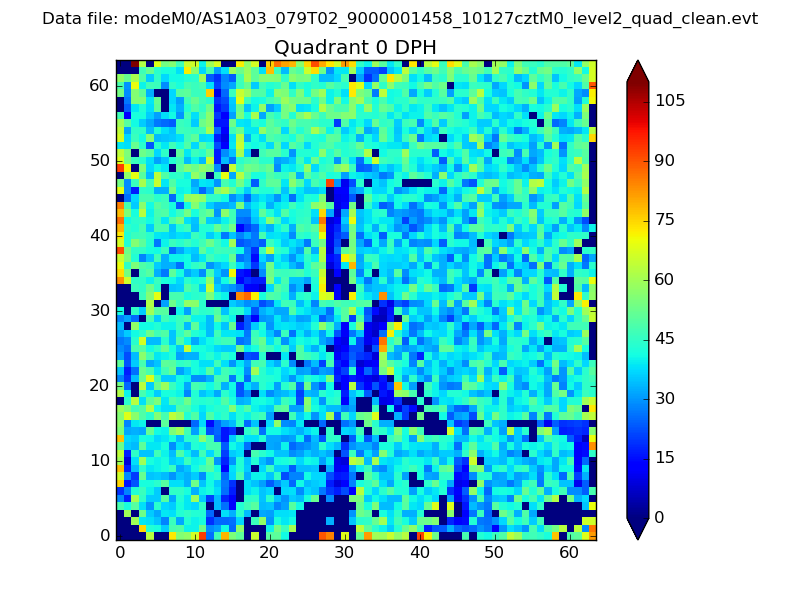 |
 |
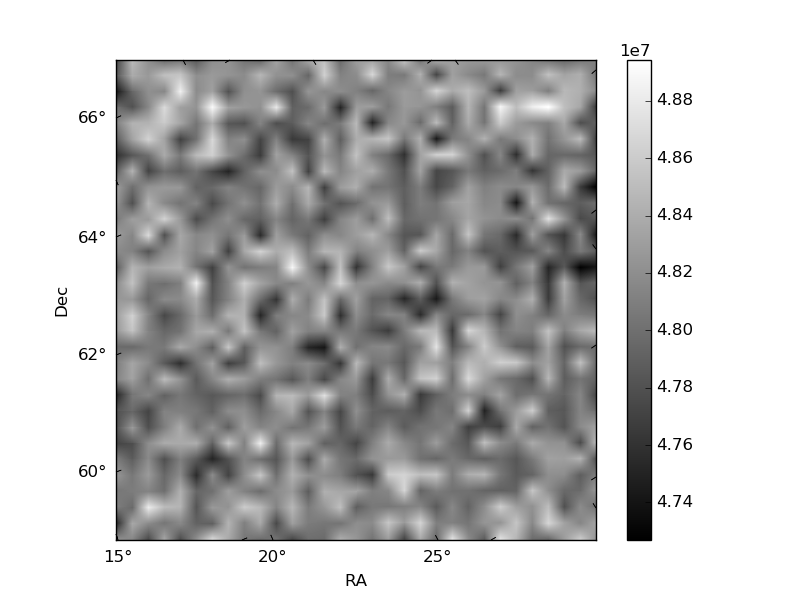
Quadrant B |
|---|---|---|---|
| Quadrant D | 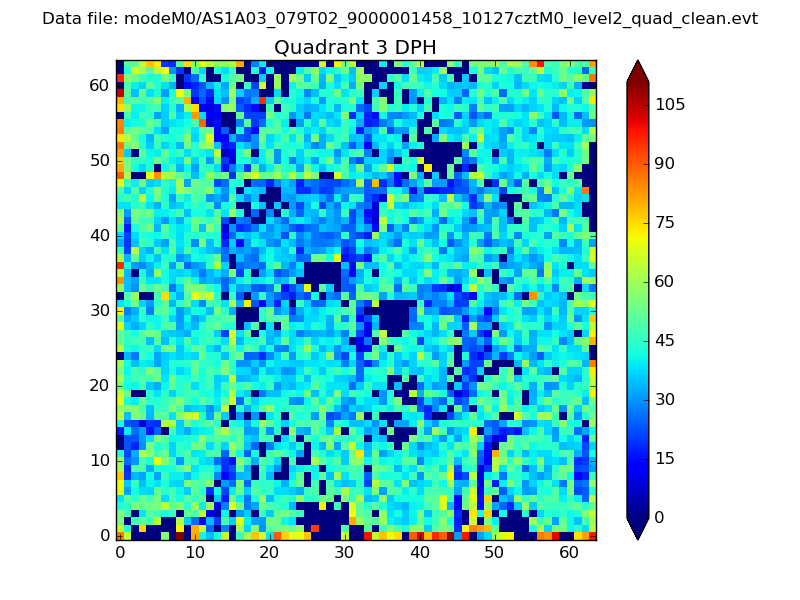 |
 |
Quadrant C |
| Plot type | Count rate plots | Images |
|---|---|---|
| Comparison with Poisson distribution Blue bars denote a histogram of data divided into 1 sec bins. Red curve is a Poisson curve with rate = median count rate of data. |
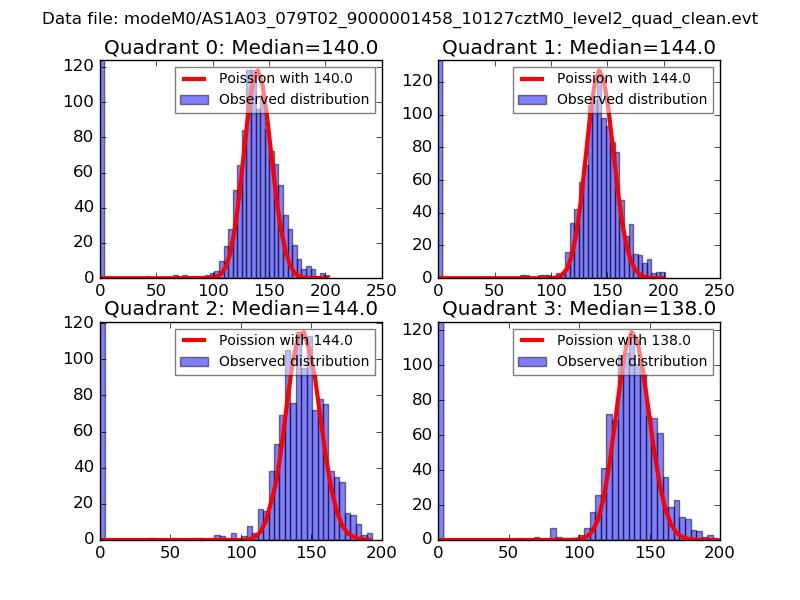 |
 |
| Quadrant-wise count rates Data is divided into 100 sec bins |
 |
|
| Module-wise count rates for Quadrant A Data is divided into 100 sec bins |
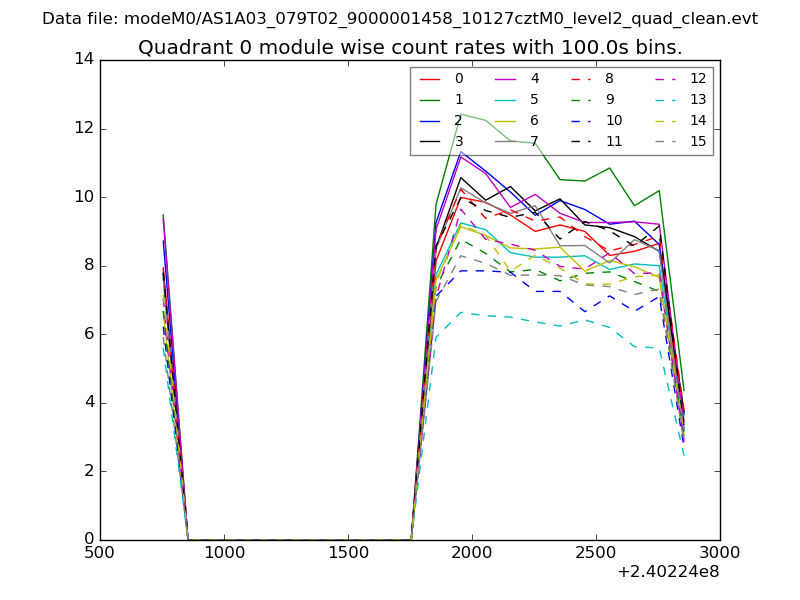 |
 |
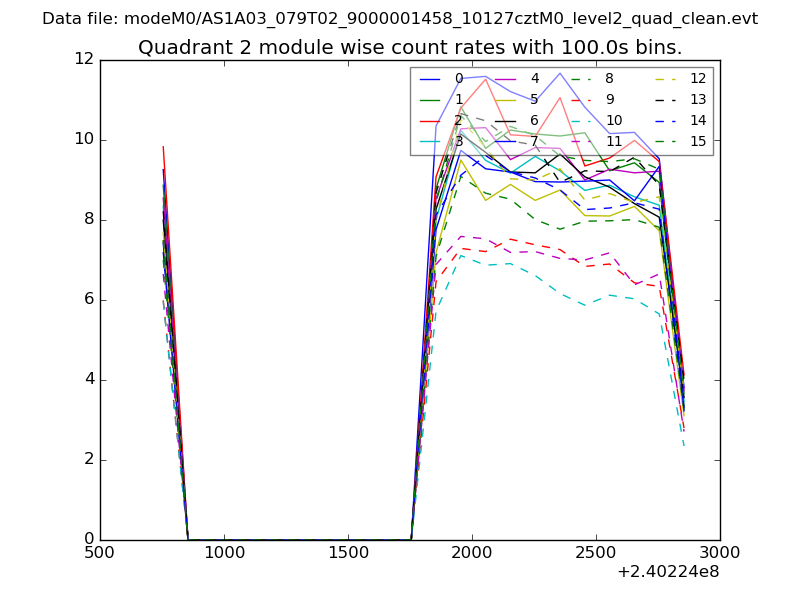
| Module-wise count rates for Quadrant B Data is divided into 100 sec bins |
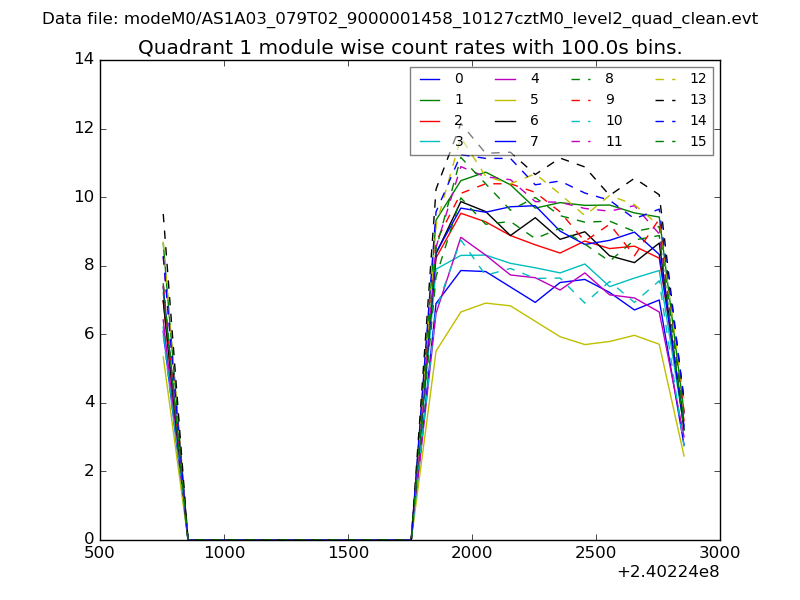 |
 |
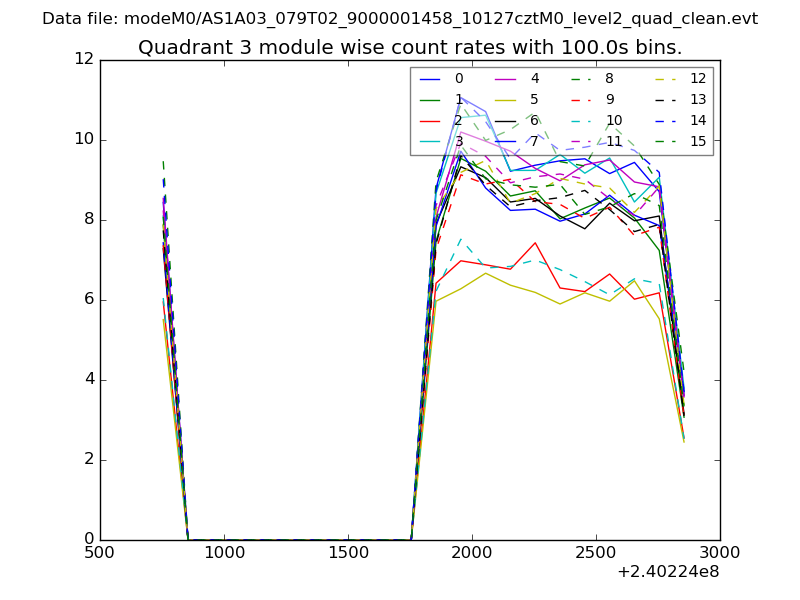
| Module-wise count rates for Quadrant C Data is divided into 100 sec bins |
 |
 |
| Module-wise count rates for Quadrant D Data is divided into 100 sec bins |
 |
 |
| Parameter | Plot |
|---|---|
| CZT HV Monitor | 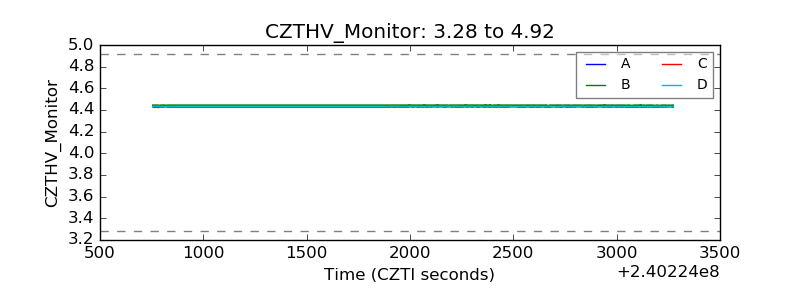 |
| D_VDD | 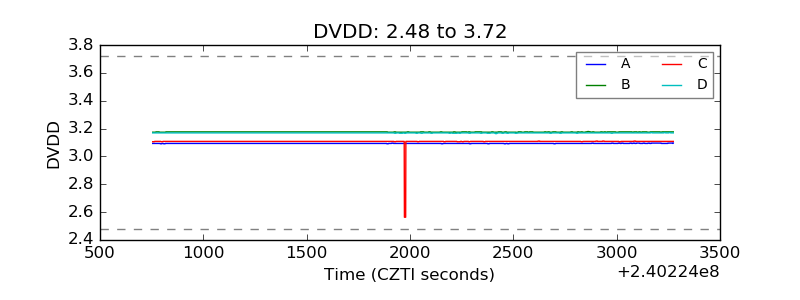 |
| Temperature 1 | 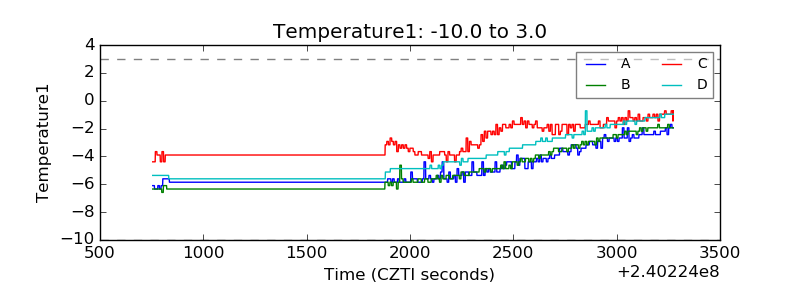 |
| Veto HV Monitor | 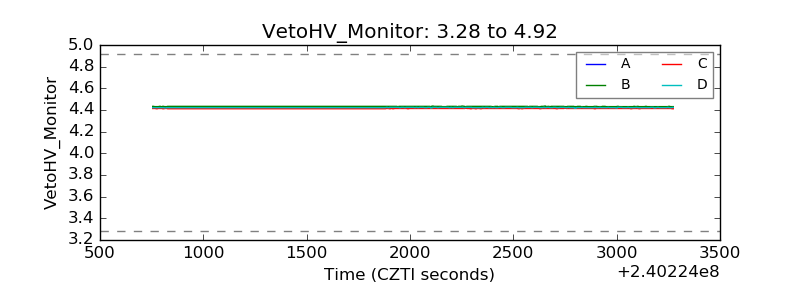 |
| Veto LLD |  |
| Alpha Counter | 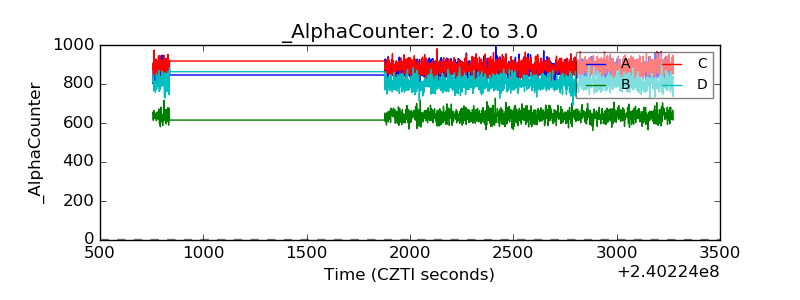 |
| _CPM_Rate | 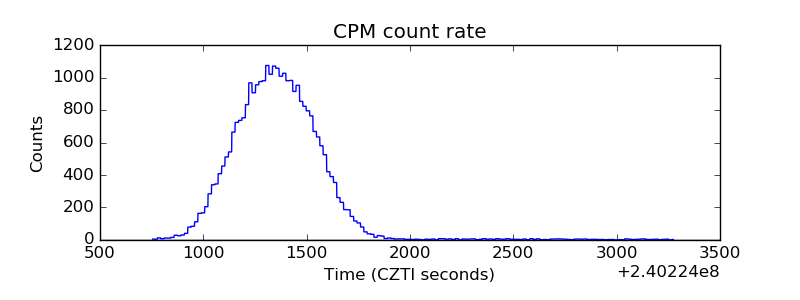 |
| CZT Counter | 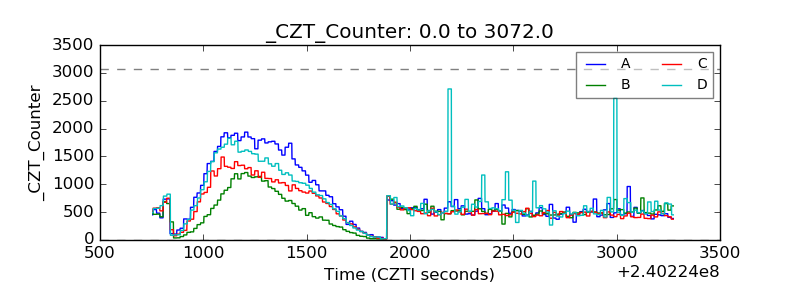 |
| +2.5 Volts monitor |  |
| +5 Volts monitor |  |
| _ROLL_ROT | 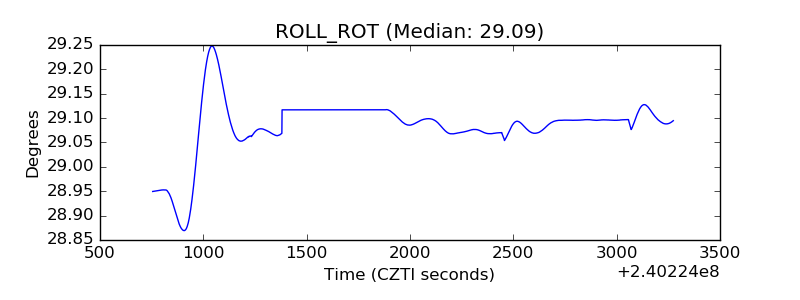 |
| _Roll_DEC | 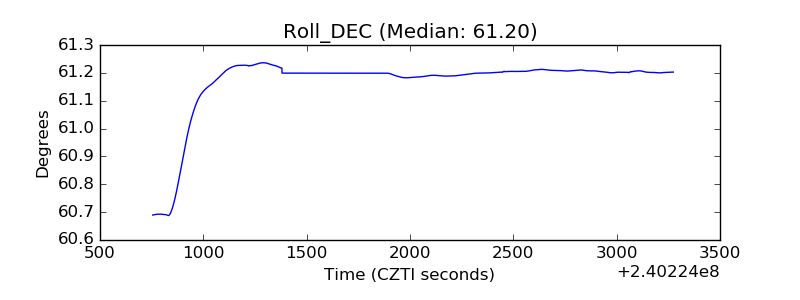 |
| _Roll_RA | 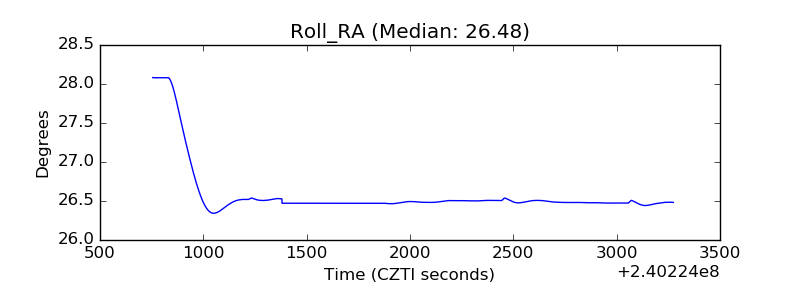 |
| Veto Counter | 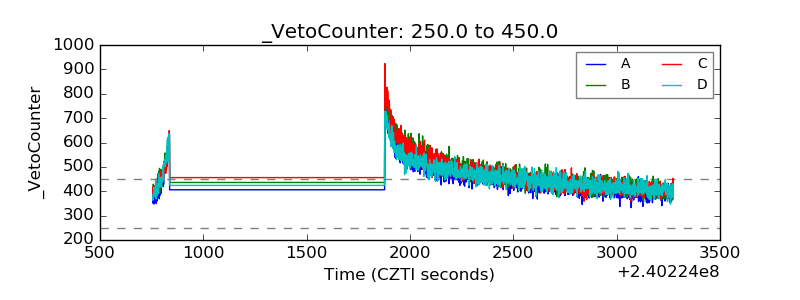 |