| Param | Original file | Final file |
|---|---|---|
| Filename | modeM0/AS1A03_079T02_9000001458_10129cztM0_level2.evt | modeM0/AS1A03_079T02_9000001458_10129cztM0_level2_quad_clean.evt |
| Size (bytes) | 460,255,680 | 89,881,920 |
| Size | 438.9 MB | 85.7 MB |
| Events in quadrant A | 3,248,177 | 570,457 |
| Events in quadrant B | 3,330,618 | 575,917 |
| Events in quadrant C | 3,008,675 | 570,740 |
| Events in quadrant D | 3,907,943 | 549,560 |
| Mode SS | |||
|---|---|---|---|
| Quadrant | BADHDUFLAG | Total packets | Discarded packets |
| A | 0 | 132 | 0 |
| B | 0 | 132 | 0 |
| C | 0 | 132 | 0 |
| D | 0 | 132 | 0 |
| Mode M0 | |||
|---|---|---|---|
| Quadrant | BADHDUFLAG | Total packets | Discarded packets |
| A | 0 | 13921 | 3 |
| B | 0 | 13942 | 2 |
| C | 0 | 13309 | 2 |
| D | 0 | 15494 | 2 |
| Mode M9 | |||
|---|---|---|---|
| Quadrant | BADHDUFLAG | Total packets | Discarded packets |
| A | 0 | 12 | 0 |
| B | 0 | 12 | 0 |
| C | 0 | 12 | 0 |
| D | 0 | 12 | 0 |
| Quadrant | Total seconds | Saturated seconds | Saturation percentage |
|---|---|---|---|
| A | 6528 | 76 | 1.164216% |
| B | 6528 | 62 | 0.949755% |
| C | 6528 | 32 | 0.490196% |
| D | 6528 | 119 | 1.822917% |
Noise dominated data is calculated using 1-second bins in cleaned event files. If a bin has >2000 counts, and if more than 50% of those come from <1% of pixels, then it is considered to be noise-dominated and hence unusable.
| Quadrant | # 1 sec bins | Bins with >0 counts | Bins with >2000 counts | High rate bins dominated by noise | Noise dominated (total time) | Noise dominated (detector-on time) | Marked lightcurve |
|---|---|---|---|---|---|---|---|
| A | 7688 | 6528 | 19 | 19 | 0.25% | 0.29% |  |
| B | 7688 | 6528 | 4 | 4 | 0.05% | 0.06% | 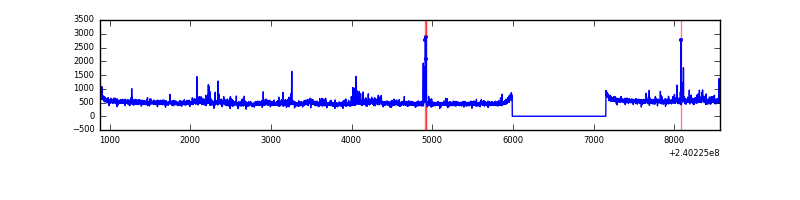 |
| C | 7688 | 6529 | 0 | 0 | 0.00% | 0.00% | 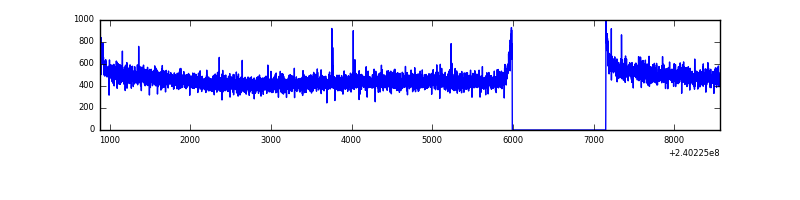 |
| D | 7688 | 6528 | 68 | 68 | 0.88% | 1.04% | 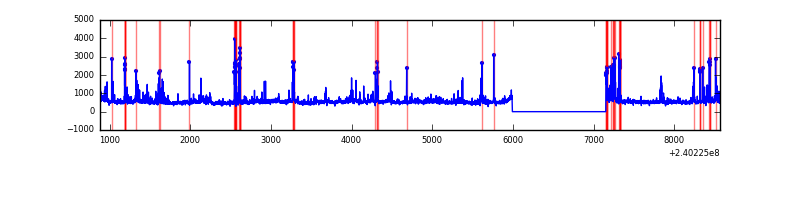 |
Top three noisy pixels from each quadrant. If the there are fewer than three noisy pixels in the level2.evt file, extra rows are filled as -1
| Pixel properties | Quadrant properties | ||||||
|---|---|---|---|---|---|---|---|
| Quadrant | DetID | PixID | Counts | Sigma | Mean | Median | Sigma |
| A | 15 | 174 | 81801 | 503.93 | 800 | 784 | 160.8 |
| A | 13 | 248 | 79408 | 489.05 | 800 | 784 | 160.8 |
| A | 3 | 1 | 7553 | 42.1 | 800 | 784 | 160.8 |
| B | 0 | 214 | 64113 | 418.59 | 796 | 777 | 151.3 |
| B | 0 | 219 | 56434 | 367.84 | 796 | 777 | 151.3 |
| B | 4 | 239 | 36111 | 233.52 | 796 | 777 | 151.3 |
| C | 14 | 67 | 9584 | 50.12 | 767 | 772 | 175.8 |
| C | 13 | 61 | 5850 | 28.88 | 767 | 772 | 175.8 |
| C | 3 | 254 | 3421 | 15.07 | 767 | 772 | 175.8 |
| D | 8 | 195 | 339374 | 1698.75 | 760 | 746 | 199.3 |
| D | 4 | 95 | 135136 | 674.18 | 760 | 746 | 199.3 |
| D | 2 | 136 | 112517 | 560.71 | 760 | 746 | 199.3 |
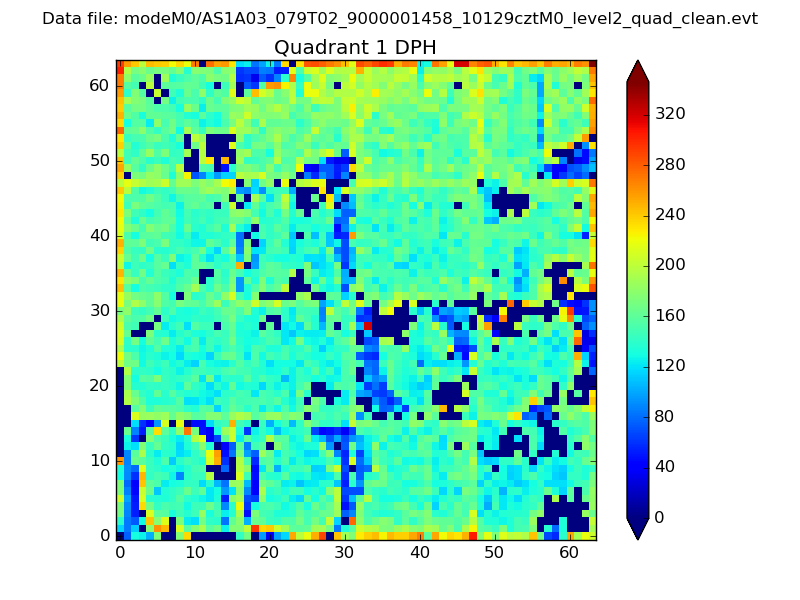
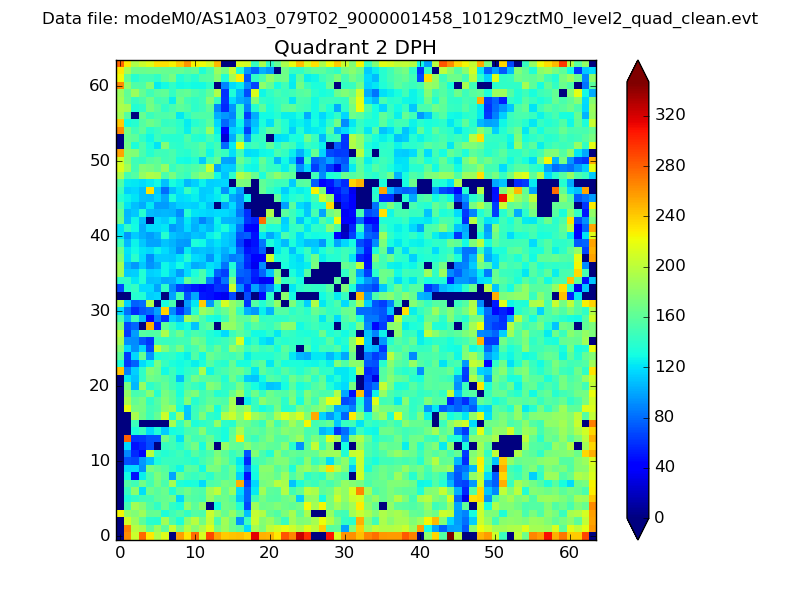
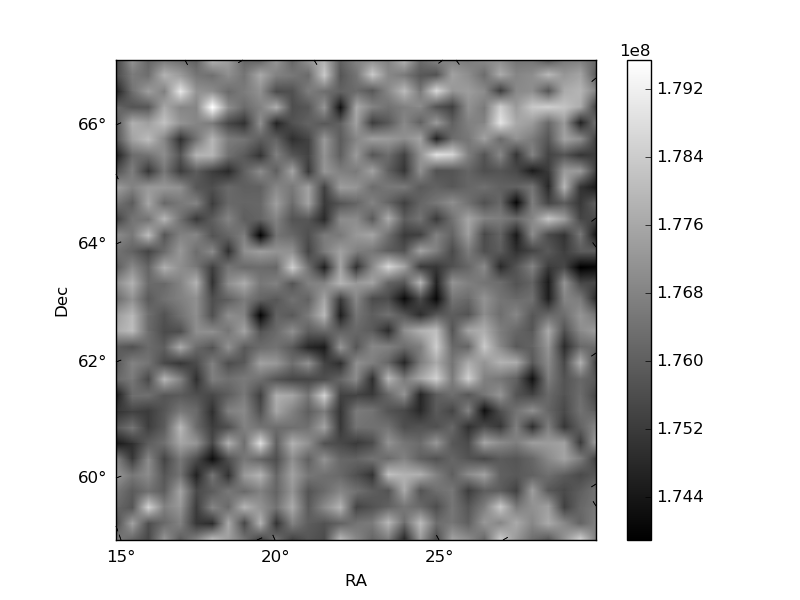
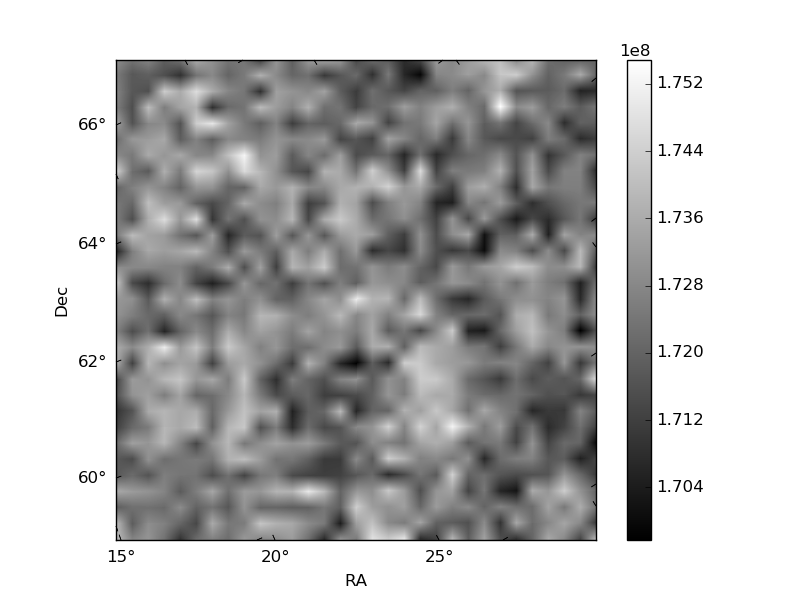
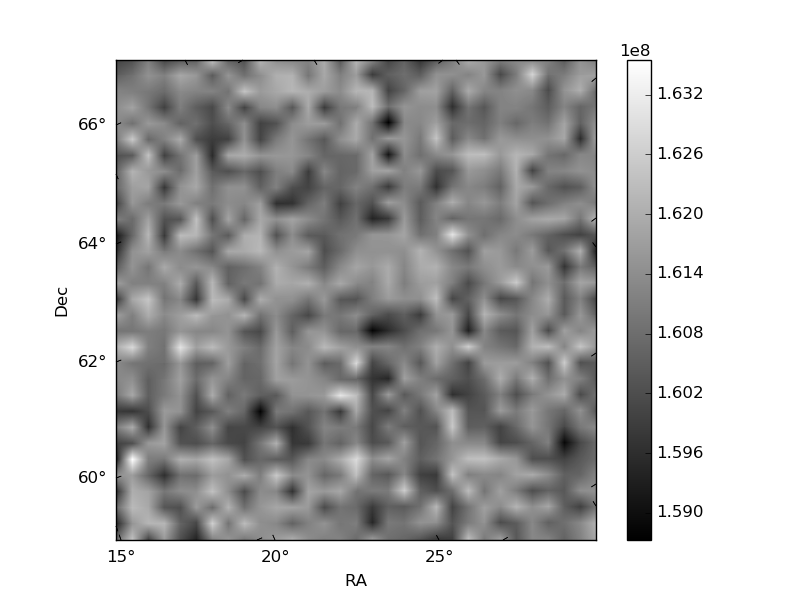
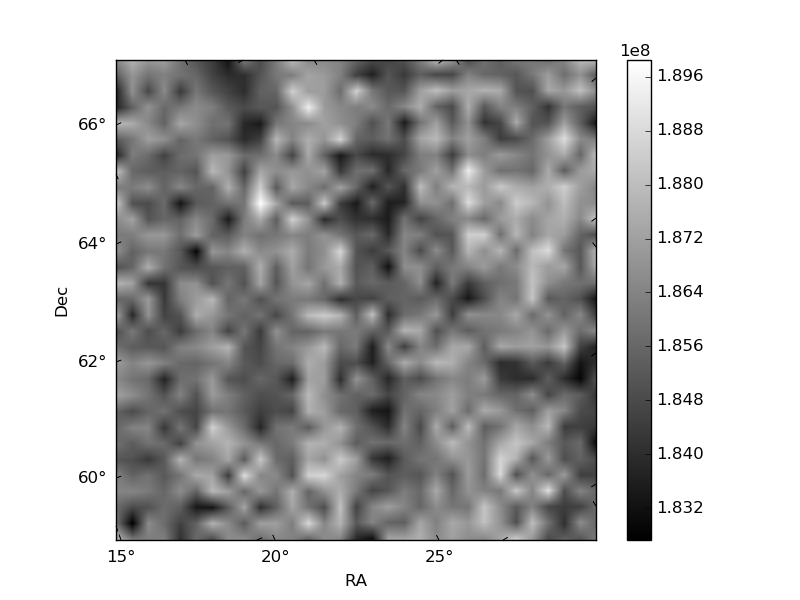
Histogram calculated using DETX and DETY for each event in the final _common_clean file
| Quadrant A | 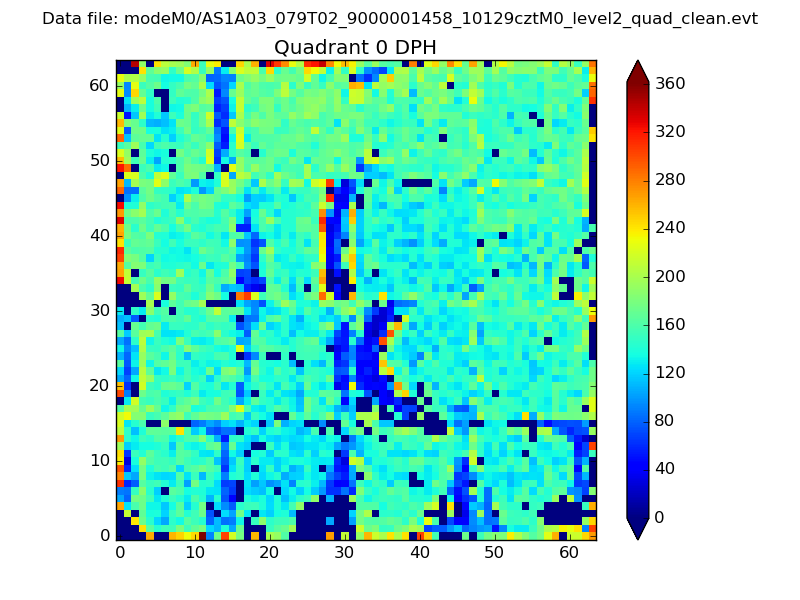 |
 |
Quadrant B |
|---|---|---|---|
| Quadrant D |  |
 |
Quadrant C |
| Plot type | Count rate plots | Images |
|---|---|---|
| Comparison with Poisson distribution Blue bars denote a histogram of data divided into 1 sec bins. Red curve is a Poisson curve with rate = median count rate of data. |
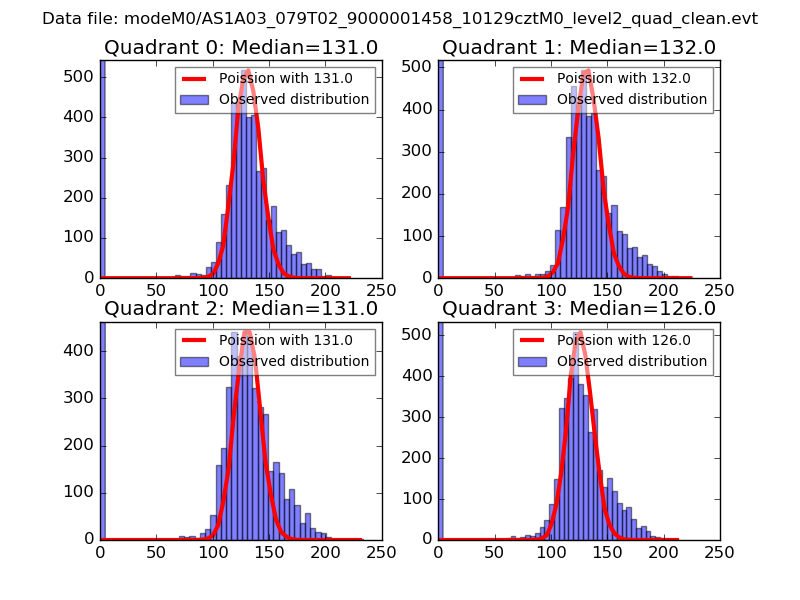 |
 |
| Quadrant-wise count rates Data is divided into 100 sec bins |
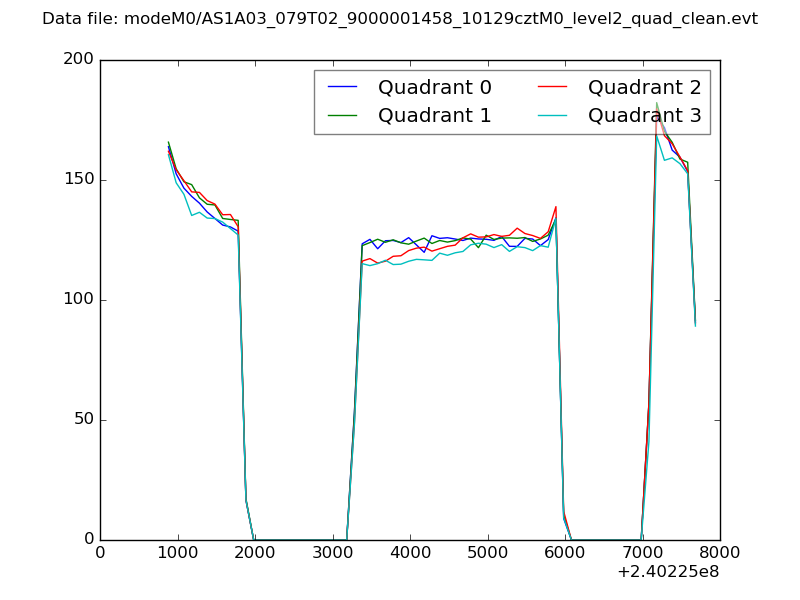 |
|
| Module-wise count rates for Quadrant A Data is divided into 100 sec bins |
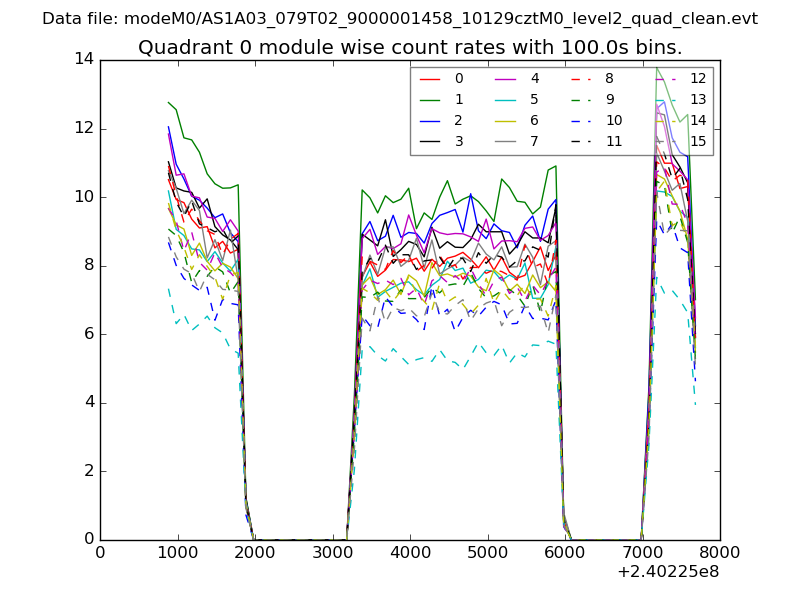 |
 |
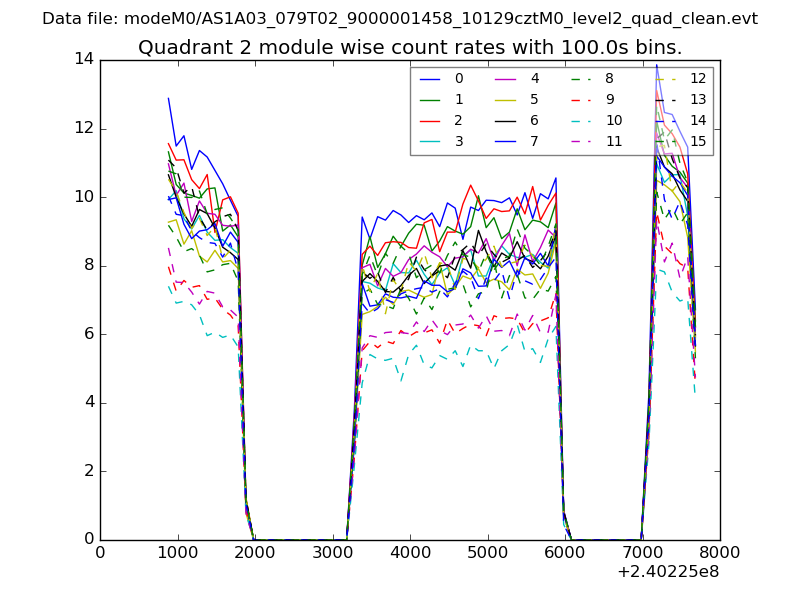
| Module-wise count rates for Quadrant B Data is divided into 100 sec bins |
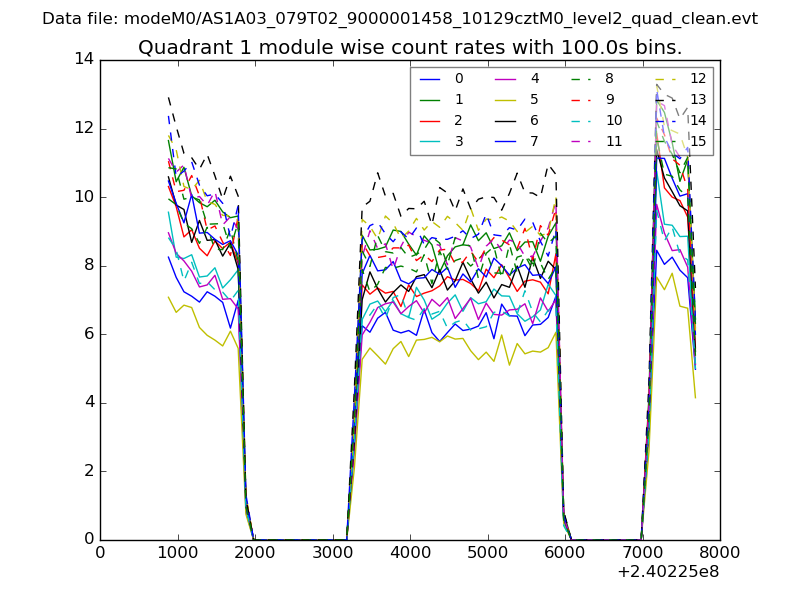 |
 |
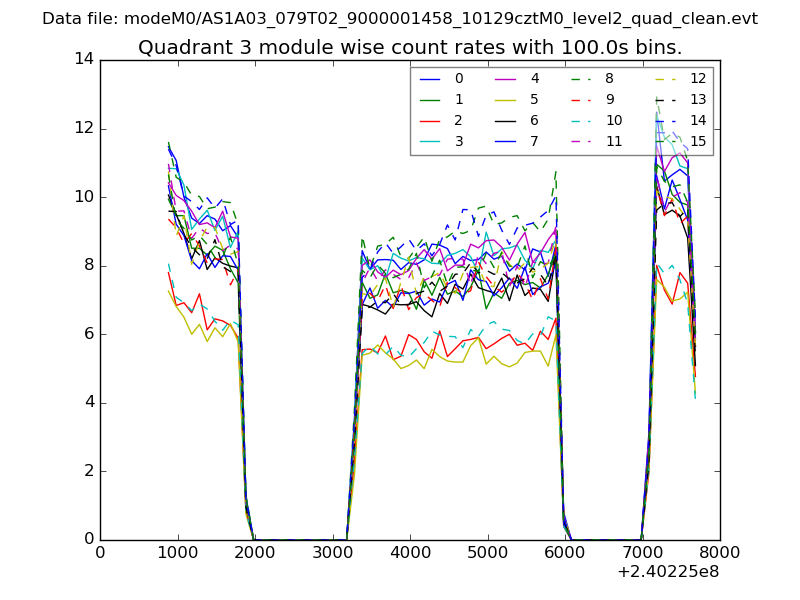
| Module-wise count rates for Quadrant C Data is divided into 100 sec bins |
 |
 |
| Module-wise count rates for Quadrant D Data is divided into 100 sec bins |
 |
 |
| Parameter | Plot |
|---|---|
| CZT HV Monitor | 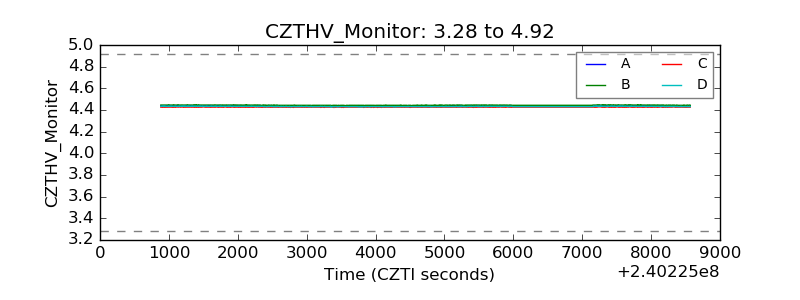 |
| D_VDD | 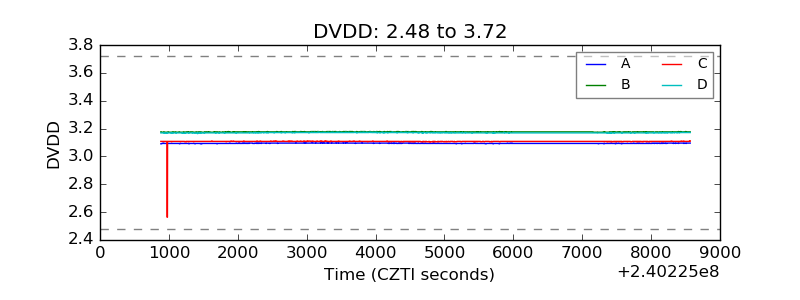 |
| Temperature 1 | 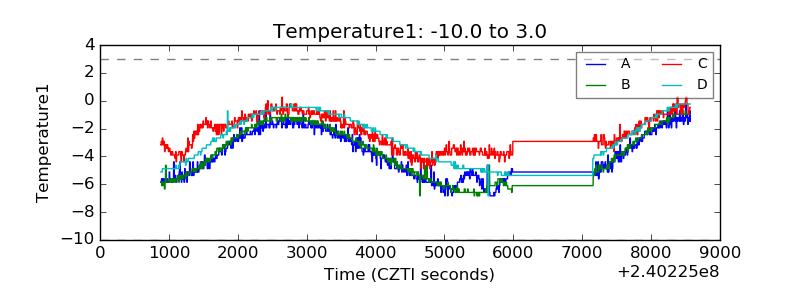 |
| Veto HV Monitor | 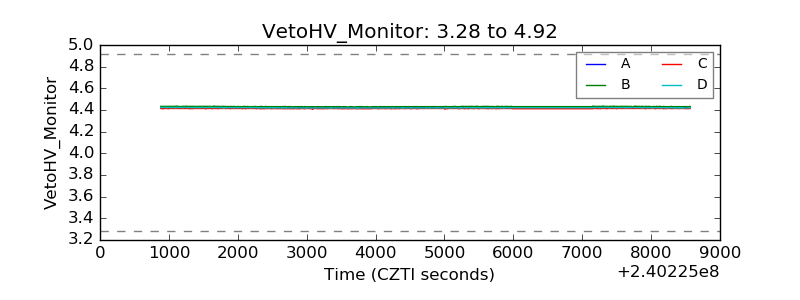 |
| Veto LLD |  |
| Alpha Counter | 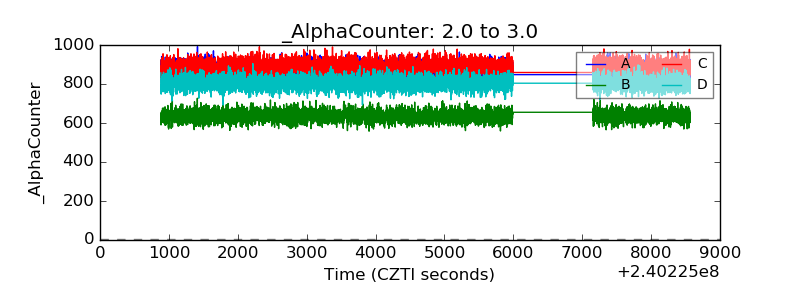 |
| _CPM_Rate | 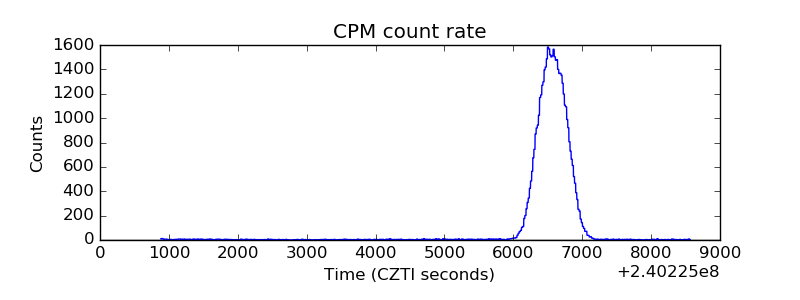 |
| CZT Counter | 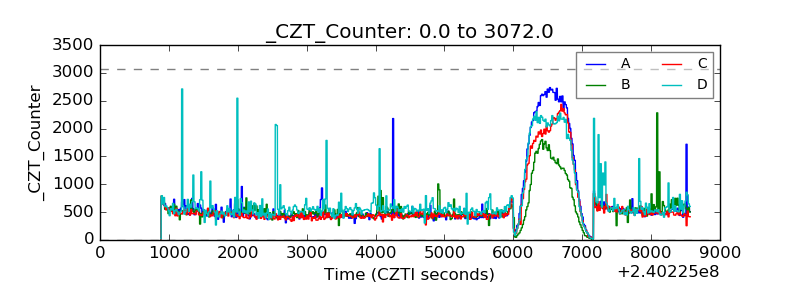 |
| +2.5 Volts monitor |  |
| +5 Volts monitor |  |
| _ROLL_ROT | 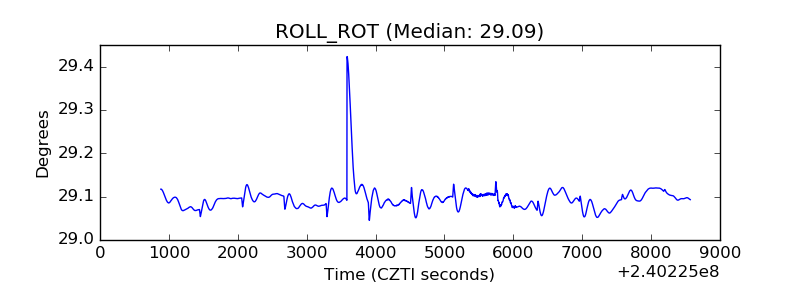 |
| _Roll_DEC | 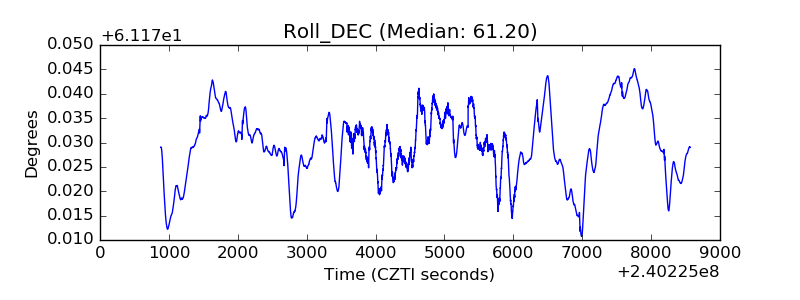 |
| _Roll_RA | 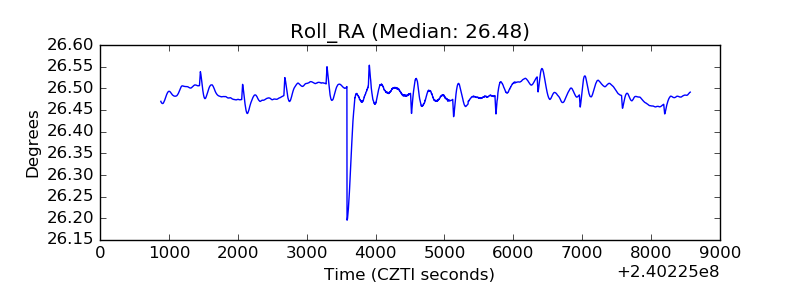 |
| Veto Counter | 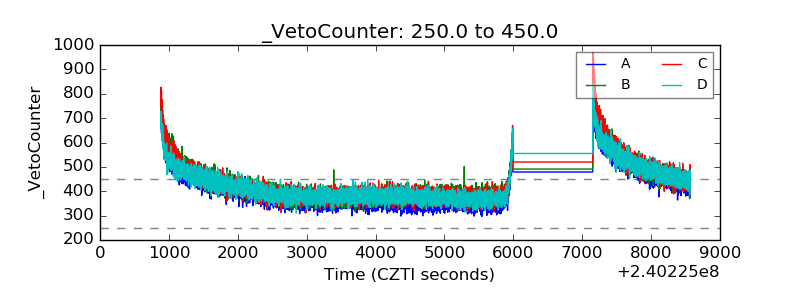 |