| Param | Original file | Final file |
|---|---|---|
| Filename | modeM0/AS1A03_079T02_9000001458_10130cztM0_level2.evt | modeM0/AS1A03_079T02_9000001458_10130cztM0_level2_quad_clean.evt |
| Size (bytes) | 486,656,640 | 82,889,280 |
| Size | 464.1 MB | 79.0 MB |
| Events in quadrant A | 3,325,297 | 520,848 |
| Events in quadrant B | 3,514,452 | 523,496 |
| Events in quadrant C | 3,157,202 | 516,002 |
| Events in quadrant D | 4,296,547 | 492,654 |
| Mode SS | |||
|---|---|---|---|
| Quadrant | BADHDUFLAG | Total packets | Discarded packets |
| A | 0 | 134 | 0 |
| B | 0 | 134 | 0 |
| C | 0 | 134 | 0 |
| D | 0 | 134 | 0 |
| Mode M0 | |||
|---|---|---|---|
| Quadrant | BADHDUFLAG | Total packets | Discarded packets |
| A | 0 | 14075 | 3 |
| B | 0 | 14663 | 2 |
| C | 0 | 13562 | 2 |
| D | 0 | 16838 | 2 |
| Mode M9 | |||
|---|---|---|---|
| Quadrant | BADHDUFLAG | Total packets | Discarded packets |
| A | 0 | 14 | 0 |
| B | 0 | 14 | 0 |
| C | 0 | 14 | 0 |
| D | 0 | 15 | 0 |
| Quadrant | Total seconds | Saturated seconds | Saturation percentage |
|---|---|---|---|
| A | 6550 | 86 | 1.312977% |
| B | 6550 | 89 | 1.358779% |
| C | 6550 | 60 | 0.916031% |
| D | 6550 | 244 | 3.725191% |
Noise dominated data is calculated using 1-second bins in cleaned event files. If a bin has >2000 counts, and if more than 50% of those come from <1% of pixels, then it is considered to be noise-dominated and hence unusable.
| Quadrant | # 1 sec bins | Bins with >0 counts | Bins with >2000 counts | High rate bins dominated by noise | Noise dominated (total time) | Noise dominated (detector-on time) | Marked lightcurve |
|---|---|---|---|---|---|---|---|
| A | 7780 | 6550 | 10 | 10 | 0.13% | 0.15% | 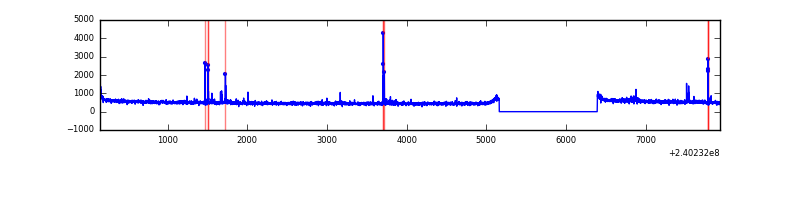 |
| B | 7780 | 6550 | 8 | 8 | 0.10% | 0.12% | 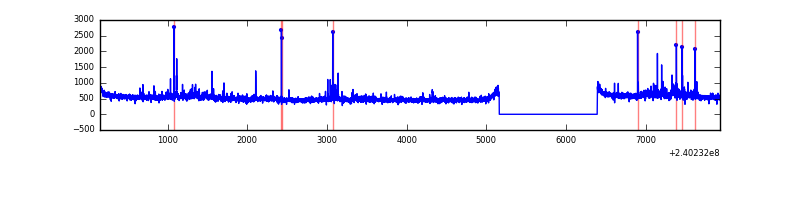 |
| C | 7780 | 6551 | 0 | 0 | 0.00% | 0.00% |  |
| D | 7780 | 6550 | 158 | 158 | 2.03% | 2.41% | 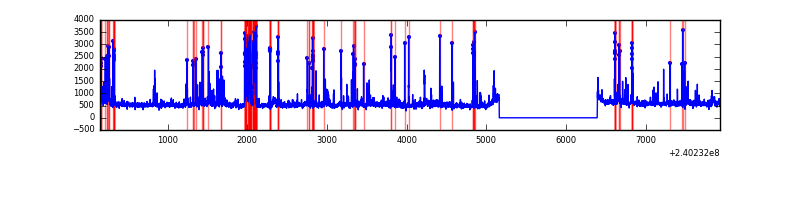 |
Top three noisy pixels from each quadrant. If the there are fewer than three noisy pixels in the level2.evt file, extra rows are filled as -1
| Pixel properties | Quadrant properties | ||||||
|---|---|---|---|---|---|---|---|
| Quadrant | DetID | PixID | Counts | Sigma | Mean | Median | Sigma |
| A | 15 | 174 | 78811 | 462.55 | 837 | 820 | 168.6 |
| A | 8 | 5 | 14615 | 81.81 | 837 | 820 | 168.6 |
| A | 13 | 248 | 8225 | 43.92 | 837 | 820 | 168.6 |
| B | 0 | 214 | 117429 | 751.07 | 830 | 811 | 155.3 |
| B | 0 | 219 | 72833 | 463.85 | 830 | 811 | 155.3 |
| B | 0 | 189 | 33233 | 208.81 | 830 | 811 | 155.3 |
| C | 14 | 67 | 13577 | 69.77 | 805 | 811 | 183.0 |
| C | 13 | 61 | 6090 | 28.85 | 805 | 811 | 183.0 |
| C | 14 | 234 | 2919 | 11.52 | 805 | 811 | 183.0 |
| D | 4 | 95 | 499571 | 2636.0 | 799 | 779 | 189.2 |
| D | 8 | 195 | 311840 | 1643.88 | 799 | 779 | 189.2 |
| D | 2 | 152 | 120382 | 632.07 | 799 | 779 | 189.2 |
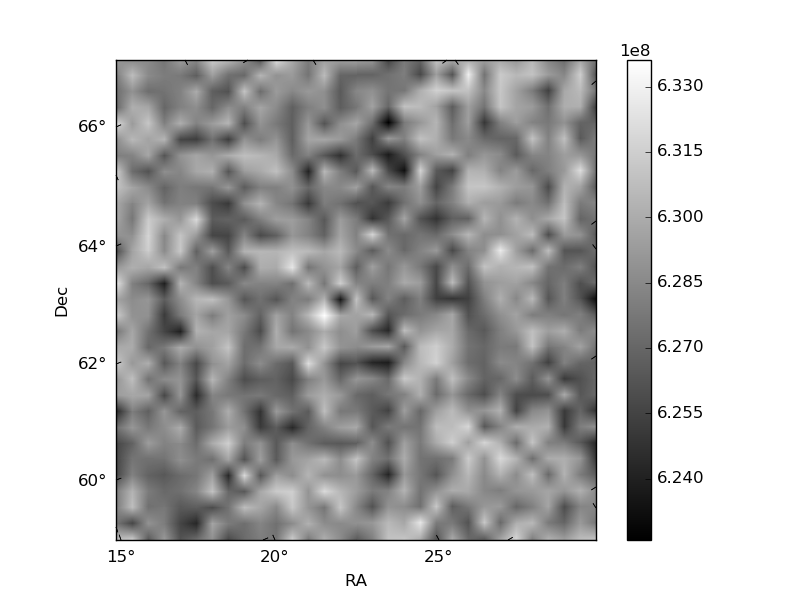
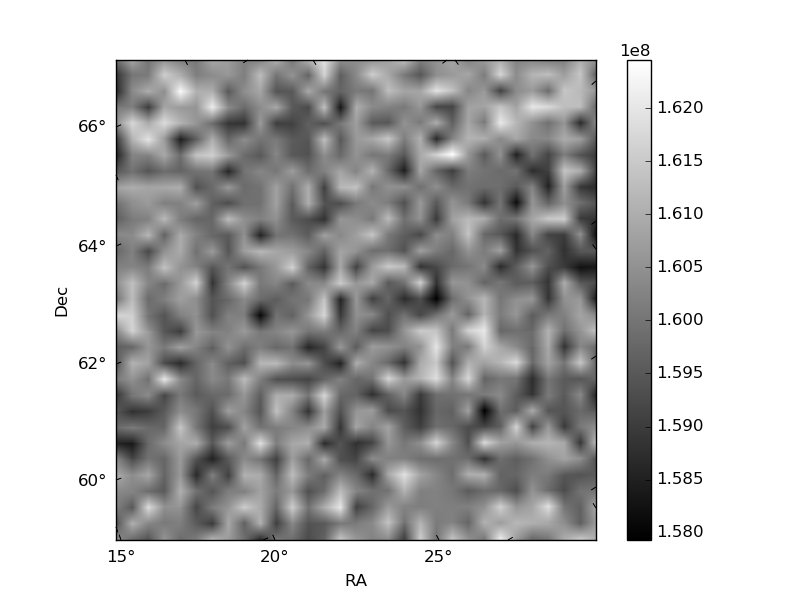
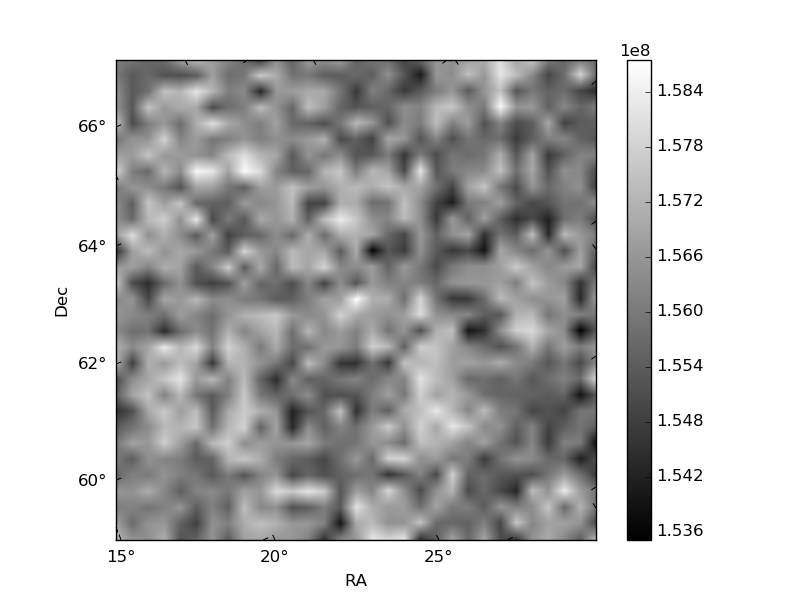
Histogram calculated using DETX and DETY for each event in the final _common_clean file
| Quadrant A | 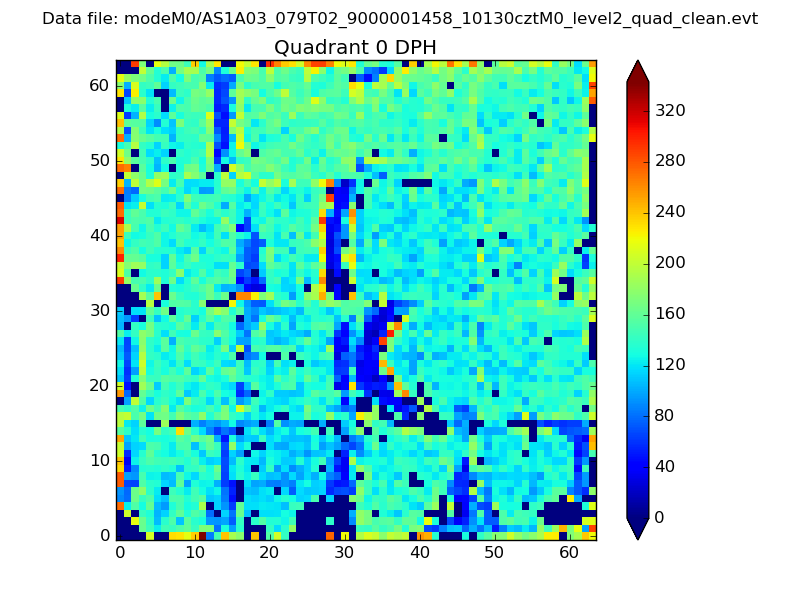 |
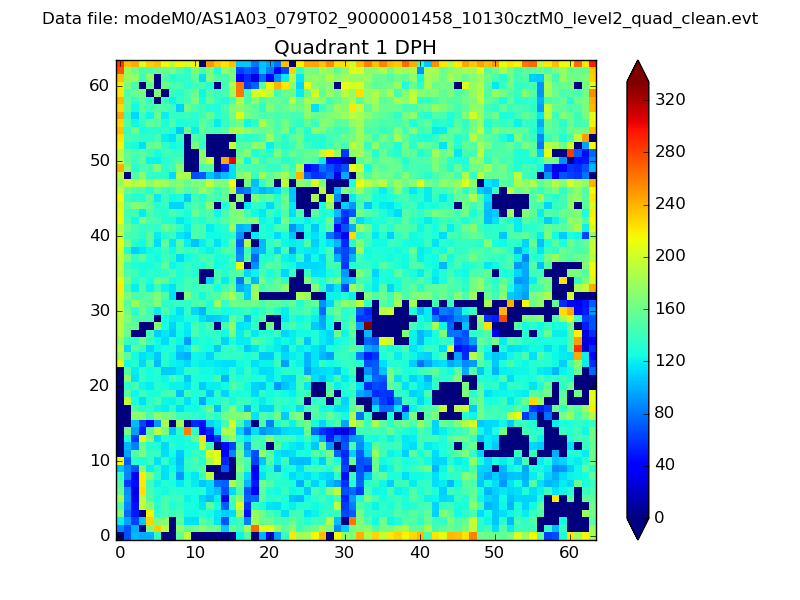 |
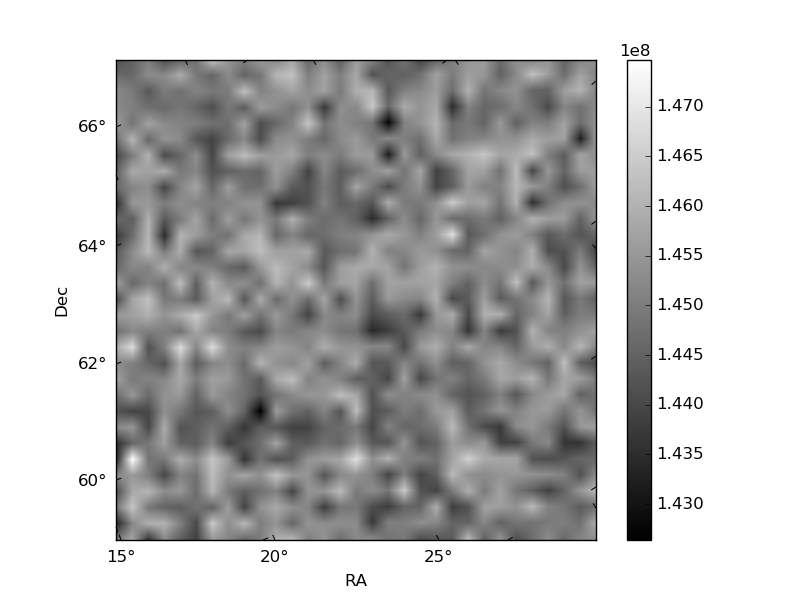
Quadrant B |
|---|---|---|---|
| Quadrant D | 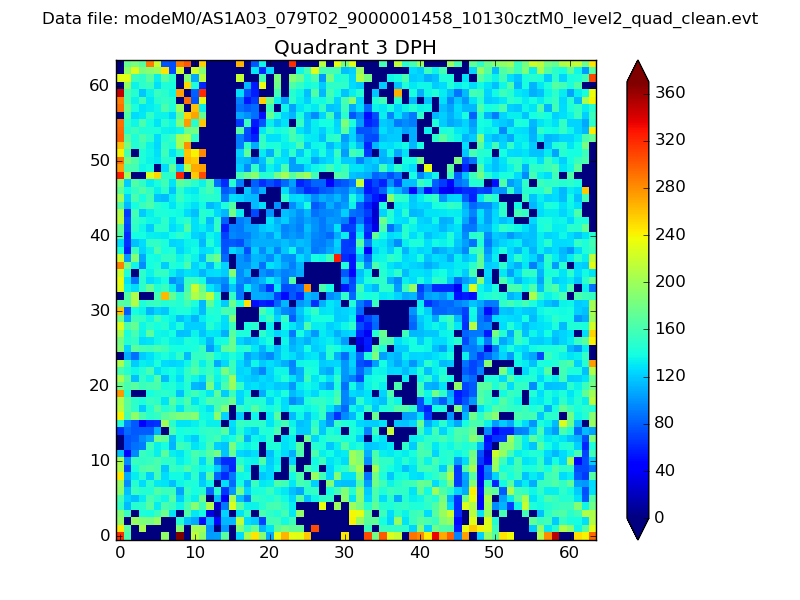 |
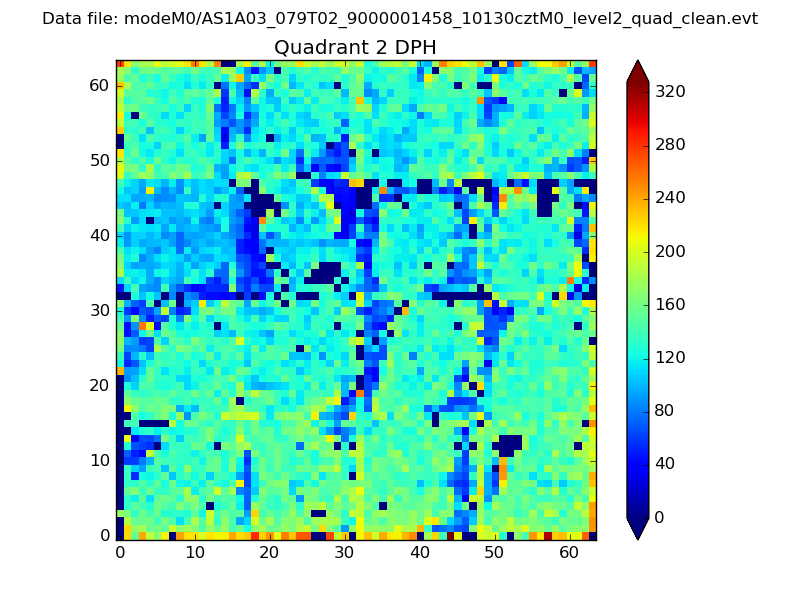 |
Quadrant C |
| Plot type | Count rate plots | Images |
|---|---|---|
| Comparison with Poisson distribution Blue bars denote a histogram of data divided into 1 sec bins. Red curve is a Poisson curve with rate = median count rate of data. |
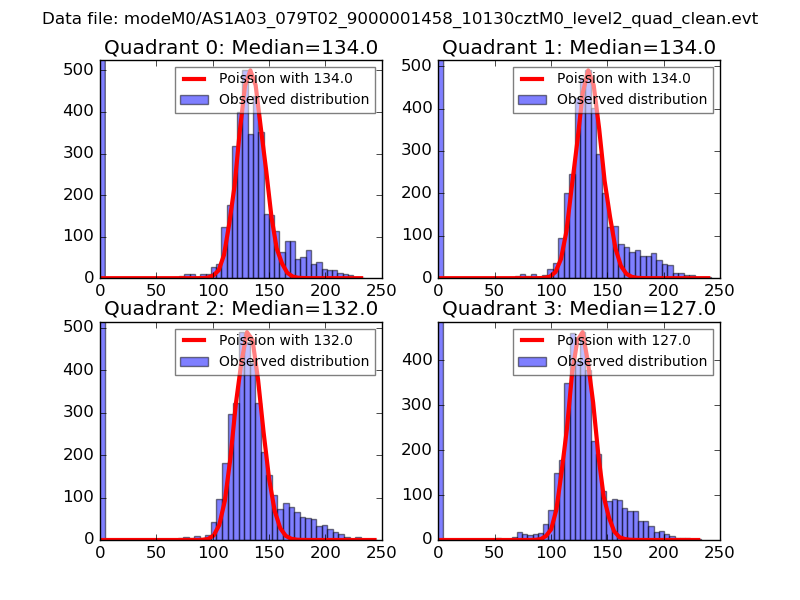 |
 |
| Quadrant-wise count rates Data is divided into 100 sec bins |
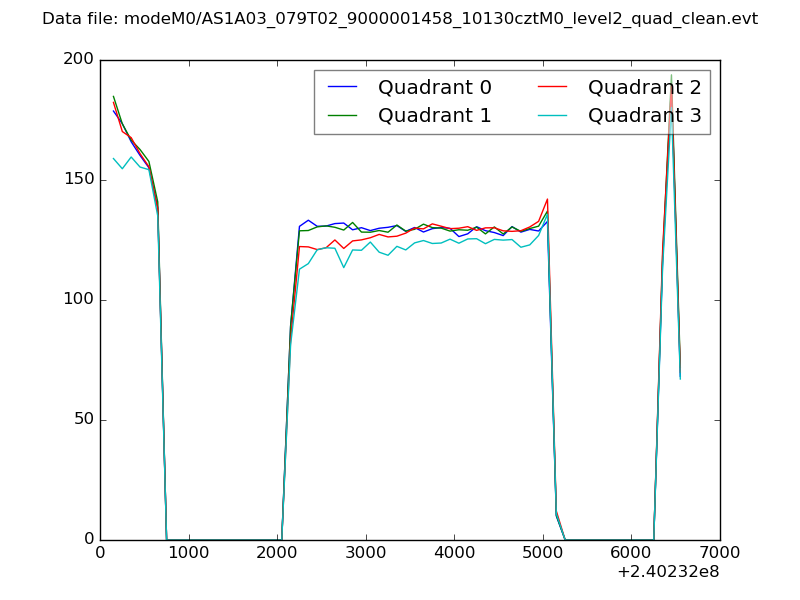 |
|
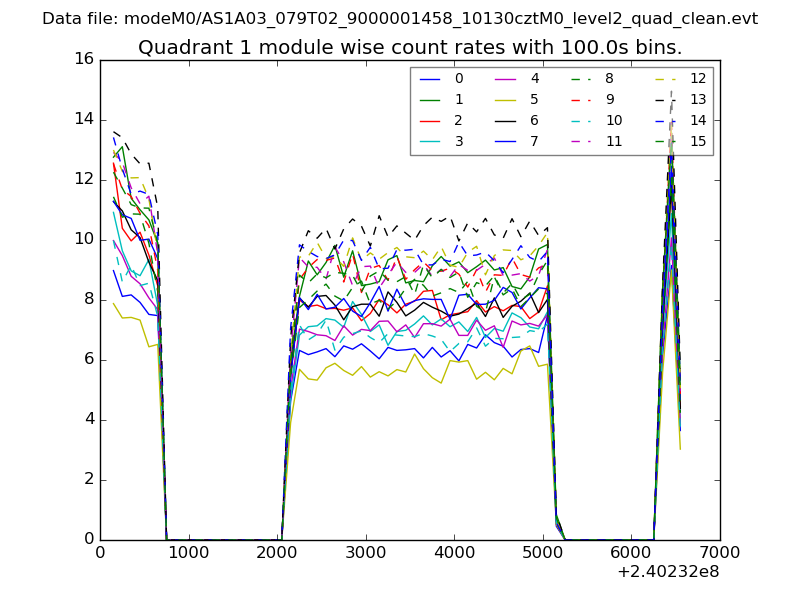
| Module-wise count rates for Quadrant A Data is divided into 100 sec bins |
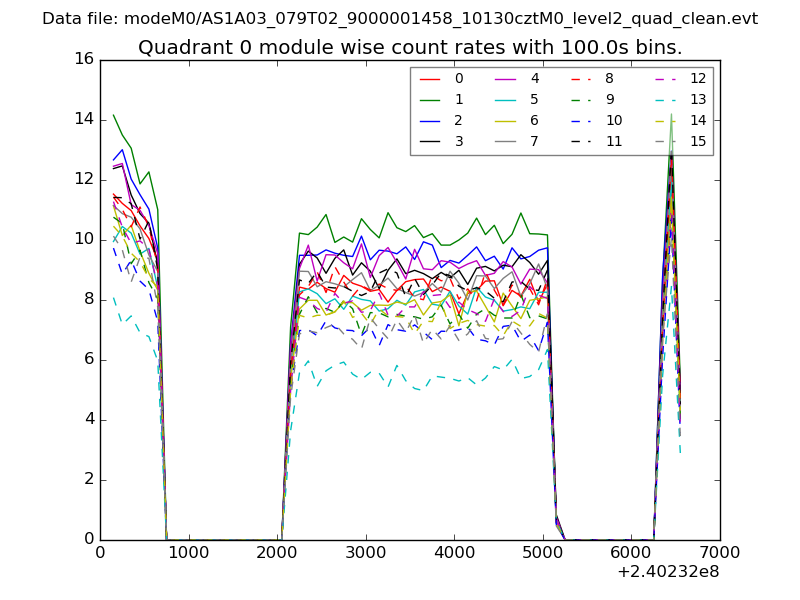 |
 |
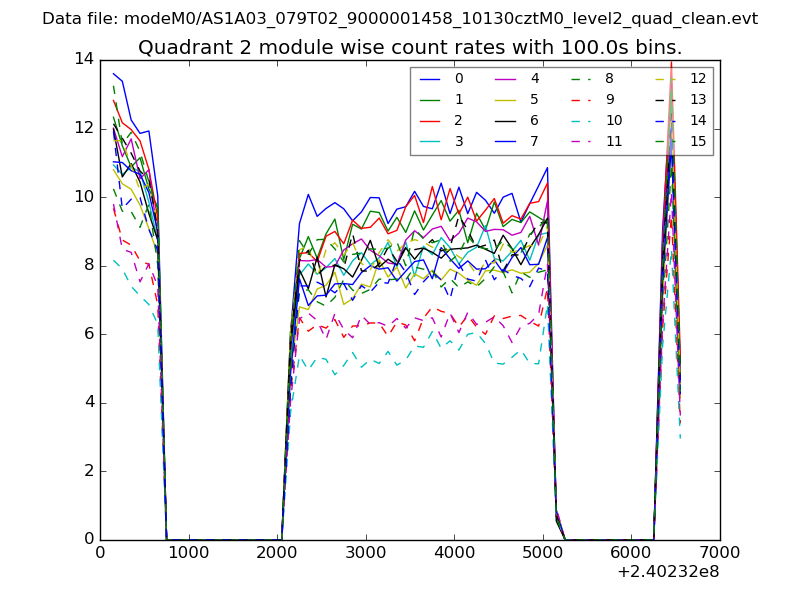
| Module-wise count rates for Quadrant B Data is divided into 100 sec bins |
 |
 |
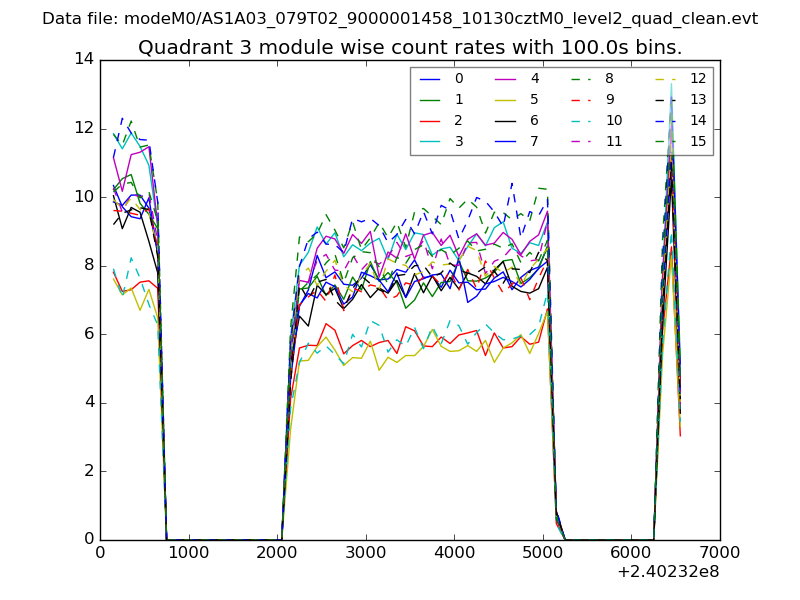
| Module-wise count rates for Quadrant C Data is divided into 100 sec bins |
 |
 |
| Module-wise count rates for Quadrant D Data is divided into 100 sec bins |
 |
 |
| Parameter | Plot |
|---|---|
| CZT HV Monitor | 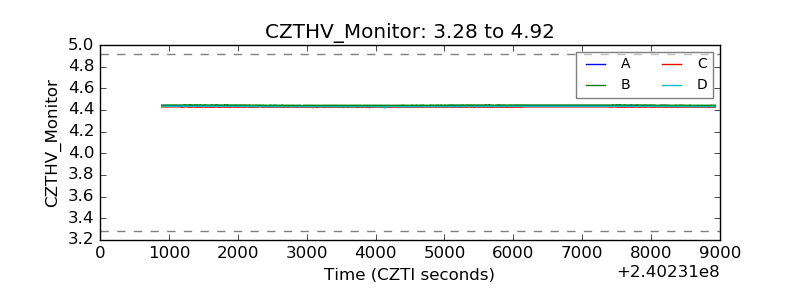 |
| D_VDD | 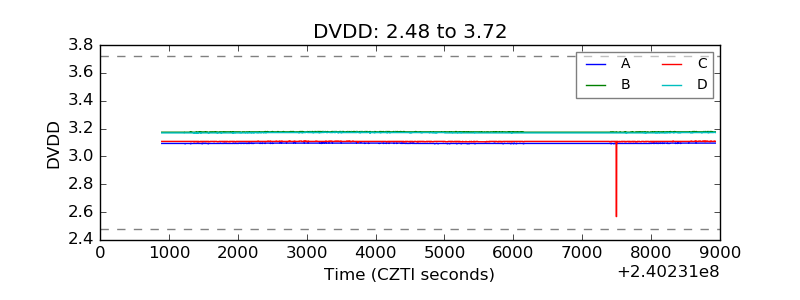 |
| Temperature 1 | 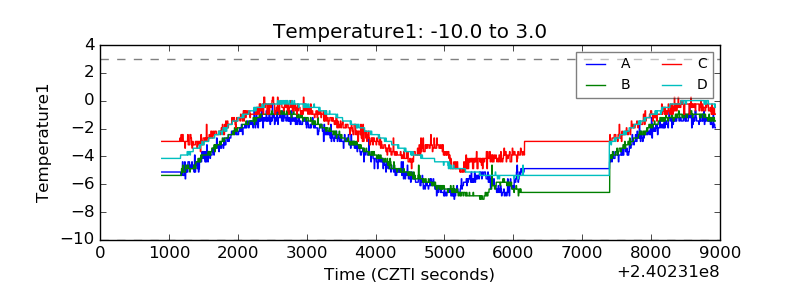 |
| Veto HV Monitor | 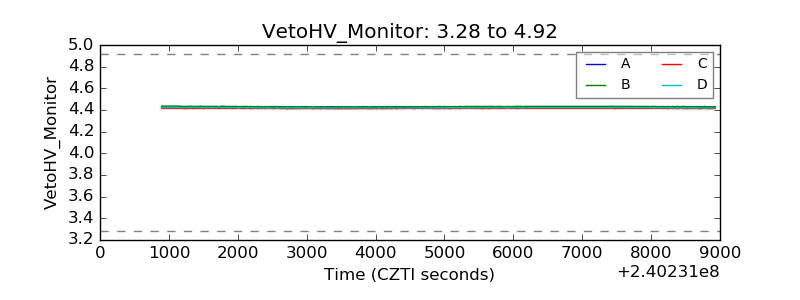 |
| Veto LLD | 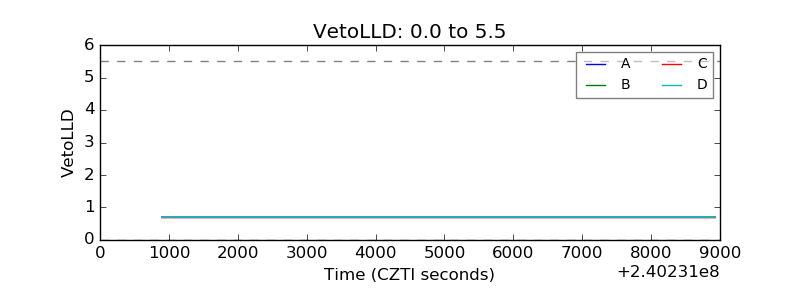 |
| Alpha Counter | 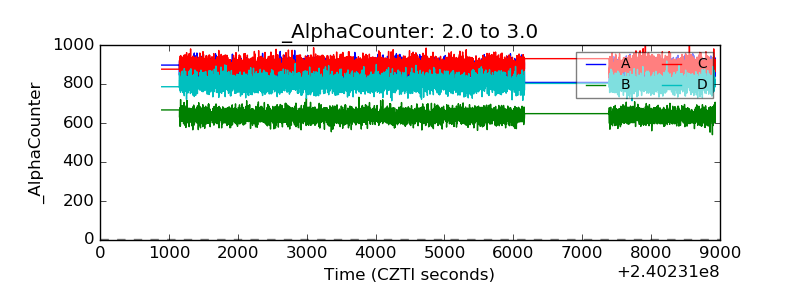 |
| _CPM_Rate | 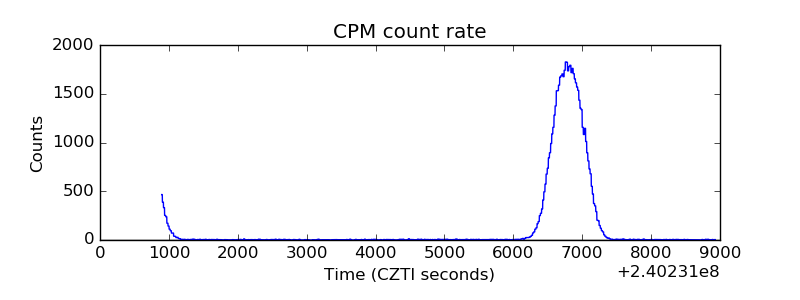 |
| CZT Counter | 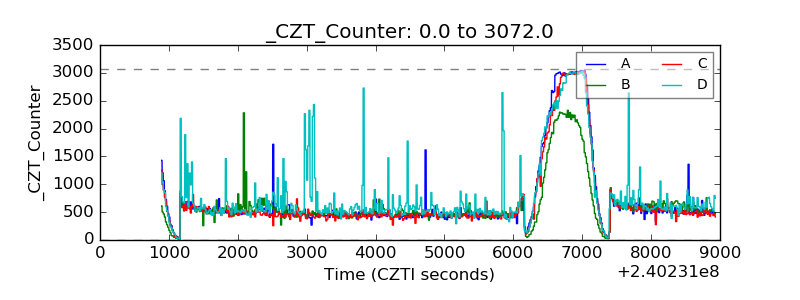 |
| +2.5 Volts monitor |  |
| +5 Volts monitor |  |
| _ROLL_ROT | 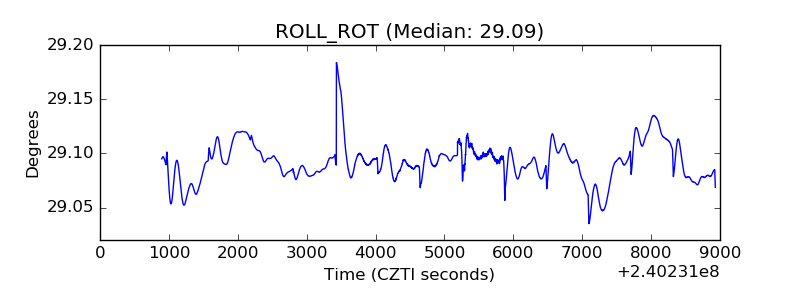 |
| _Roll_DEC | 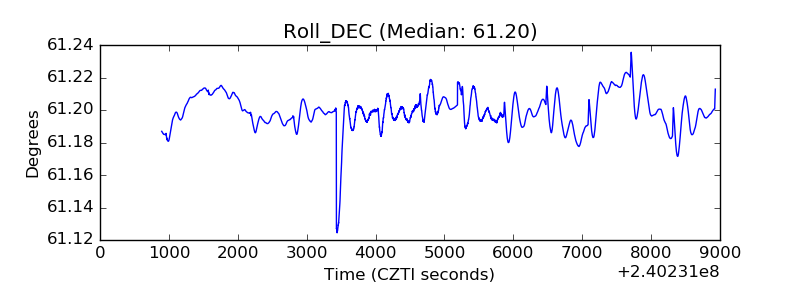 |
| _Roll_RA | 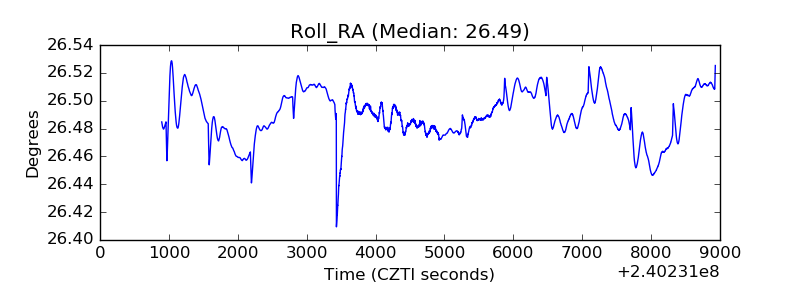 |
| Veto Counter | 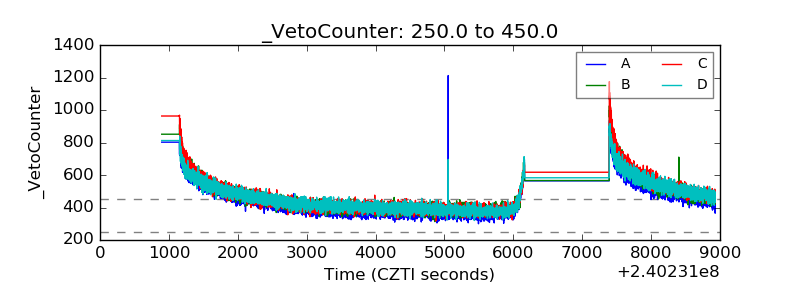 |