| Param | Original file | Final file |
|---|---|---|
| Filename | modeM0/AS1A03_079T02_9000001458_10131cztM0_level2.evt | modeM0/AS1A03_079T02_9000001458_10131cztM0_level2_quad_clean.evt |
| Size (bytes) | 182,617,920 | 24,338,880 |
| Size | 174.2 MB | 23.2 MB |
| Events in quadrant A | 1,234,548 | 148,412 |
| Events in quadrant B | 1,331,891 | 146,971 |
| Events in quadrant C | 1,165,160 | 140,255 |
| Events in quadrant D | 1,638,383 | 133,003 |
| Mode SS | |||
|---|---|---|---|
| Quadrant | BADHDUFLAG | Total packets | Discarded packets |
| A | 0 | 52 | 4 |
| B | 0 | 52 | 4 |
| C | 0 | 52 | 2 |
| D | 0 | 52 | 6 |
| Mode M0 | |||
|---|---|---|---|
| Quadrant | BADHDUFLAG | Total packets | Discarded packets |
| A | 0 | 5497 | 368 |
| B | 0 | 5944 | 459 |
| C | 0 | 5252 | 388 |
| D | 0 | 7106 | 601 |
| Mode M9 | |||
|---|---|---|---|
| Quadrant | BADHDUFLAG | Total packets | Discarded packets |
| A | 0 | 4 | 0 |
| B | 0 | 4 | 0 |
| C | 0 | 4 | 0 |
| D | 0 | 5 | 0 |
| Quadrant | Total seconds | Saturated seconds | Saturation percentage |
|---|---|---|---|
| A | 2338 | 21 | 0.898204% |
| B | 2324 | 27 | 1.161790% |
| C | 2327 | 11 | 0.472712% |
| D | 2298 | 69 | 3.002611% |
Noise dominated data is calculated using 1-second bins in cleaned event files. If a bin has >2000 counts, and if more than 50% of those come from <1% of pixels, then it is considered to be noise-dominated and hence unusable.
| Quadrant | # 1 sec bins | Bins with >0 counts | Bins with >2000 counts | High rate bins dominated by noise | Noise dominated (total time) | Noise dominated (detector-on time) | Marked lightcurve |
|---|---|---|---|---|---|---|---|
| A | 2501 | 2474 | 3 | 3 | 0.12% | 0.12% | 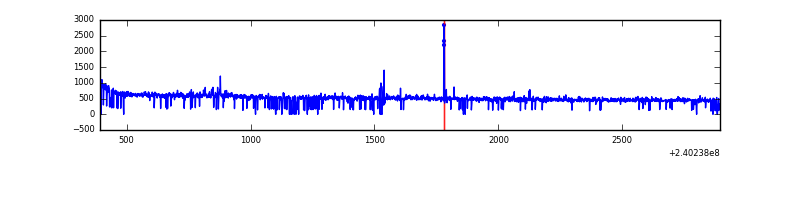 |
| B | 2502 | 2484 | 5 | 5 | 0.20% | 0.20% | 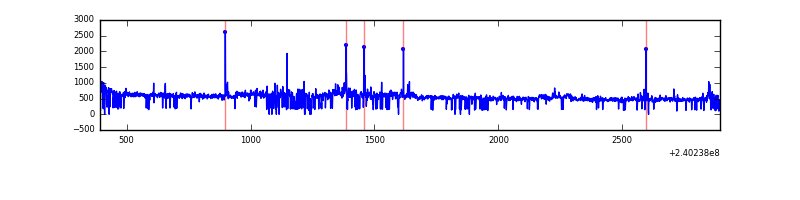 |
| C | 2502 | 2482 | 0 | 0 | 0.00% | 0.00% | 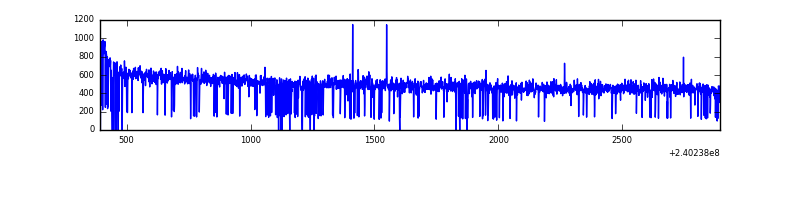 |
| D | 2502 | 2471 | 52 | 52 | 2.08% | 2.10% | 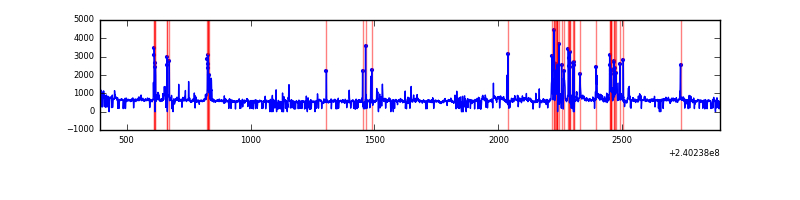 |
Top three noisy pixels from each quadrant. If the there are fewer than three noisy pixels in the level2.evt file, extra rows are filled as -1
| Pixel properties | Quadrant properties | ||||||
|---|---|---|---|---|---|---|---|
| Quadrant | DetID | PixID | Counts | Sigma | Mean | Median | Sigma |
| A | 15 | 174 | 15296 | 232.94 | 313 | 308 | 64.3 |
| A | 13 | 248 | 6451 | 95.47 | 313 | 308 | 64.3 |
| A | 8 | 5 | 5232 | 76.53 | 313 | 308 | 64.3 |
| B | 0 | 214 | 63788 | 1097.69 | 307 | 301 | 57.8 |
| B | 0 | 219 | 31597 | 541.11 | 307 | 301 | 57.8 |
| B | 4 | 81 | 13565 | 229.33 | 307 | 301 | 57.8 |
| C | 13 | 61 | 2280 | 28.86 | 298 | 300 | 68.6 |
| C | 14 | 234 | 1549 | 18.21 | 298 | 300 | 68.6 |
| C | 8 | 222 | 1257 | 13.95 | 298 | 300 | 68.6 |
| D | 8 | 195 | 175204 | 2477.27 | 294 | 287 | 70.6 |
| D | 4 | 95 | 156837 | 2217.15 | 294 | 287 | 70.6 |
| D | 7 | 71 | 87756 | 1238.78 | 294 | 287 | 70.6 |
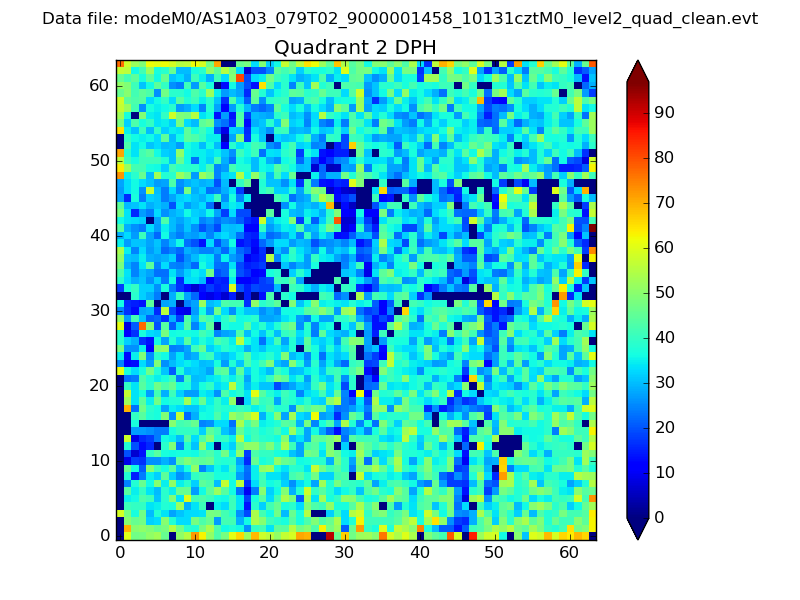
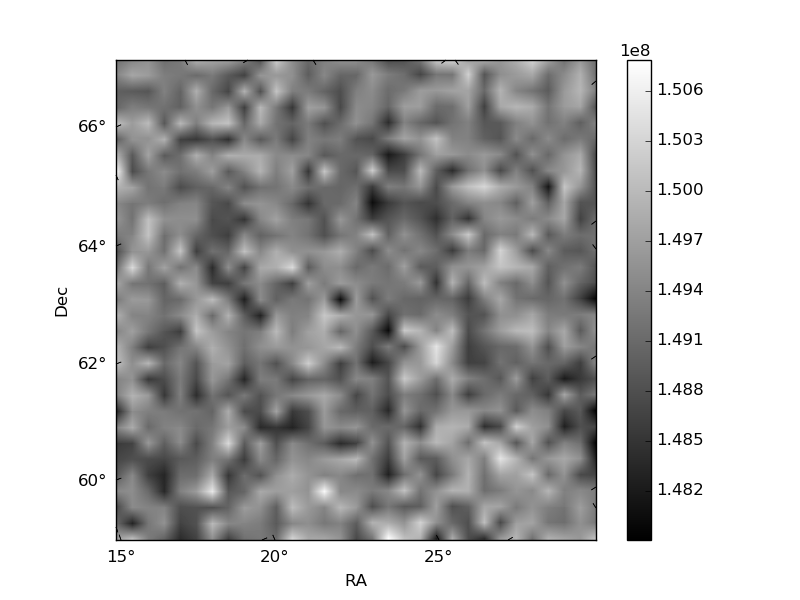
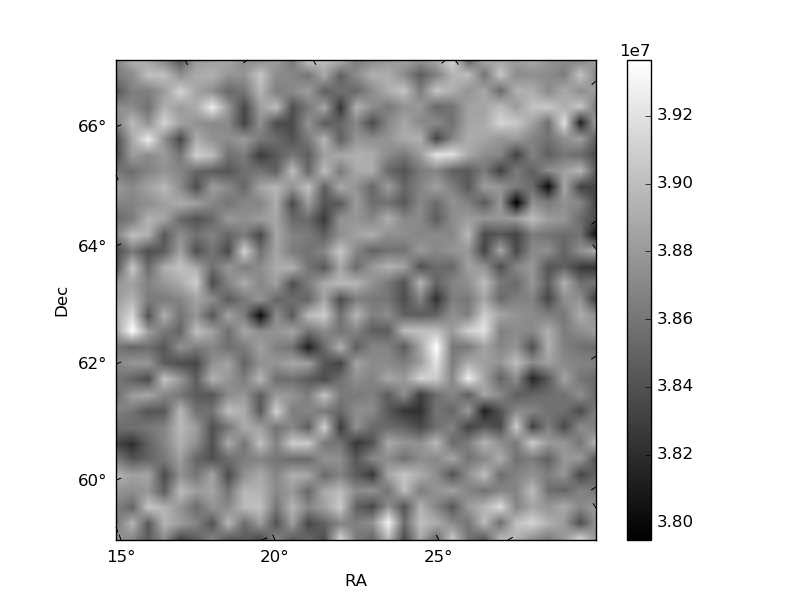
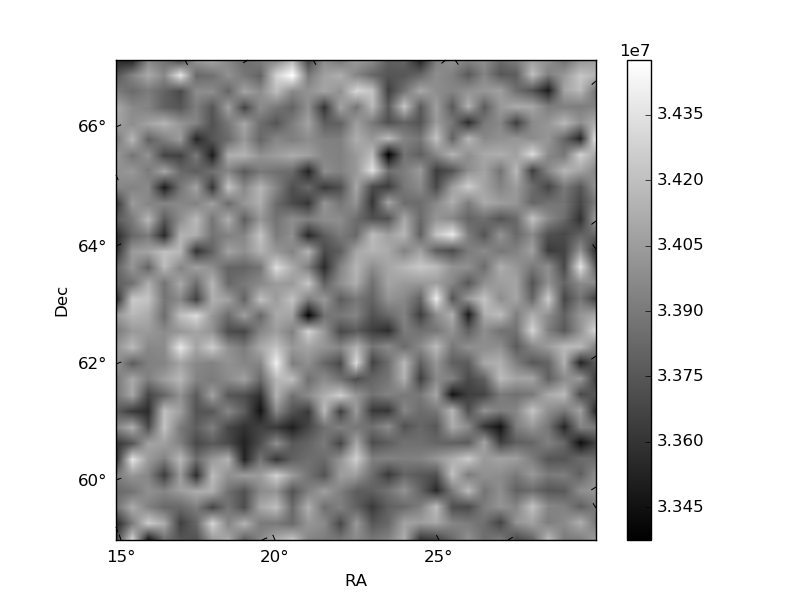
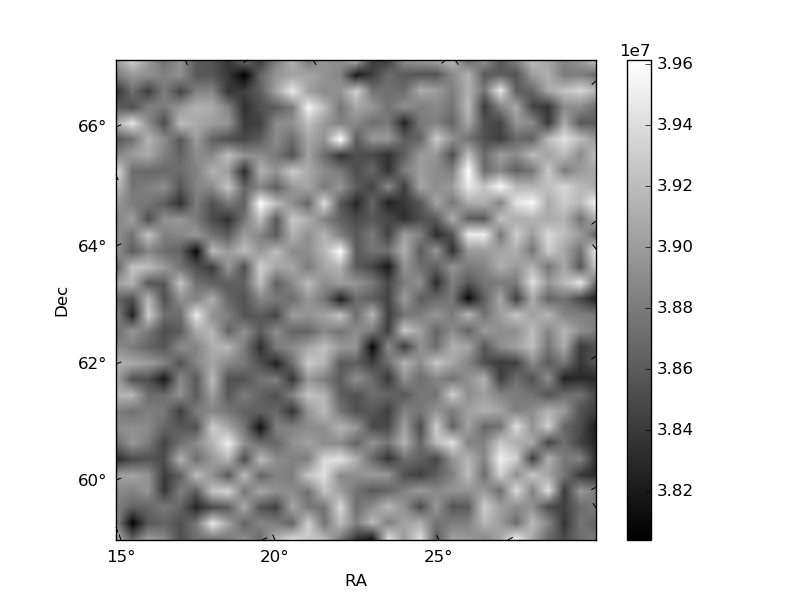
Histogram calculated using DETX and DETY for each event in the final _common_clean file
| Quadrant A | 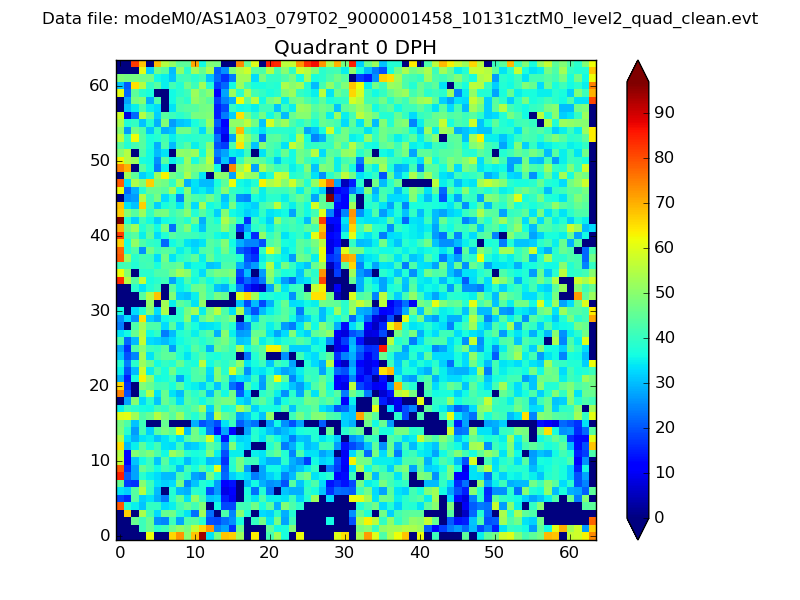 |
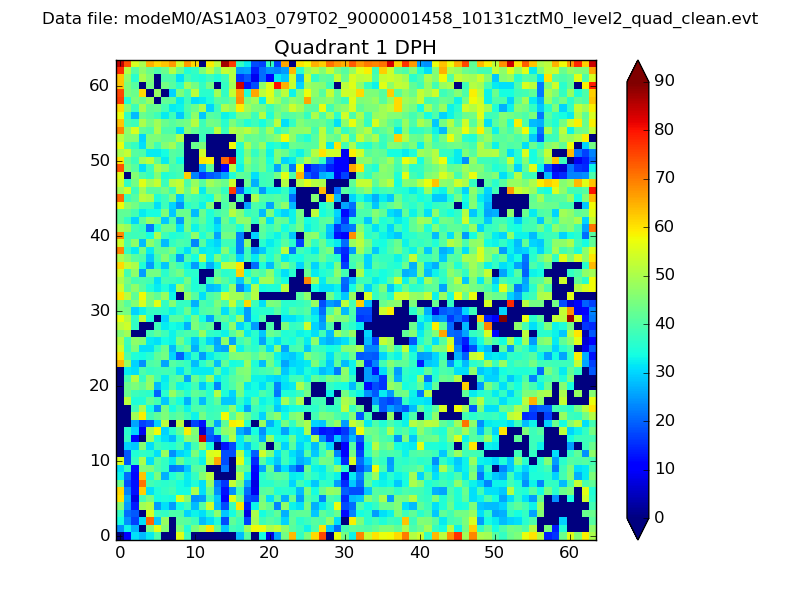 |
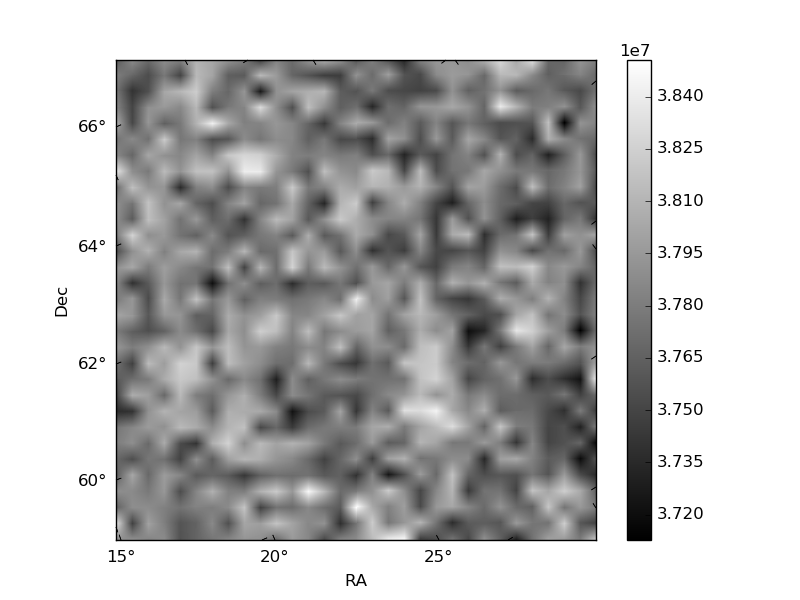
Quadrant B |
|---|---|---|---|
| Quadrant D | 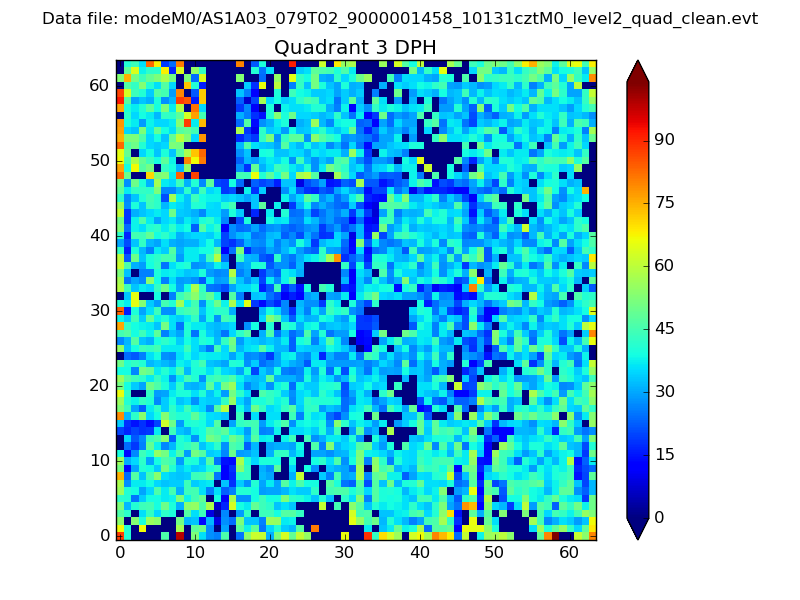 |
 |
Quadrant C |
| Plot type | Count rate plots | Images |
|---|---|---|
| Comparison with Poisson distribution Blue bars denote a histogram of data divided into 1 sec bins. Red curve is a Poisson curve with rate = median count rate of data. |
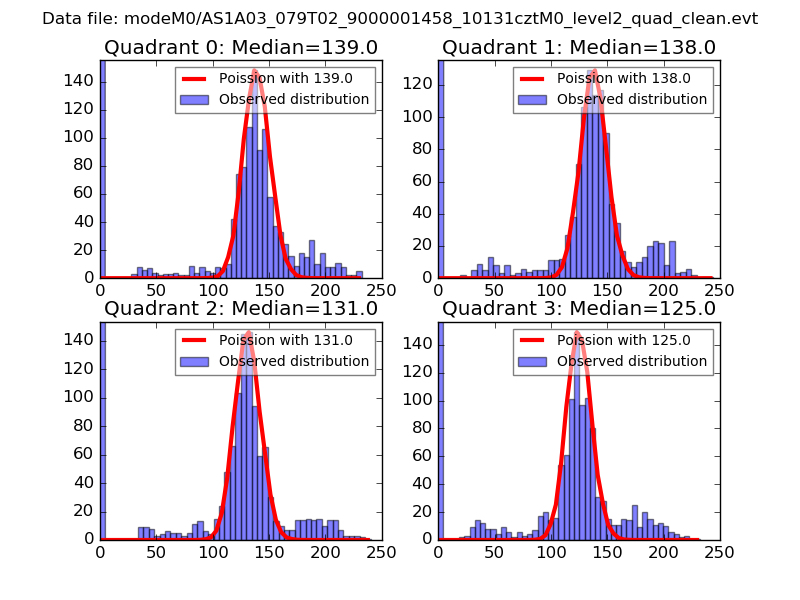 |
 |
| Quadrant-wise count rates Data is divided into 100 sec bins |
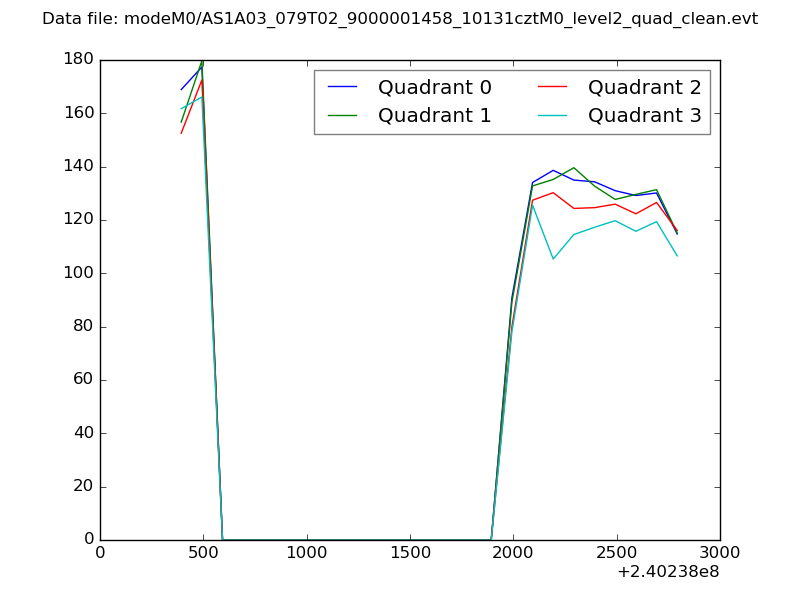 |
|
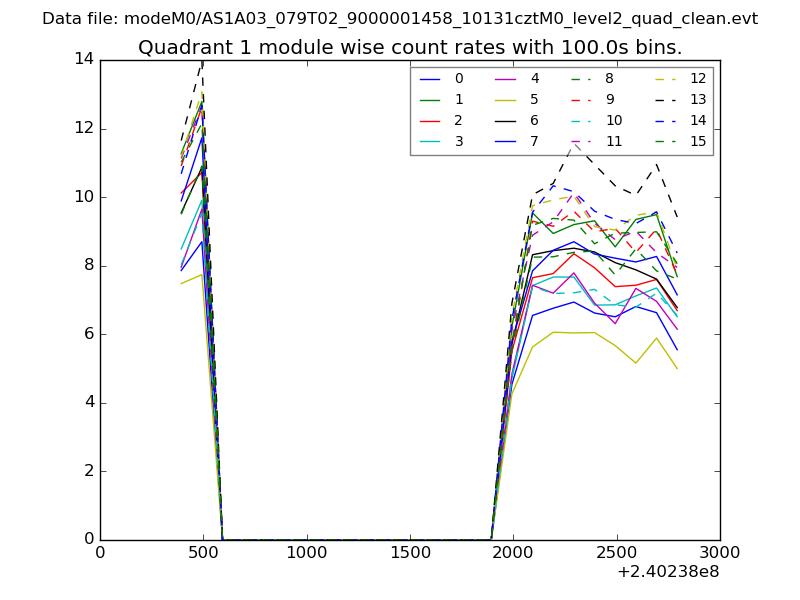
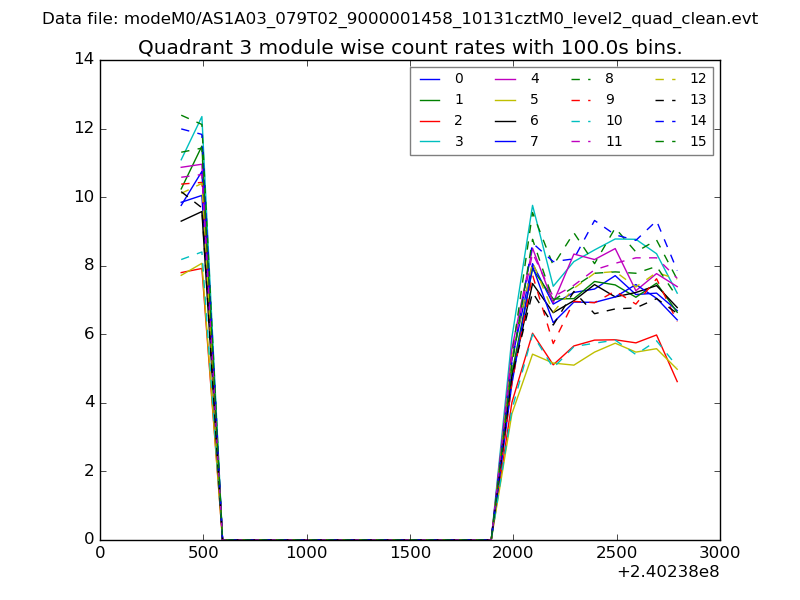
| Module-wise count rates for Quadrant A Data is divided into 100 sec bins |
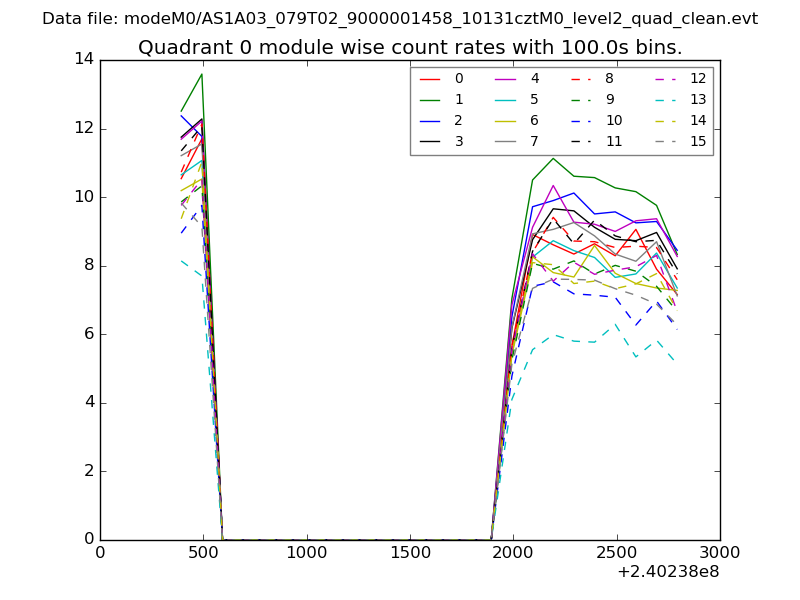 |
 |
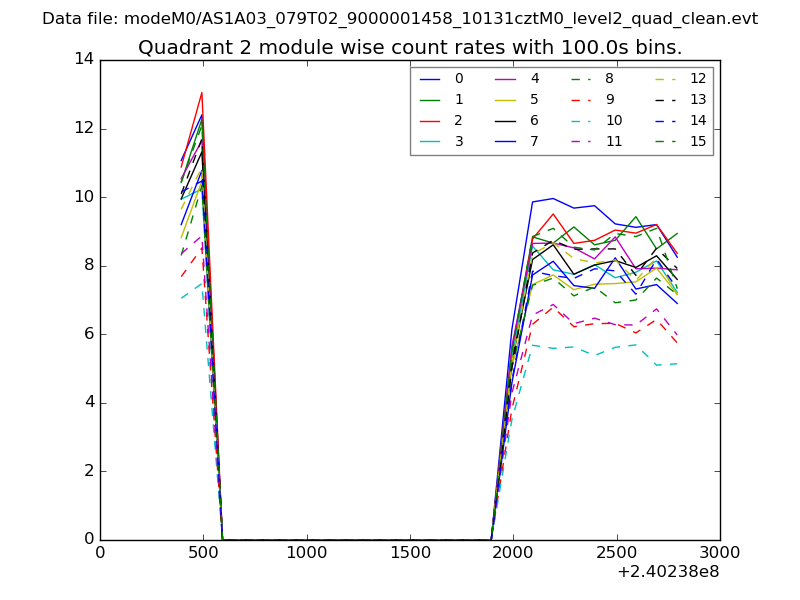
| Module-wise count rates for Quadrant B Data is divided into 100 sec bins |
 |
 |
| Module-wise count rates for Quadrant C Data is divided into 100 sec bins |
 |
 |
| Module-wise count rates for Quadrant D Data is divided into 100 sec bins |
 |
 |
| Parameter | Plot |
|---|---|
| CZT HV Monitor | 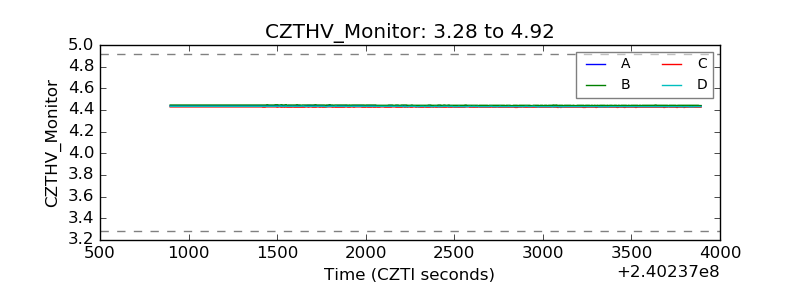 |
| D_VDD | 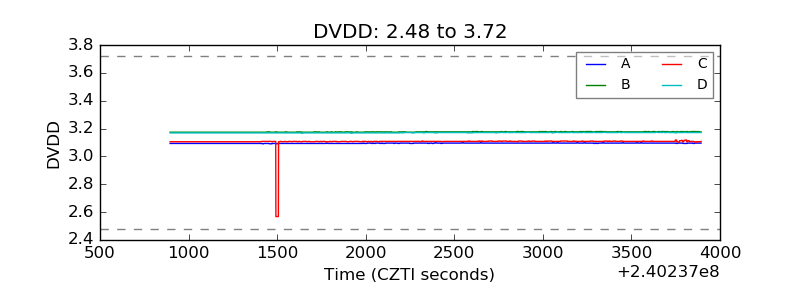 |
| Temperature 1 | 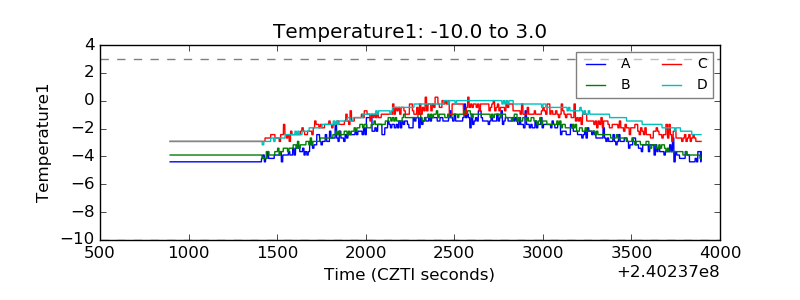 |
| Veto HV Monitor | 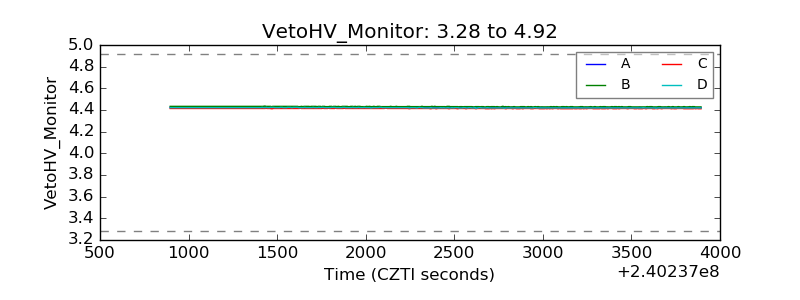 |
| Veto LLD | 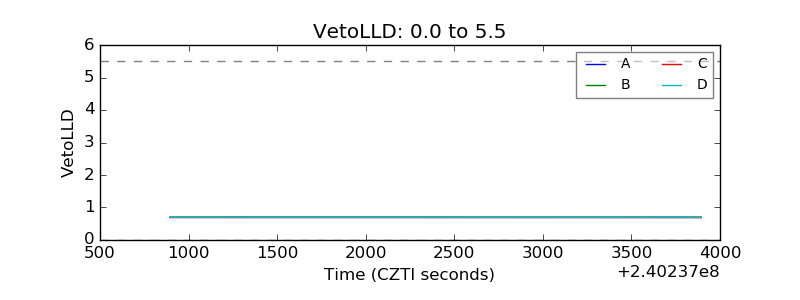 |
| Alpha Counter | 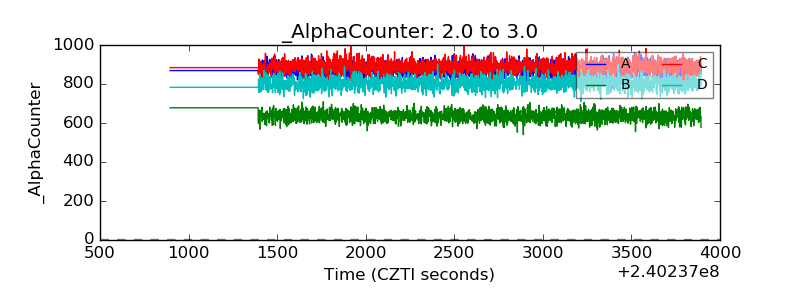 |
| _CPM_Rate | 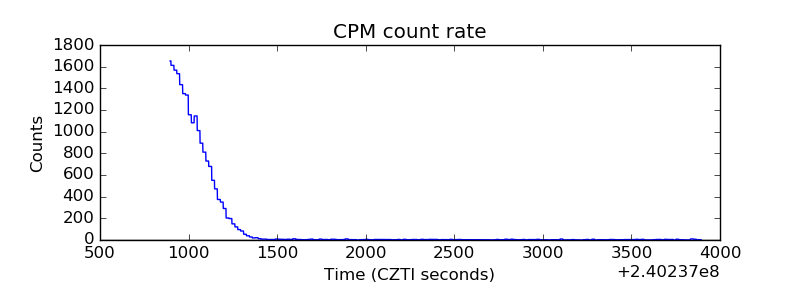 |
| CZT Counter | 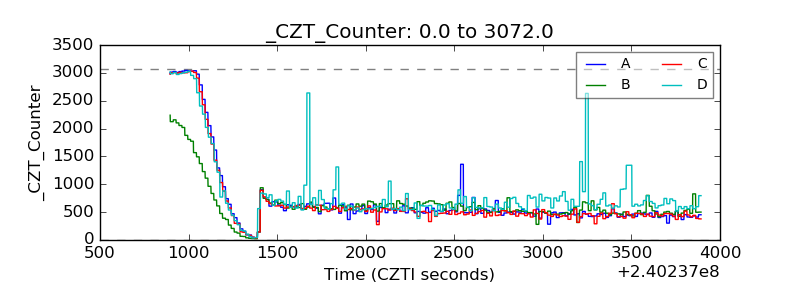 |
| +2.5 Volts monitor |  |
| +5 Volts monitor |  |
| _ROLL_ROT | 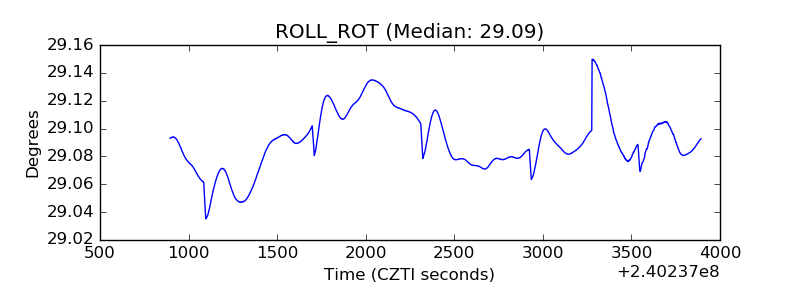 |
| _Roll_DEC | 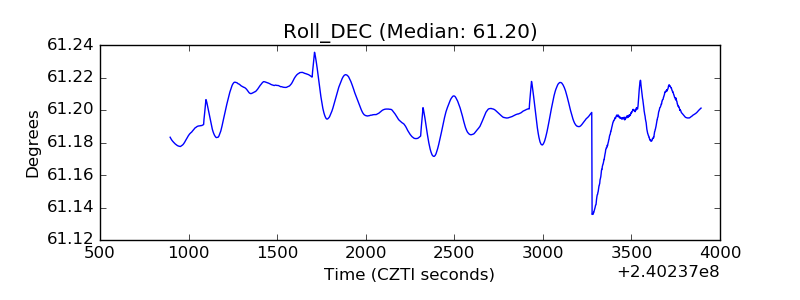 |
| _Roll_RA | 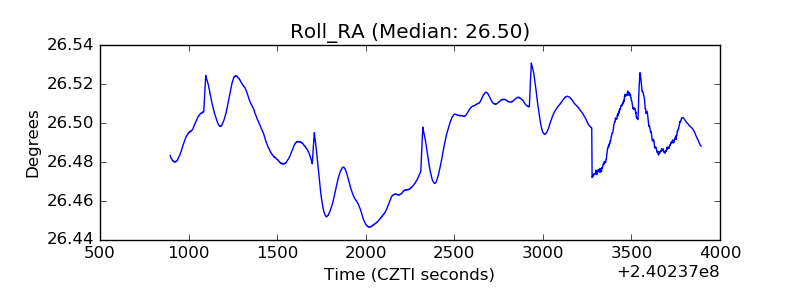 |
| Veto Counter | 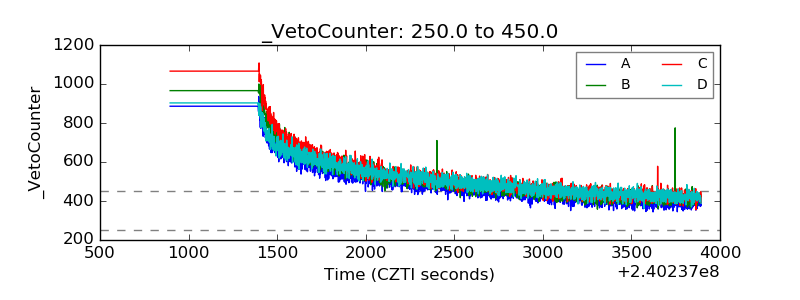 |