| Param | Original file | Final file |
|---|---|---|
| Filename | modeM0/AS1A03_116T01_9000001460cztM0_level2.fits | modeM0/AS1A03_116T01_9000001460cztM0_level2_quad_clean.evt |
| Size (bytes) | 884,309,760 | 863,850,240 |
| Size | 843.3 MB | 823.8 MB |
| Events in quadrant A | 5,450,634 | 5,283,286 |
| Events in quadrant B | 5,215,412 | 5,257,407 |
| Events in quadrant C | 5,314,822 | 5,055,556 |
| Events in quadrant D | 4,342,916 | 4,112,479 |
| Mode M9 | |||
|---|---|---|---|
| Quadrant | BADHDUFLAG | Total packets | Discarded packets |
| A | 0 | 165 | 0 |
| B | 0 | 165 | 0 |
| C | 0 | 165 | 0 |
| D | 0 | 165 | 0 |
| Mode SS | |||
|---|---|---|---|
| Quadrant | BADHDUFLAG | Total packets | Discarded packets |
| A | 0 | 1920 | 0 |
| B | 0 | 1922 | 0 |
| C | 0 | 1922 | 0 |
| D | 0 | 1922 | 0 |
| Mode M0 | |||
|---|---|---|---|
| Quadrant | BADHDUFLAG | Total packets | Discarded packets |
| A | 0 | 198954 | 0 |
| B | 0 | 211523 | 0 |
| C | 0 | 193681 | 0 |
| D | 0 | 308804 | 0 |
| Quadrant | Total seconds | Saturated seconds | Saturation percentage |
|---|---|---|---|
| A | 94132 | 1252 | 1.330047% |
| B | 94121 | 1394 | 1.481072% |
| C | 94144 | 661 | 0.702116% |
| D | 94121 | 10993 | 11.679646% |
Noise dominated data is calculated using 1-second bins in cleaned event files. If a bin has >2000 counts, and if more than 50% of those come from <1% of pixels, then it is considered to be noise-dominated and hence unusable.
| Quadrant | # 1 sec bins | Bins with >0 counts | Bins with >2000 counts | High rate bins dominated by noise | Noise dominated (total time) | Noise dominated (detector-on time) | Marked lightcurve |
|---|---|---|---|---|---|---|---|
| A | 110842 | 94155 | 0 | 0 | 0.00% | 0.00% |  |
| B | 110842 | 94155 | 0 | 0 | 0.00% | 0.00% |  |
| C | 110842 | 94160 | 0 | 0 | 0.00% | 0.00% |  |
| D | 110841 | 94080 | 0 | 0 | 0.00% | 0.00% |  |
Top three noisy pixels from each quadrant. If the there are fewer than three noisy pixels in the level2.evt file, extra rows are filled as -1
| Pixel properties | Quadrant properties | ||||||
|---|---|---|---|---|---|---|---|
| Quadrant | DetID | PixID | Counts | Sigma | Mean | Median | Sigma |
| A | 0 | 29 | 5288 | 11.22 | 1416 | 1326 | 353.1 |
| A | 7 | 110 | 4472 | 8.91 | 1416 | 1326 | 353.1 |
| A | 0 | 30 | 4135 | 7.95 | 1416 | 1326 | 353.1 |
| B | 2 | 9 | 4461 | 11.55 | 1377 | 1308 | 272.9 |
| B | 12 | 226 | 3560 | 8.25 | 1377 | 1308 | 272.9 |
| B | 14 | 254 | 3522 | 8.11 | 1377 | 1308 | 272.9 |
| C | 1 | 80 | 4035 | 7.48 | 1402 | 1302 | 365.3 |
| C | 1 | 81 | 3974 | 7.31 | 1402 | 1302 | 365.3 |
| C | 12 | 241 | 3681 | 6.51 | 1402 | 1302 | 365.3 |
| D | 6 | 231 | 3217 | 6.33 | 1238 | 1127 | 330.0 |
| D | 1 | 19 | 3139 | 6.09 | 1238 | 1127 | 330.0 |
| D | 7 | 3 | 3131 | 6.07 | 1238 | 1127 | 330.0 |
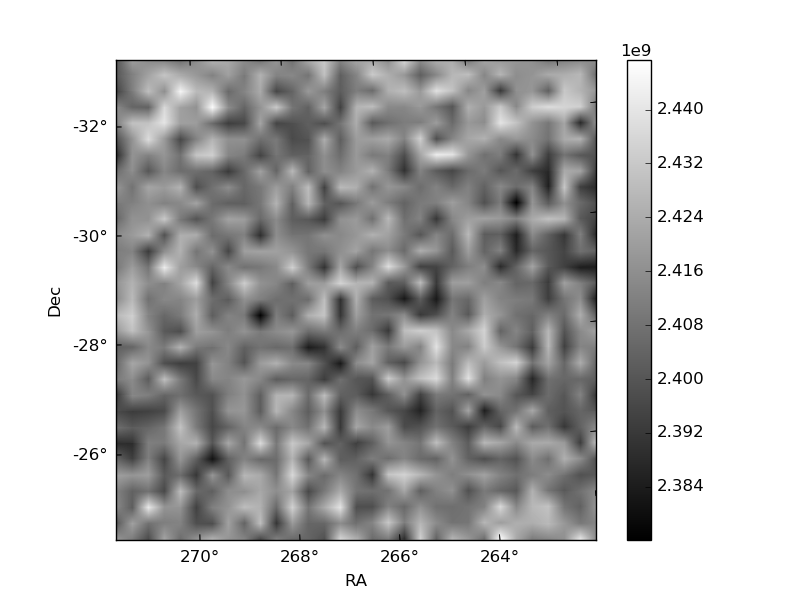
Histogram calculated using DETX and DETY for each event in the final _common_clean file
| Quadrant A | 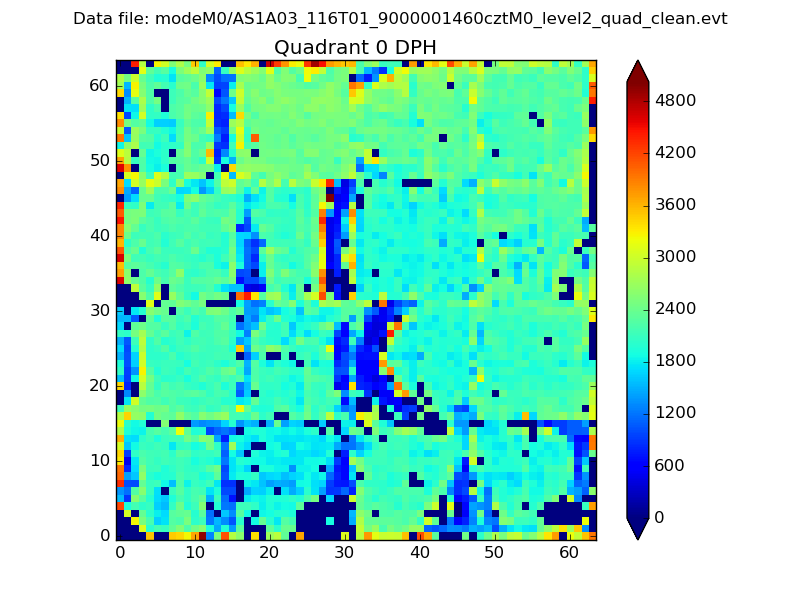 |
 |
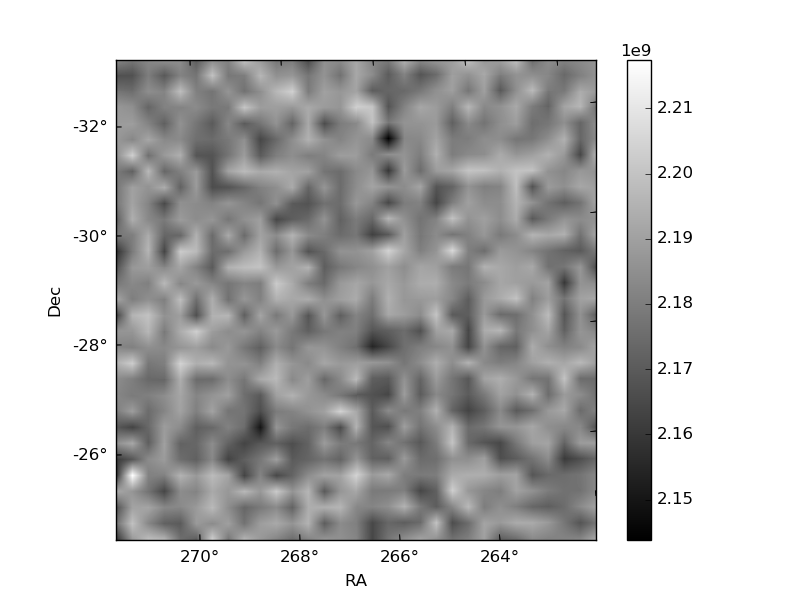
Quadrant B |
|---|---|---|---|
| Quadrant D | 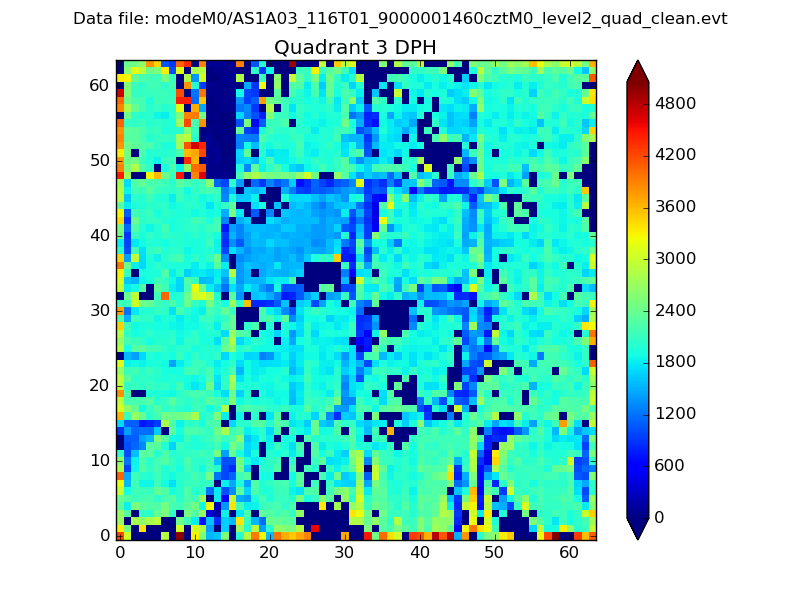 |
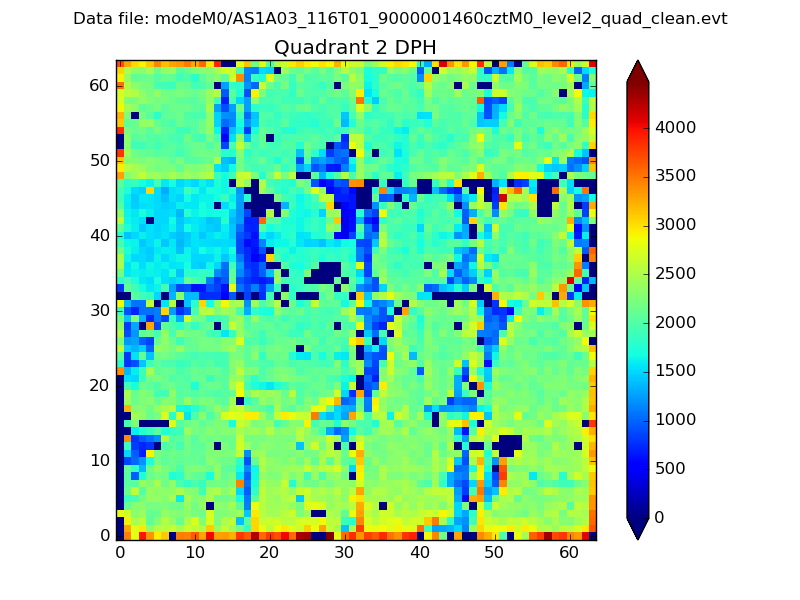 |
Quadrant C |
| Plot type | Count rate plots | Images |
|---|---|---|
| Comparison with Poisson distribution Blue bars denote a histogram of data divided into 1 sec bins. Red curve is a Poisson curve with rate = median count rate of data. |
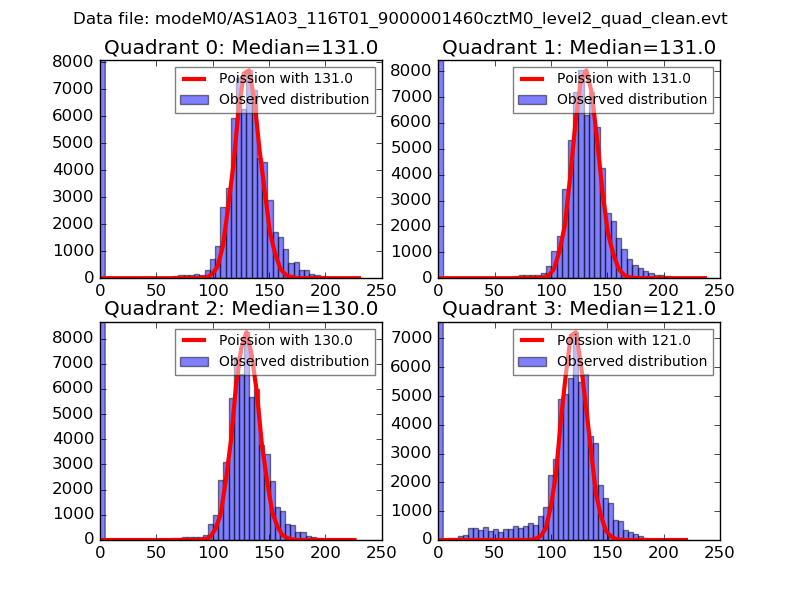 |
 |
| Quadrant-wise count rates Data is divided into 100 sec bins |
 |
|
| Module-wise count rates for Quadrant A Data is divided into 100 sec bins |
 |
 |
| Module-wise count rates for Quadrant B Data is divided into 100 sec bins |
 |
 |
| Module-wise count rates for Quadrant C Data is divided into 100 sec bins |
 |
 |
| Module-wise count rates for Quadrant D Data is divided into 100 sec bins |
 |
 |
| Parameter | Plot |
|---|---|
| CZT HV Monitor |  |
| D_VDD |  |
| Temperature 1 |  |
| Veto HV Monitor | 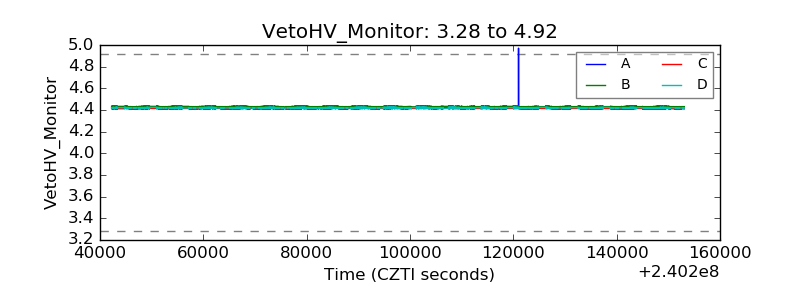 |
| Veto LLD |  |
| Alpha Counter |  |
| _CPM_Rate |  |
| CZT Counter |  |
| +2.5 Volts monitor |  |
| +5 Volts monitor |  |
| _ROLL_ROT |  |
| _Roll_DEC |  |
| _Roll_RA |  |
| Veto Counter |  |