| Param | Original file | Final file |
|---|---|---|
| Filename | modeM0/AS1A03_116T01_9000001460_10131cztM0_level2.evt | modeM0/AS1A03_116T01_9000001460_10131cztM0_level2_quad_clean.evt |
| Size (bytes) | 189,809,280 | 31,582,080 |
| Size | 181.0 MB | 30.1 MB |
| Events in quadrant A | 1,323,554 | 199,843 |
| Events in quadrant B | 1,494,368 | 203,254 |
| Events in quadrant C | 1,223,450 | 199,289 |
| Events in quadrant D | 1,548,423 | 187,301 |
| Mode M9 | |||
|---|---|---|---|
| Quadrant | BADHDUFLAG | Total packets | Discarded packets |
| A | 0 | 13 | 0 |
| B | 0 | 13 | 0 |
| C | 0 | 13 | 0 |
| D | 0 | 13 | 0 |
| Mode SS | |||
|---|---|---|---|
| Quadrant | BADHDUFLAG | Total packets | Discarded packets |
| A | 0 | 48 | 2 |
| B | 0 | 48 | 0 |
| C | 0 | 48 | 0 |
| D | 0 | 48 | 0 |
| Mode M0 | |||
|---|---|---|---|
| Quadrant | BADHDUFLAG | Total packets | Discarded packets |
| A | 0 | 5500 | 62 |
| B | 0 | 6167 | 85 |
| C | 0 | 5081 | 33 |
| D | 0 | 6280 | 82 |
| Quadrant | Total seconds | Saturated seconds | Saturation percentage |
|---|---|---|---|
| A | 2307 | 117 | 5.071521% |
| B | 2301 | 87 | 3.780965% |
| C | 2319 | 64 | 2.759810% |
| D | 2303 | 114 | 4.950065% |
Noise dominated data is calculated using 1-second bins in cleaned event files. If a bin has >2000 counts, and if more than 50% of those come from <1% of pixels, then it is considered to be noise-dominated and hence unusable.
| Quadrant | # 1 sec bins | Bins with >0 counts | Bins with >2000 counts | High rate bins dominated by noise | Noise dominated (total time) | Noise dominated (detector-on time) | Marked lightcurve |
|---|---|---|---|---|---|---|---|
| A | 3619 | 2333 | 24 | 24 | 0.66% | 1.03% | 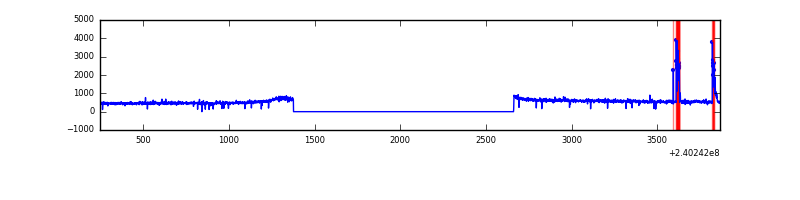 |
| B | 3619 | 2333 | 8 | 8 | 0.22% | 0.34% | 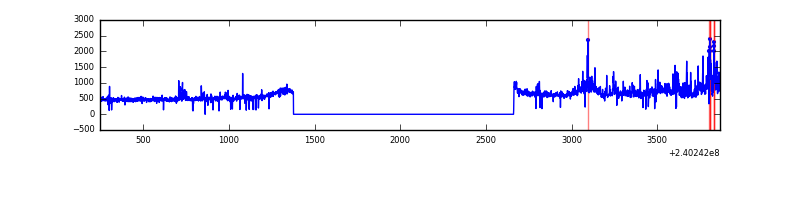 |
| C | 3619 | 2334 | 0 | 0 | 0.00% | 0.00% | 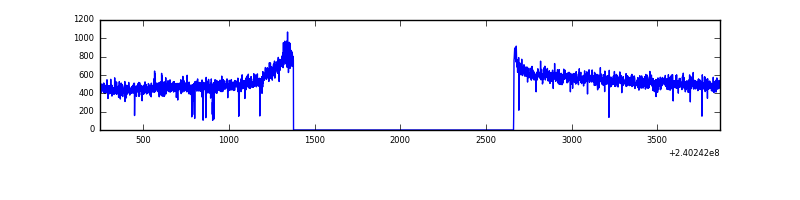 |
| D | 3619 | 2332 | 22 | 22 | 0.61% | 0.94% | 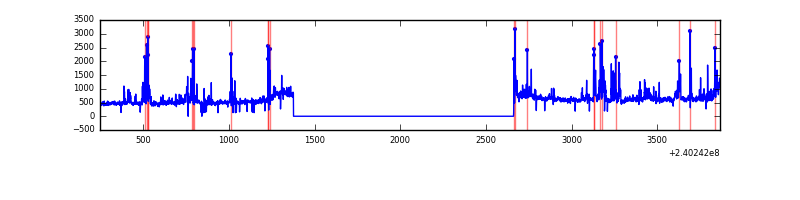 |
Top three noisy pixels from each quadrant. If the there are fewer than three noisy pixels in the level2.evt file, extra rows are filled as -1
| Pixel properties | Quadrant properties | ||||||
|---|---|---|---|---|---|---|---|
| Quadrant | DetID | PixID | Counts | Sigma | Mean | Median | Sigma |
| A | 15 | 174 | 83814 | 1249.97 | 321 | 314 | 66.8 |
| A | 0 | 226 | 3004 | 40.27 | 321 | 314 | 66.8 |
| A | 12 | 194 | 2706 | 35.81 | 321 | 314 | 66.8 |
| B | 4 | 81 | 176889 | 2836.42 | 320 | 312 | 62.3 |
| B | 0 | 214 | 35300 | 562.02 | 320 | 312 | 62.3 |
| B | 0 | 219 | 19232 | 303.92 | 320 | 312 | 62.3 |
| C | 4 | 175 | 2649 | 32.09 | 311 | 312 | 72.8 |
| C | 14 | 67 | 2624 | 31.75 | 311 | 312 | 72.8 |
| C | 13 | 61 | 2497 | 30.0 | 311 | 312 | 72.8 |
| D | 4 | 95 | 109818 | 1461.53 | 308 | 299 | 74.9 |
| D | 8 | 195 | 99975 | 1330.18 | 308 | 299 | 74.9 |
| D | 2 | 152 | 77204 | 1026.3 | 308 | 299 | 74.9 |
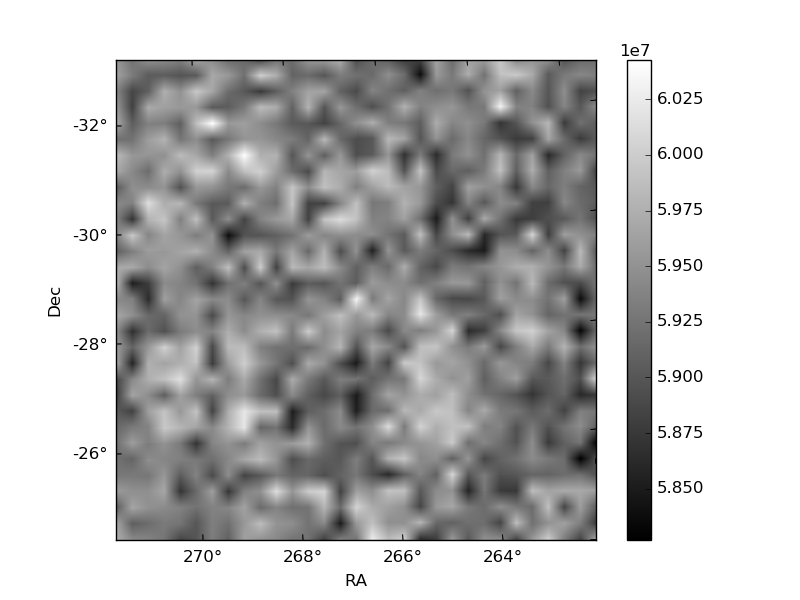
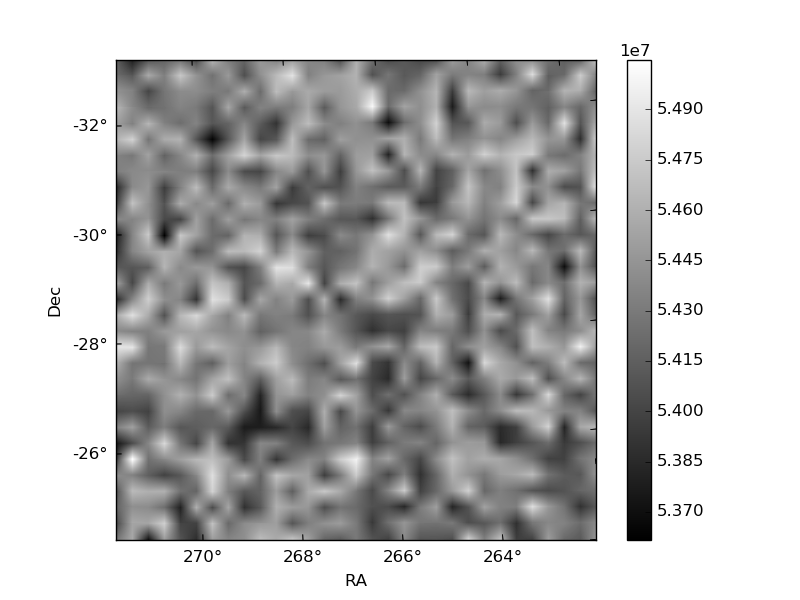
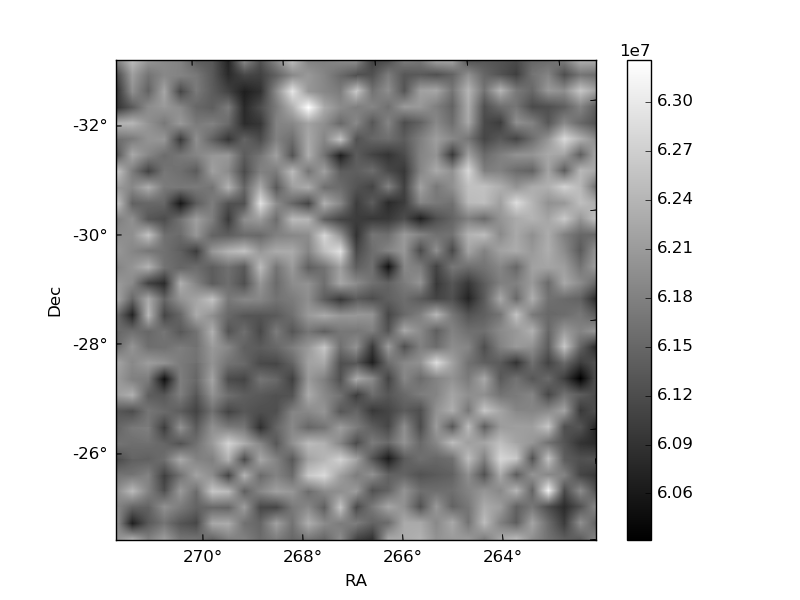
Histogram calculated using DETX and DETY for each event in the final _common_clean file
| Quadrant A | 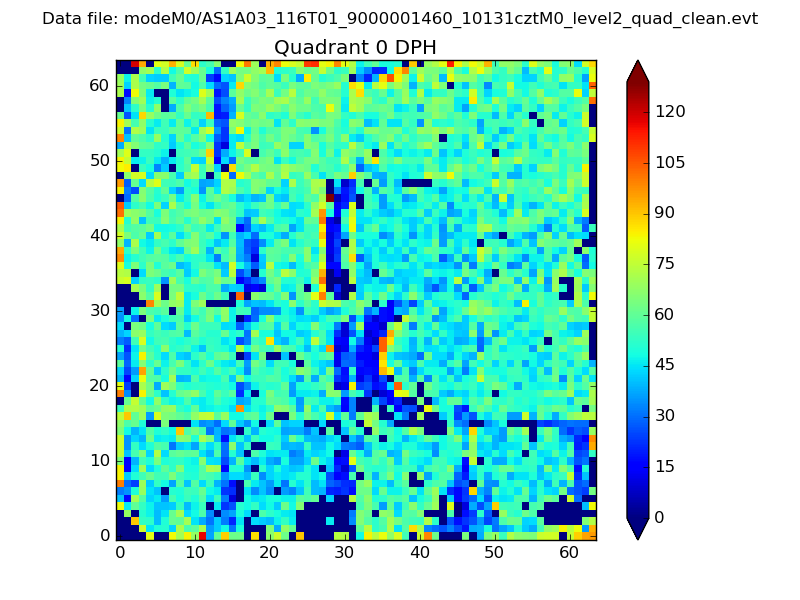 |
 |
Quadrant B |
|---|---|---|---|
| Quadrant D |  |
 |
Quadrant C |
| Plot type | Count rate plots | Images |
|---|---|---|
| Comparison with Poisson distribution Blue bars denote a histogram of data divided into 1 sec bins. Red curve is a Poisson curve with rate = median count rate of data. |
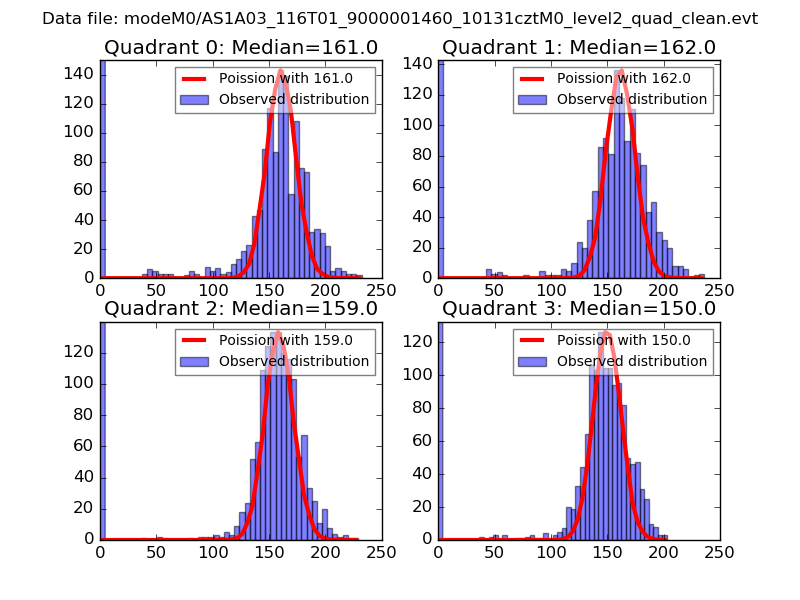 |
 |
| Quadrant-wise count rates Data is divided into 100 sec bins |
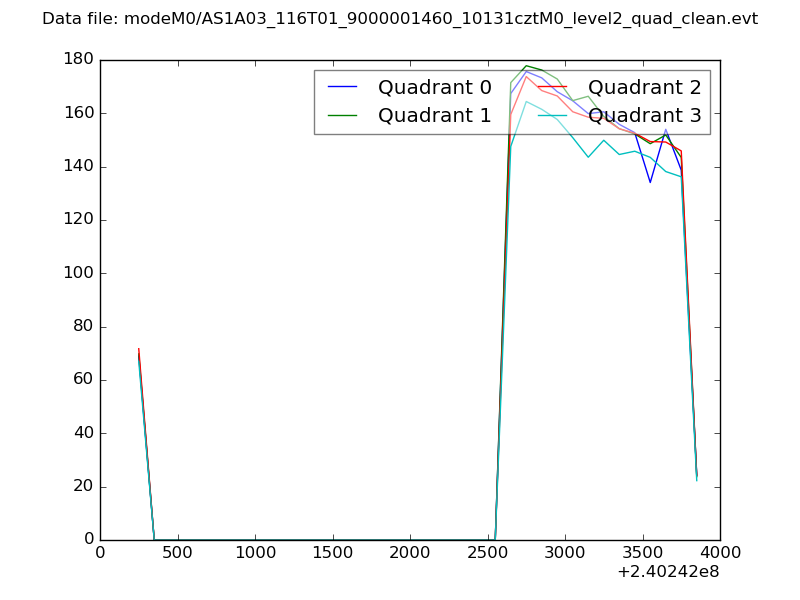 |
|
| Module-wise count rates for Quadrant A Data is divided into 100 sec bins |
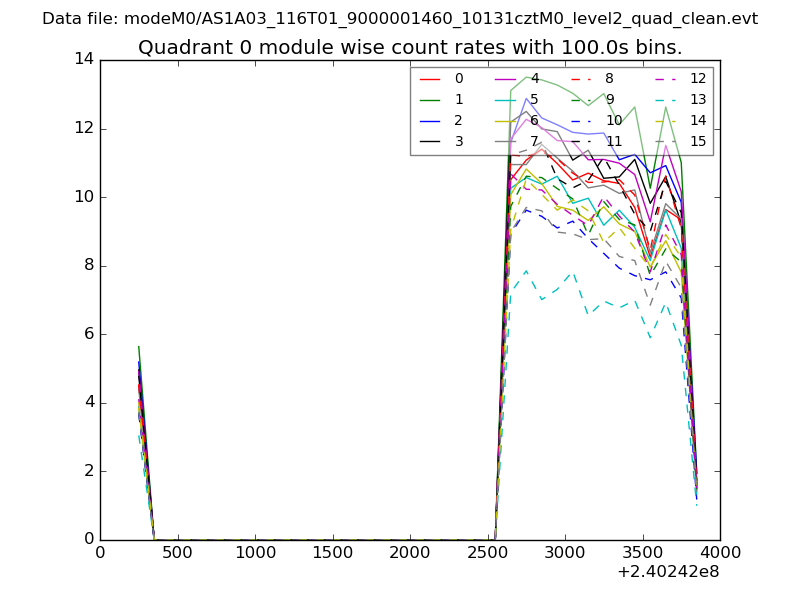 |
 |
| Module-wise count rates for Quadrant B Data is divided into 100 sec bins |
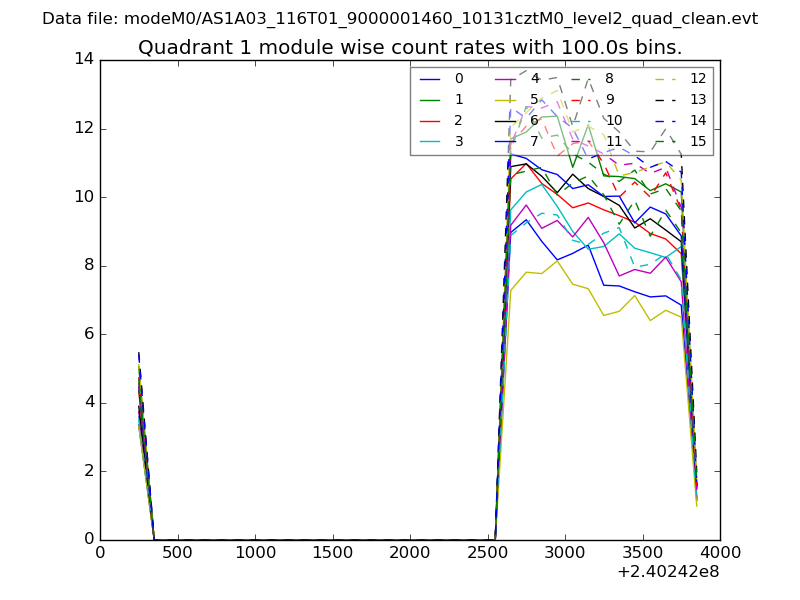 |
 |
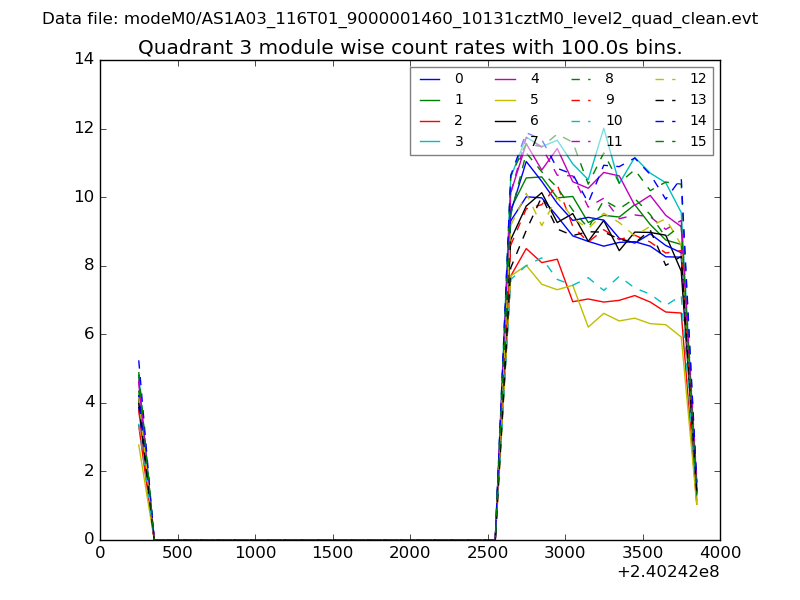
| Module-wise count rates for Quadrant C Data is divided into 100 sec bins |
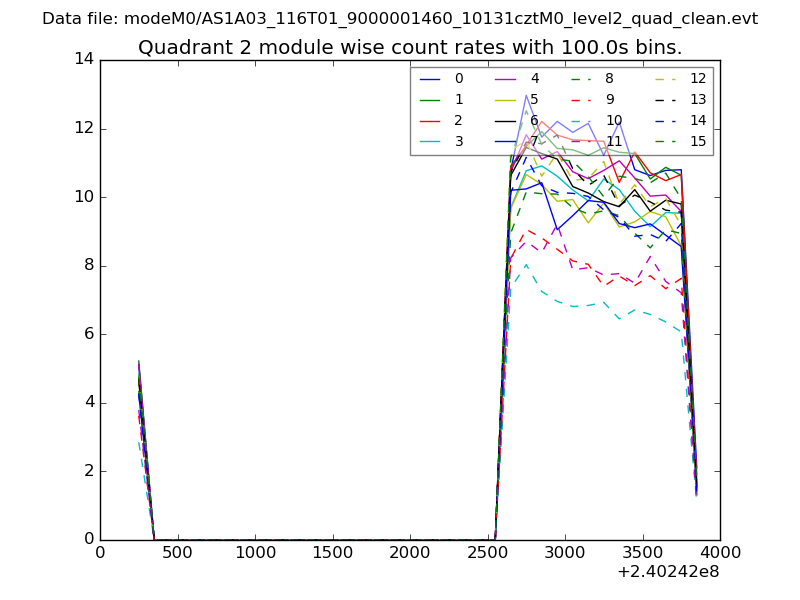 |
 |
| Module-wise count rates for Quadrant D Data is divided into 100 sec bins |
 |
 |
| Parameter | Plot |
|---|---|
| CZT HV Monitor | 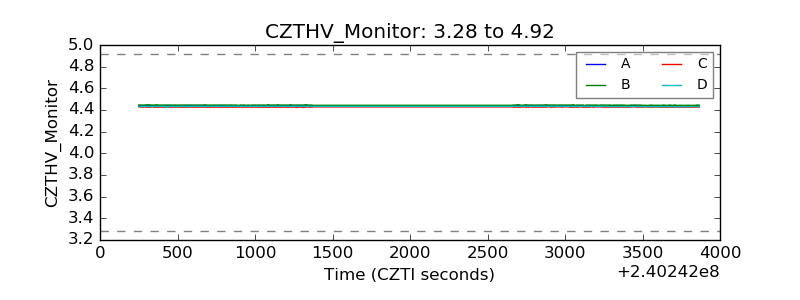 |
| D_VDD | 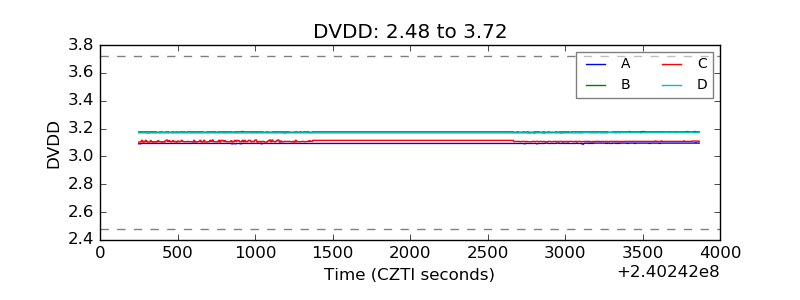 |
| Temperature 1 | 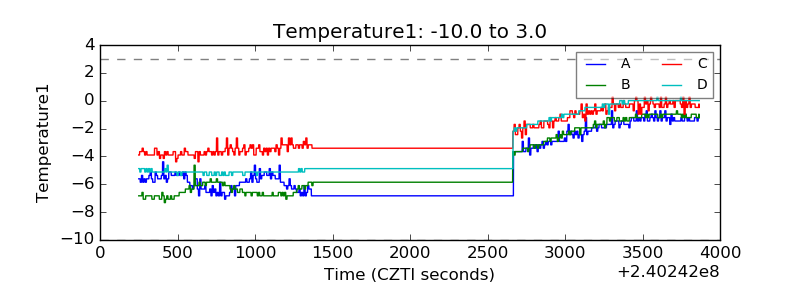 |
| Veto HV Monitor | 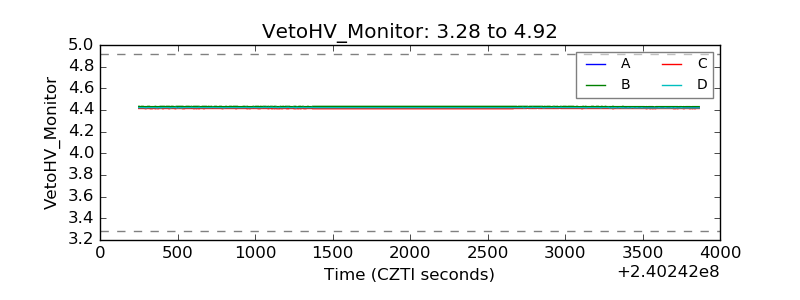 |
| Veto LLD | 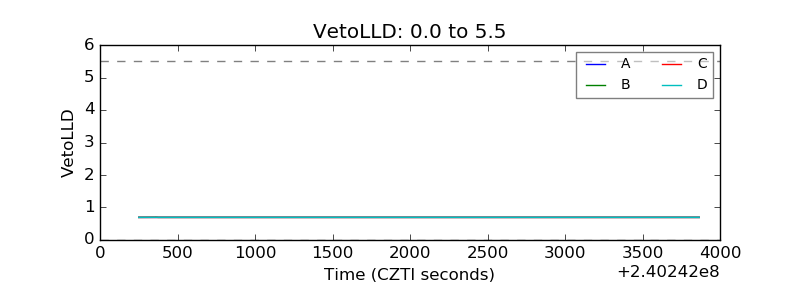 |
| Alpha Counter | 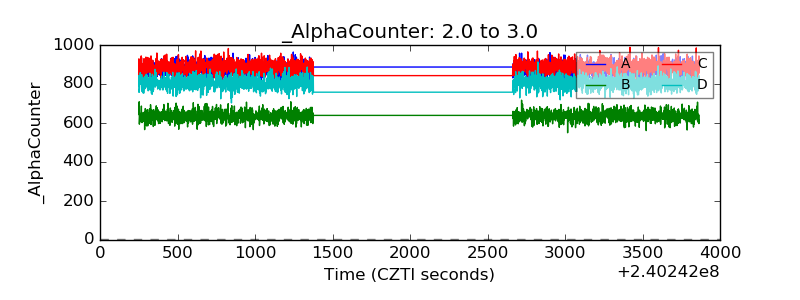 |
| _CPM_Rate | 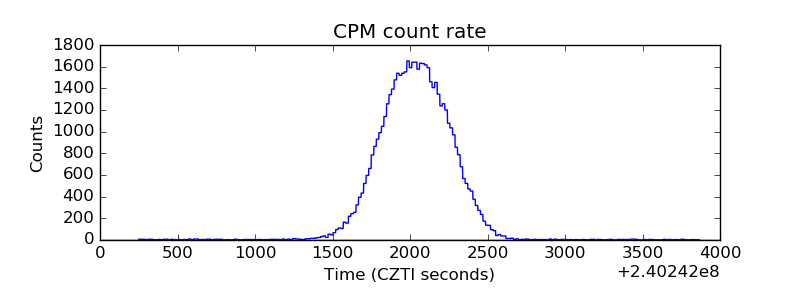 |
| CZT Counter | 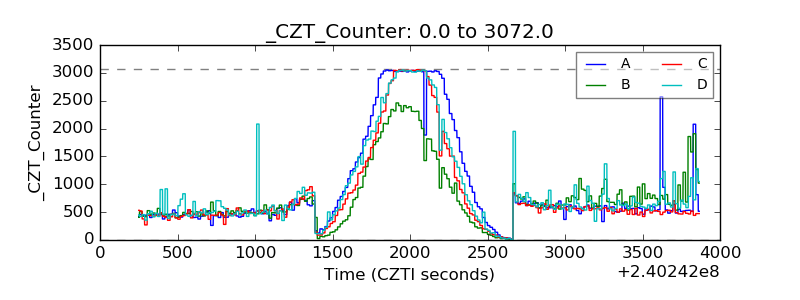 |
| +2.5 Volts monitor |  |
| +5 Volts monitor |  |
| _ROLL_ROT | 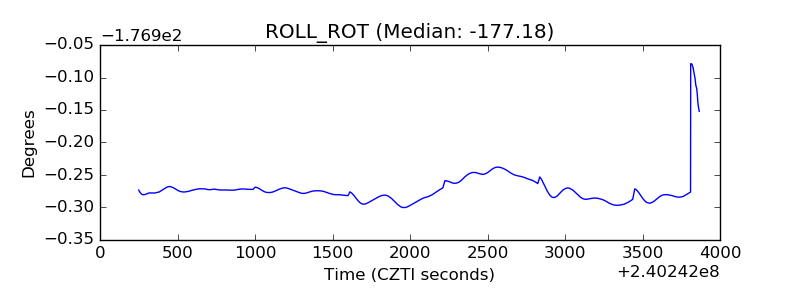 |
| _Roll_DEC | 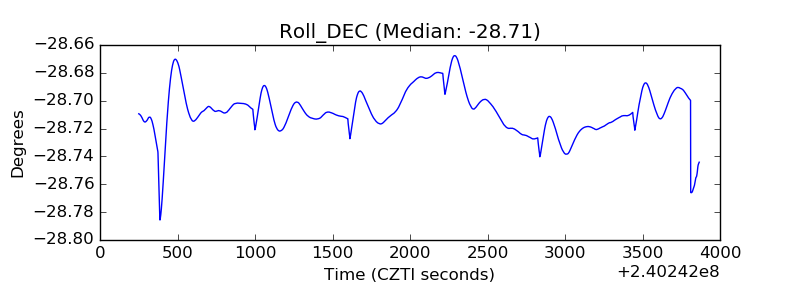 |
| _Roll_RA | 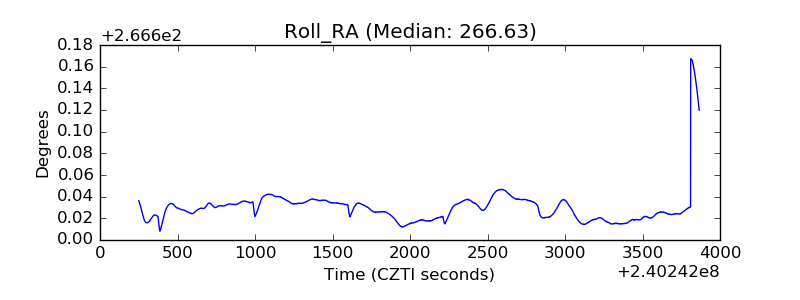 |
| Veto Counter | 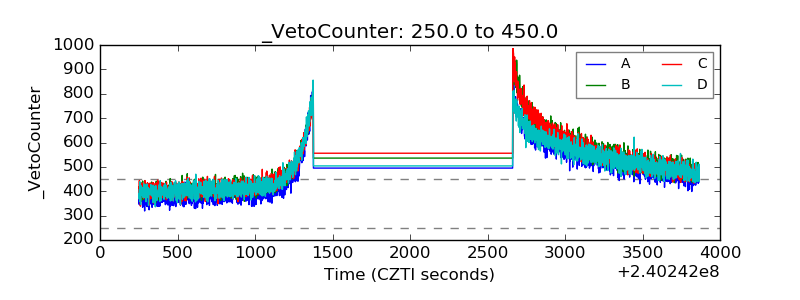 |