| Param | Original file | Final file |
|---|---|---|
| Filename | modeM0/AS1A03_116T01_9000001460_10132cztM0_level2.evt | modeM0/AS1A03_116T01_9000001460_10132cztM0_level2_quad_clean.evt |
| Size (bytes) | 525,430,080 | 105,295,680 |
| Size | 501.1 MB | 100.4 MB |
| Events in quadrant A | 3,249,526 | 703,686 |
| Events in quadrant B | 4,714,367 | 697,272 |
| Events in quadrant C | 3,047,524 | 691,695 |
| Events in quadrant D | 4,469,055 | 651,302 |
| Mode M9 | |||
|---|---|---|---|
| Quadrant | BADHDUFLAG | Total packets | Discarded packets |
| A | 0 | 12 | 0 |
| B | 0 | 12 | 0 |
| C | 0 | 12 | 0 |
| D | 0 | 12 | 0 |
| Mode SS | |||
|---|---|---|---|
| Quadrant | BADHDUFLAG | Total packets | Discarded packets |
| A | 0 | 130 | 0 |
| B | 0 | 130 | 0 |
| C | 0 | 130 | 0 |
| D | 0 | 130 | 0 |
| Mode M0 | |||
|---|---|---|---|
| Quadrant | BADHDUFLAG | Total packets | Discarded packets |
| A | 0 | 13796 | 2 |
| B | 0 | 18479 | 1 |
| C | 0 | 13275 | 1 |
| D | 0 | 17662 | 1 |
| Quadrant | Total seconds | Saturated seconds | Saturation percentage |
|---|---|---|---|
| A | 6374 | 155 | 2.431754% |
| B | 6374 | 248 | 3.890806% |
| C | 6374 | 80 | 1.255099% |
| D | 6374 | 251 | 3.937873% |
Noise dominated data is calculated using 1-second bins in cleaned event files. If a bin has >2000 counts, and if more than 50% of those come from <1% of pixels, then it is considered to be noise-dominated and hence unusable.
| Quadrant | # 1 sec bins | Bins with >0 counts | Bins with >2000 counts | High rate bins dominated by noise | Noise dominated (total time) | Noise dominated (detector-on time) | Marked lightcurve |
|---|---|---|---|---|---|---|---|
| A | 7614 | 6374 | 28 | 28 | 0.37% | 0.44% | 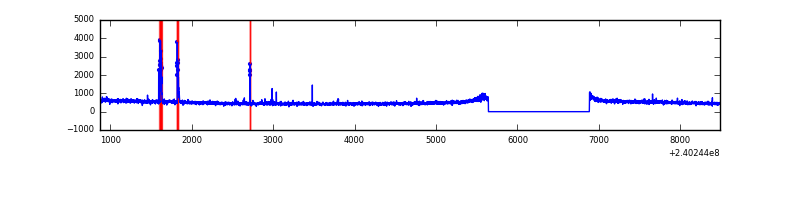 |
| B | 7614 | 6374 | 126 | 126 | 1.65% | 1.98% | 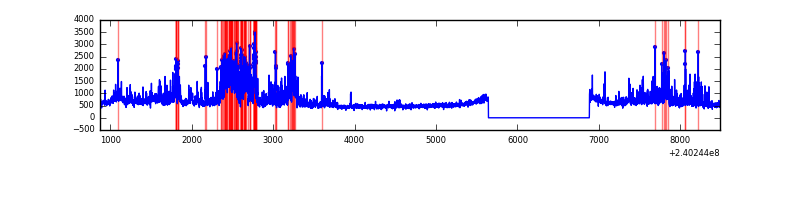 |
| C | 7614 | 6375 | 0 | 0 | 0.00% | 0.00% | 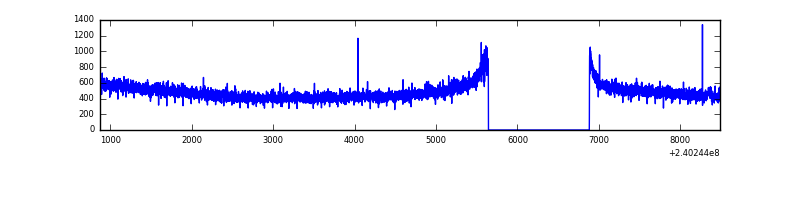 |
| D | 7614 | 6374 | 151 | 151 | 1.98% | 2.37% | 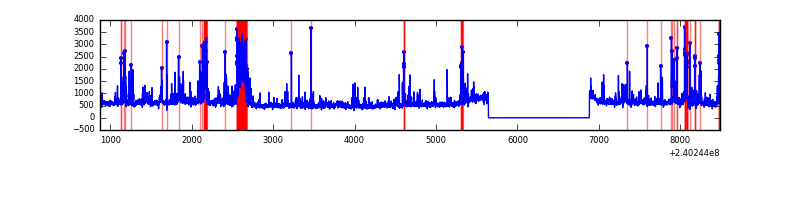 |
Top three noisy pixels from each quadrant. If the there are fewer than three noisy pixels in the level2.evt file, extra rows are filled as -1
| Pixel properties | Quadrant properties | ||||||
|---|---|---|---|---|---|---|---|
| Quadrant | DetID | PixID | Counts | Sigma | Mean | Median | Sigma |
| A | 15 | 174 | 91202 | 545.34 | 815 | 802 | 165.8 |
| A | 8 | 192 | 11874 | 66.79 | 815 | 802 | 165.8 |
| A | 8 | 15 | 8571 | 46.87 | 815 | 802 | 165.8 |
| B | 4 | 81 | 1362463 | 8969.32 | 807 | 790 | 151.8 |
| B | 0 | 214 | 72815 | 474.43 | 807 | 790 | 151.8 |
| B | 0 | 219 | 60166 | 391.11 | 807 | 790 | 151.8 |
| C | 14 | 67 | 19429 | 104.77 | 774 | 780 | 178.0 |
| C | 13 | 61 | 5991 | 29.28 | 774 | 780 | 178.0 |
| C | 4 | 175 | 4150 | 18.93 | 774 | 780 | 178.0 |
| D | 4 | 95 | 620186 | 3339.24 | 774 | 754 | 185.5 |
| D | 8 | 195 | 442515 | 2381.45 | 774 | 754 | 185.5 |
| D | 2 | 152 | 134514 | 721.07 | 774 | 754 | 185.5 |
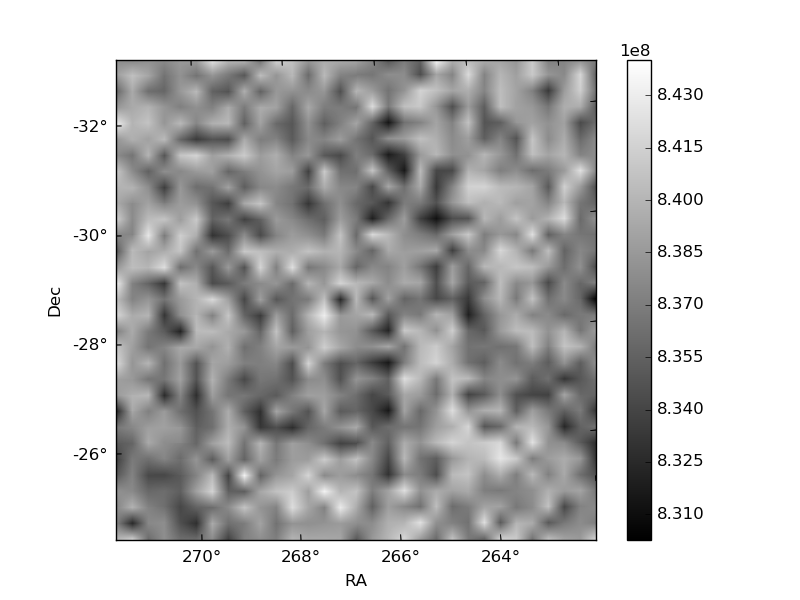
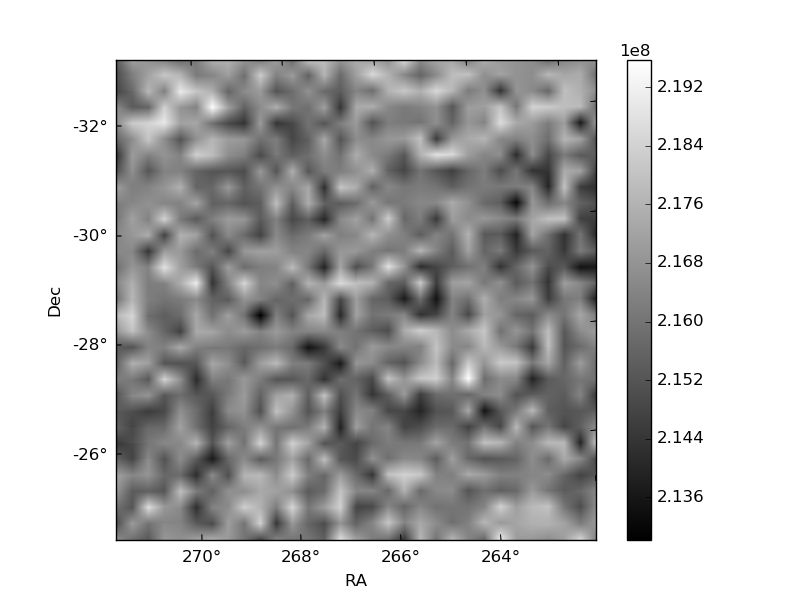
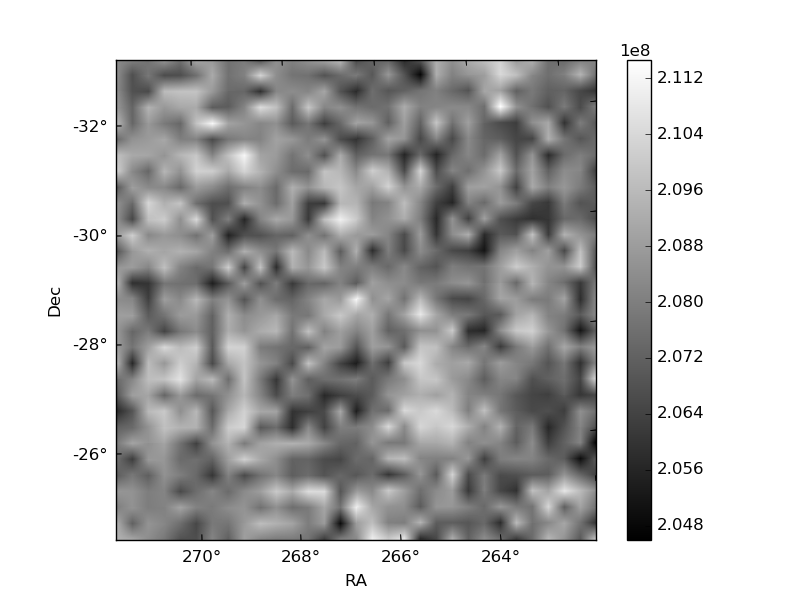
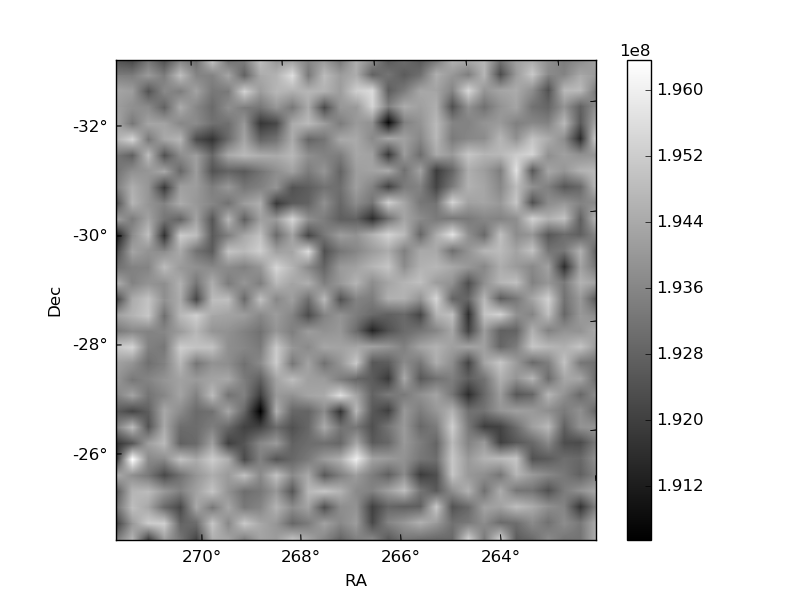
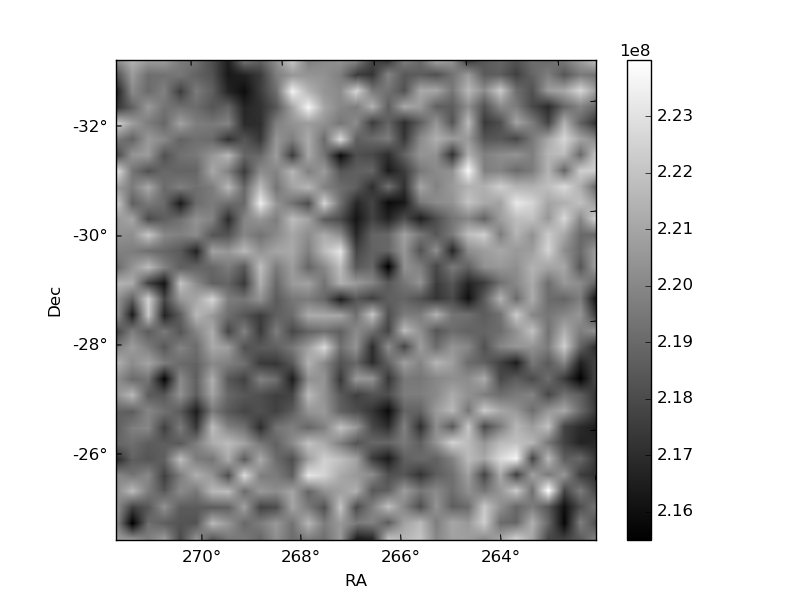
Histogram calculated using DETX and DETY for each event in the final _common_clean file
| Quadrant A | 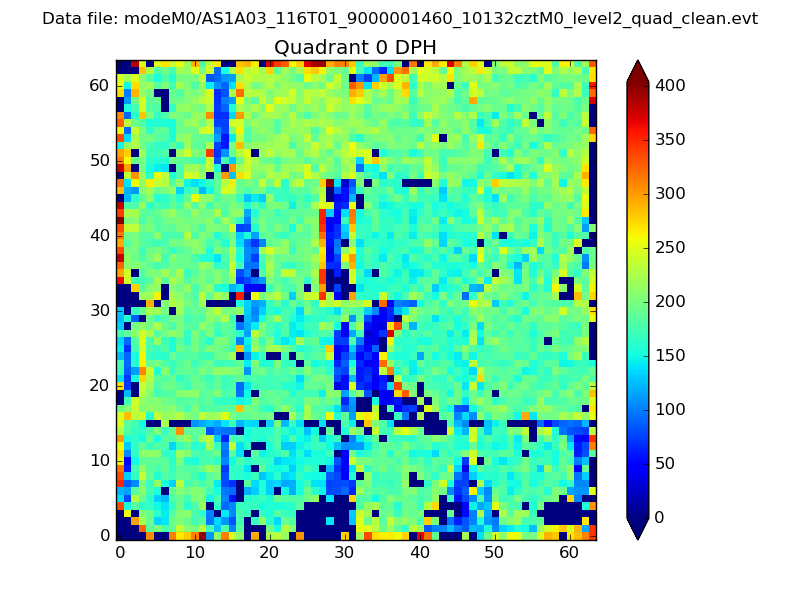 |
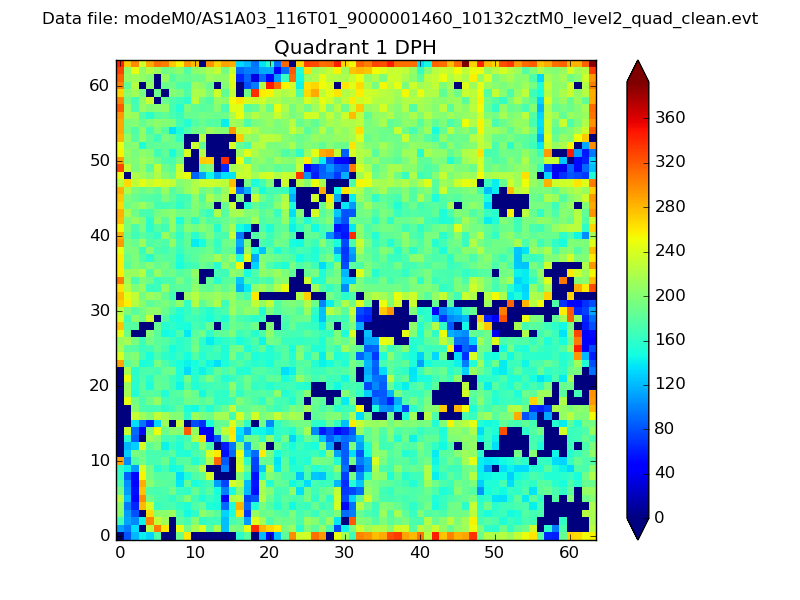 |
Quadrant B |
|---|---|---|---|
| Quadrant D | 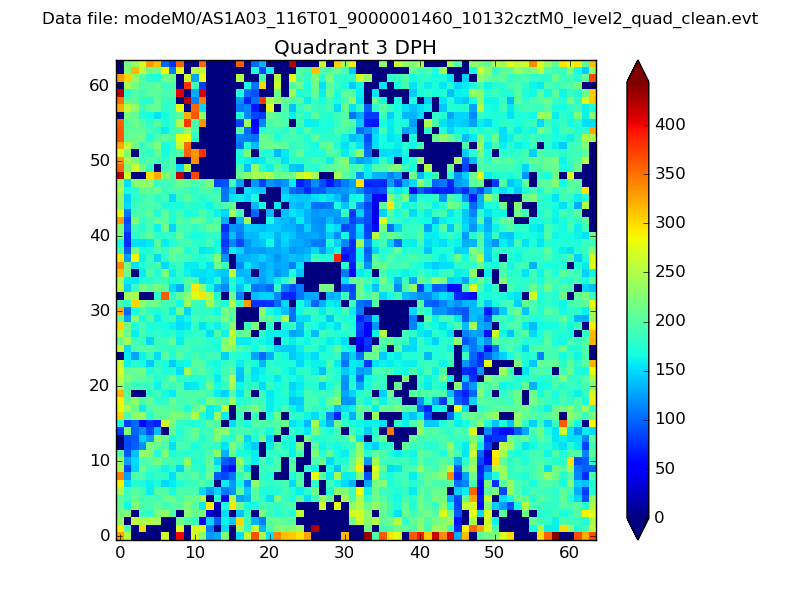 |
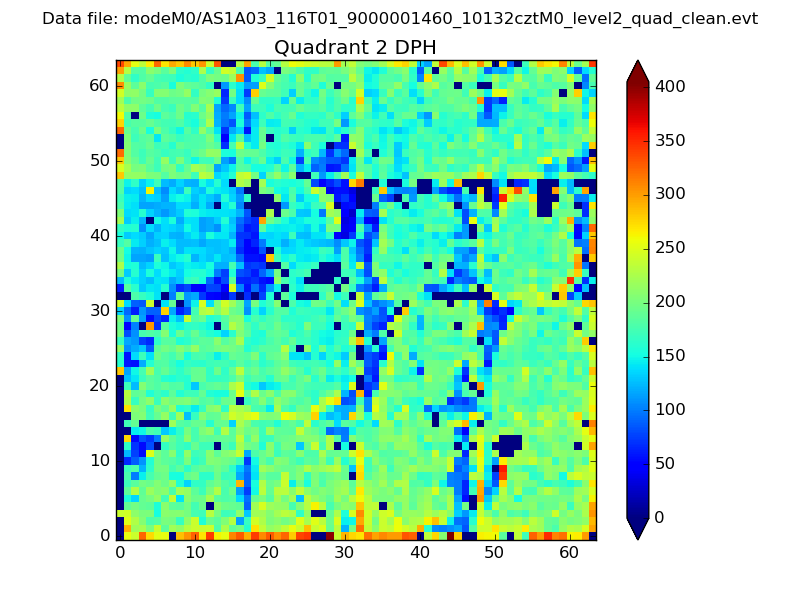 |
Quadrant C |
| Plot type | Count rate plots | Images |
|---|---|---|
| Comparison with Poisson distribution Blue bars denote a histogram of data divided into 1 sec bins. Red curve is a Poisson curve with rate = median count rate of data. |
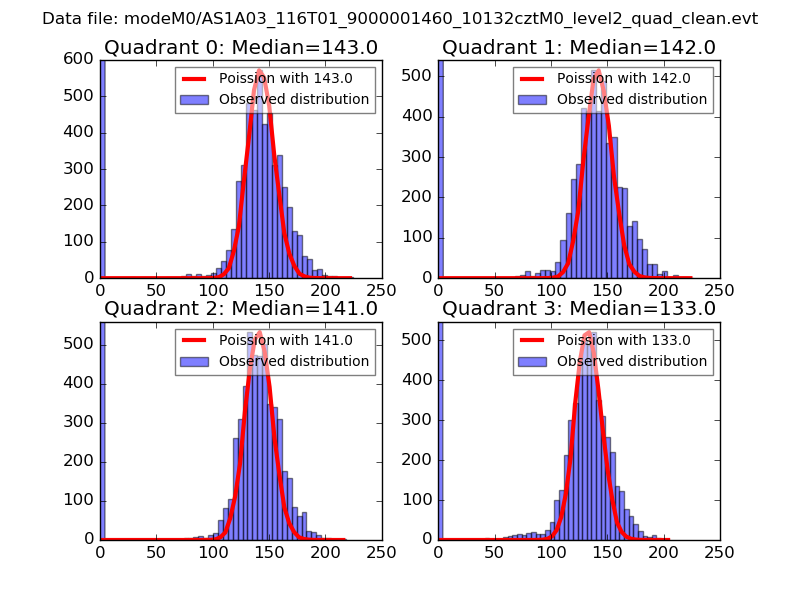 |
 |
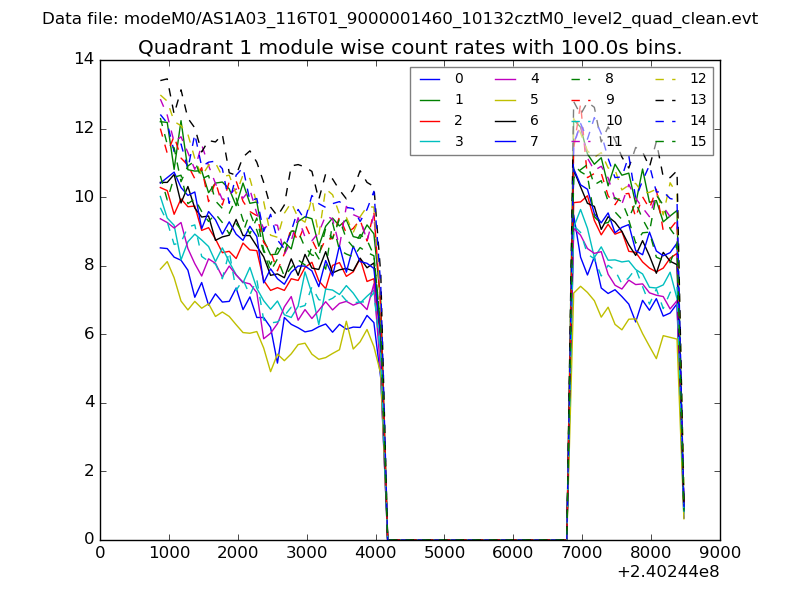
| Quadrant-wise count rates Data is divided into 100 sec bins |
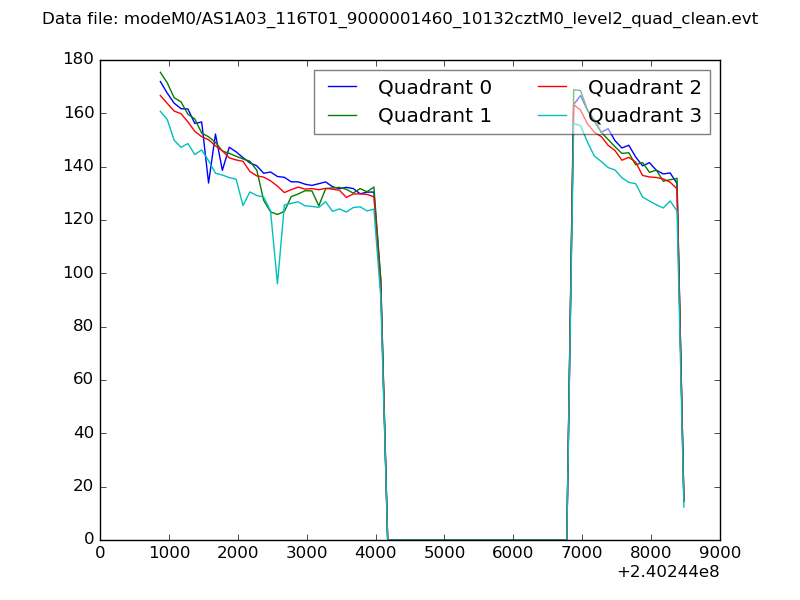 |
|
| Module-wise count rates for Quadrant A Data is divided into 100 sec bins |
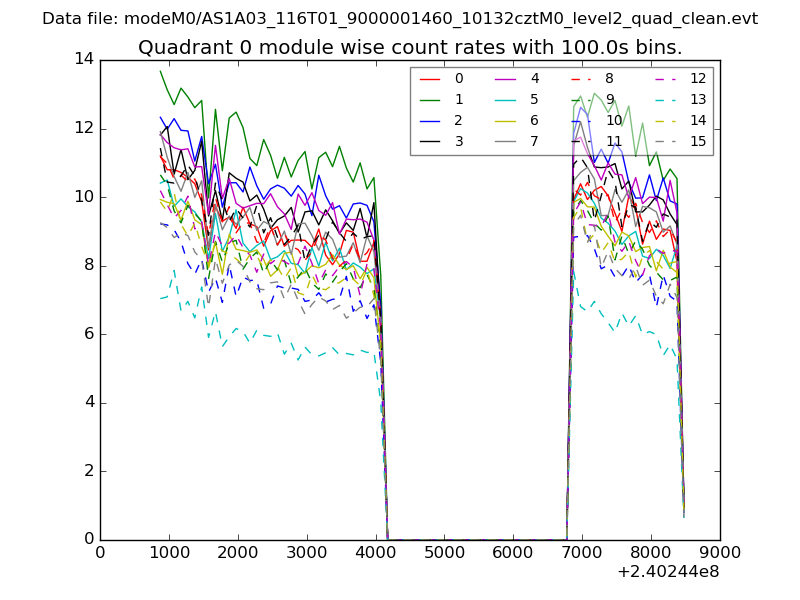 |
 |
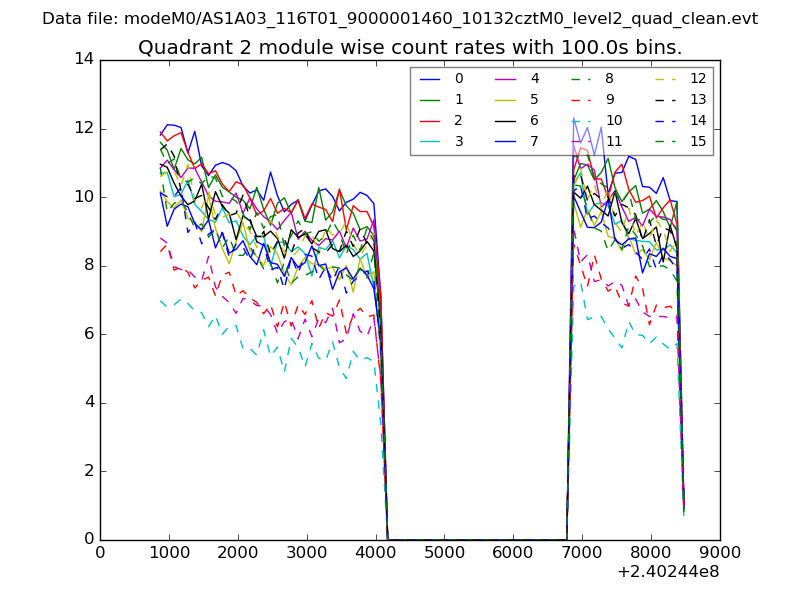
| Module-wise count rates for Quadrant B Data is divided into 100 sec bins |
 |
 |
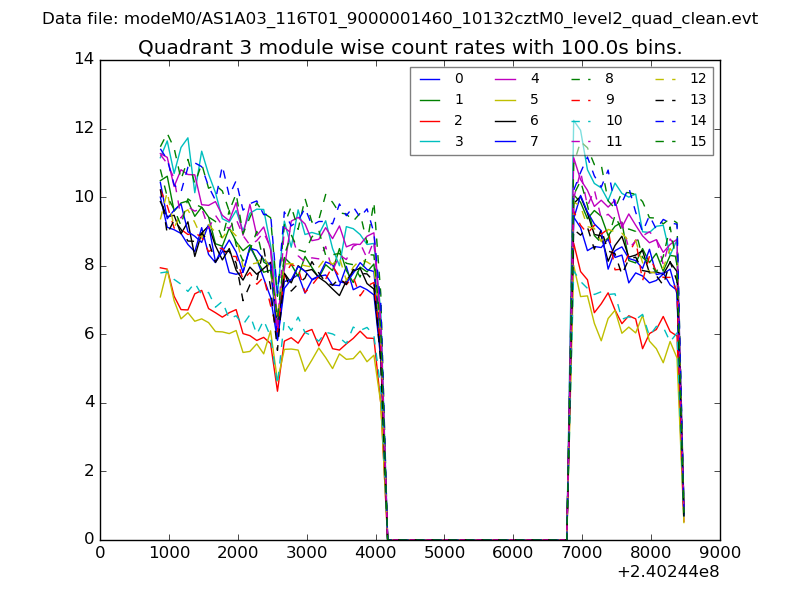
| Module-wise count rates for Quadrant C Data is divided into 100 sec bins |
 |
 |
| Module-wise count rates for Quadrant D Data is divided into 100 sec bins |
 |
 |
| Parameter | Plot |
|---|---|
| CZT HV Monitor | 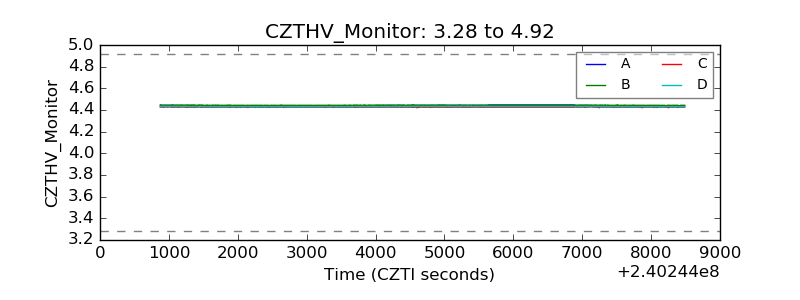 |
| D_VDD | 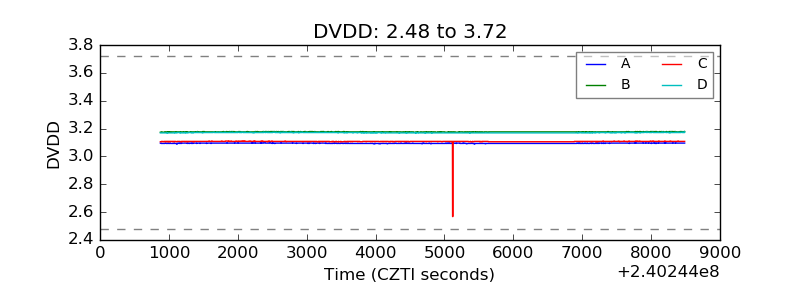 |
| Temperature 1 | 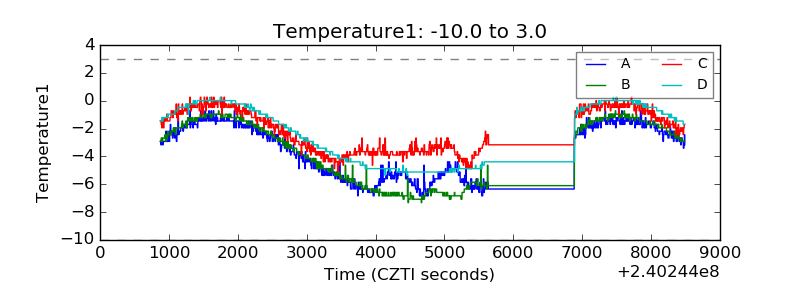 |
| Veto HV Monitor | 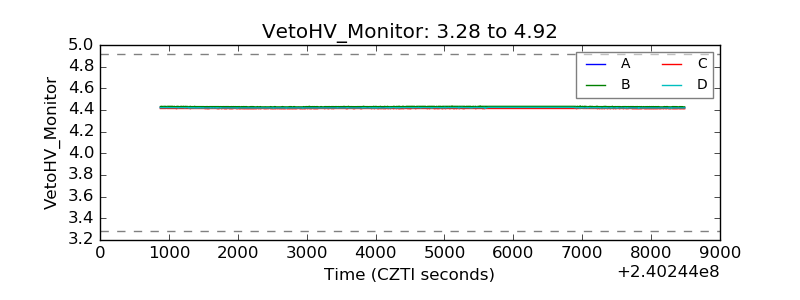 |
| Veto LLD | 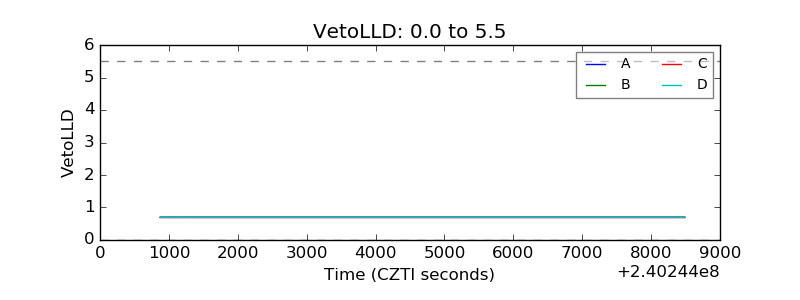 |
| Alpha Counter | 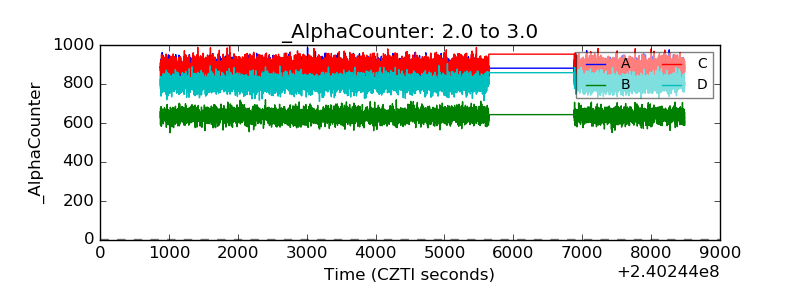 |
| _CPM_Rate | 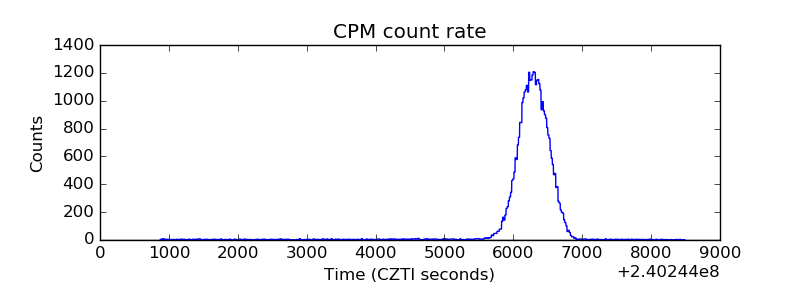 |
| CZT Counter | 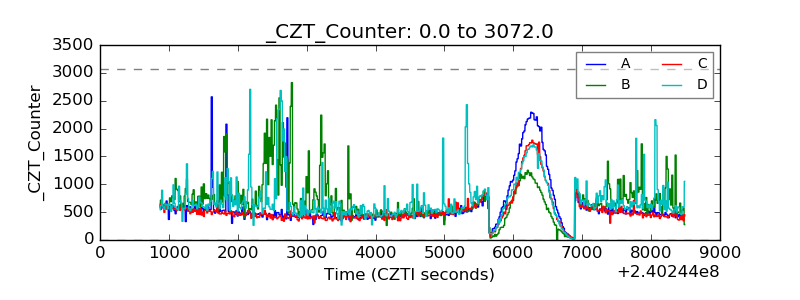 |
| +2.5 Volts monitor |  |
| +5 Volts monitor |  |
| _ROLL_ROT | 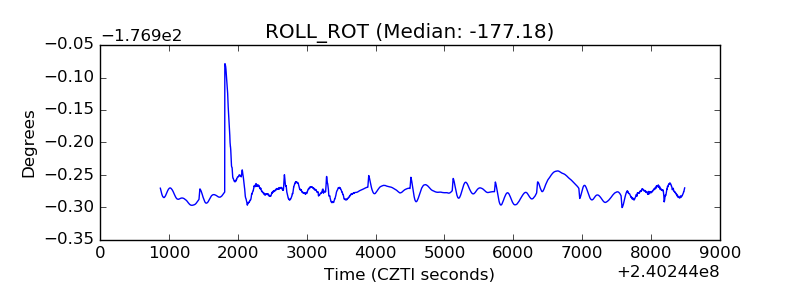 |
| _Roll_DEC | 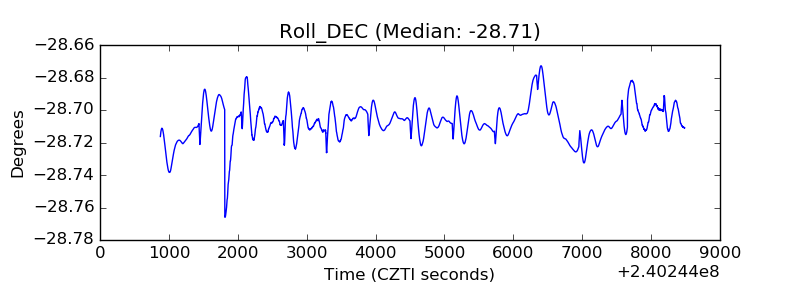 |
| _Roll_RA | 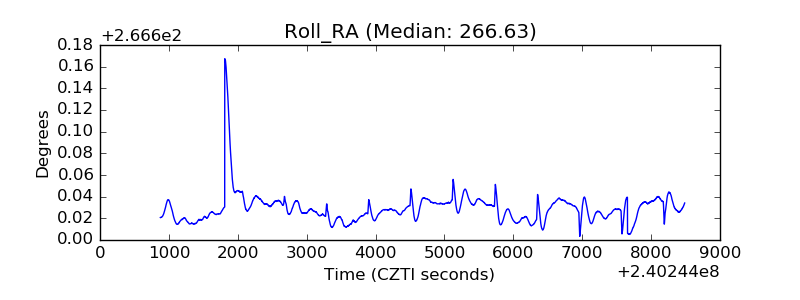 |
| Veto Counter | 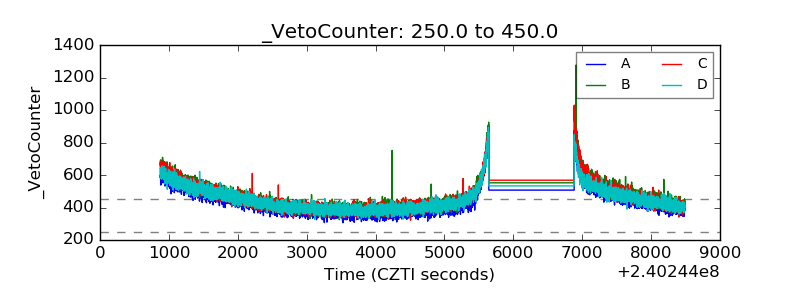 |