| Param | Original file | Final file |
|---|---|---|
| Filename | modeM0/AS1A03_116T01_9000001460_10133cztM0_level2.evt | modeM0/AS1A03_116T01_9000001460_10133cztM0_level2_quad_clean.evt |
| Size (bytes) | 468,100,800 | 88,698,240 |
| Size | 446.4 MB | 84.6 MB |
| Events in quadrant A | 2,969,571 | 576,729 |
| Events in quadrant B | 3,813,123 | 575,121 |
| Events in quadrant C | 2,858,708 | 566,769 |
| Events in quadrant D | 4,112,494 | 533,064 |
| Mode M9 | |||
|---|---|---|---|
| Quadrant | BADHDUFLAG | Total packets | Discarded packets |
| A | 0 | 11 | 0 |
| B | 0 | 11 | 0 |
| C | 0 | 11 | 0 |
| D | 0 | 11 | 0 |
| Mode SS | |||
|---|---|---|---|
| Quadrant | BADHDUFLAG | Total packets | Discarded packets |
| A | 0 | 128 | 0 |
| B | 0 | 128 | 0 |
| C | 0 | 128 | 0 |
| D | 0 | 128 | 0 |
| Mode M0 | |||
|---|---|---|---|
| Quadrant | BADHDUFLAG | Total packets | Discarded packets |
| A | 0 | 12971 | 3 |
| B | 0 | 15399 | 2 |
| C | 0 | 12808 | 2 |
| D | 0 | 16372 | 2 |
| Quadrant | Total seconds | Saturated seconds | Saturation percentage |
|---|---|---|---|
| A | 6217 | 80 | 1.286794% |
| B | 6217 | 108 | 1.737172% |
| C | 6217 | 42 | 0.675567% |
| D | 6217 | 163 | 2.621843% |
Noise dominated data is calculated using 1-second bins in cleaned event files. If a bin has >2000 counts, and if more than 50% of those come from <1% of pixels, then it is considered to be noise-dominated and hence unusable.
| Quadrant | # 1 sec bins | Bins with >0 counts | Bins with >2000 counts | High rate bins dominated by noise | Noise dominated (total time) | Noise dominated (detector-on time) | Marked lightcurve |
|---|---|---|---|---|---|---|---|
| A | 7382 | 6218 | 0 | 0 | 0.00% | 0.00% | 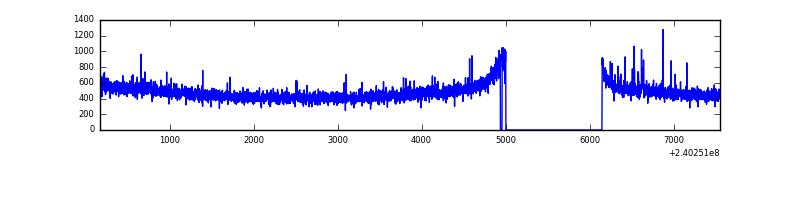 |
| B | 7382 | 6218 | 26 | 26 | 0.35% | 0.42% | 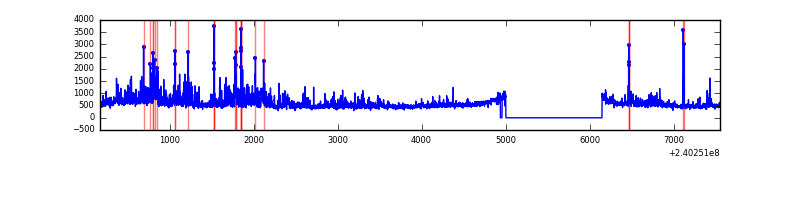 |
| C | 7382 | 6219 | 0 | 0 | 0.00% | 0.00% | 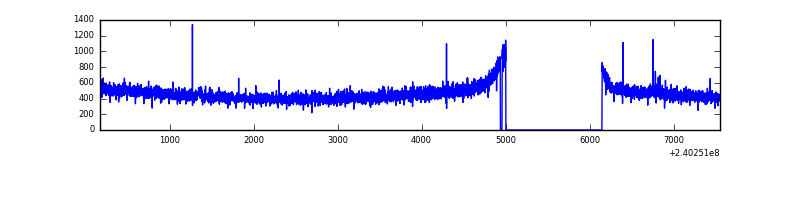 |
| D | 7382 | 6218 | 107 | 107 | 1.45% | 1.72% | 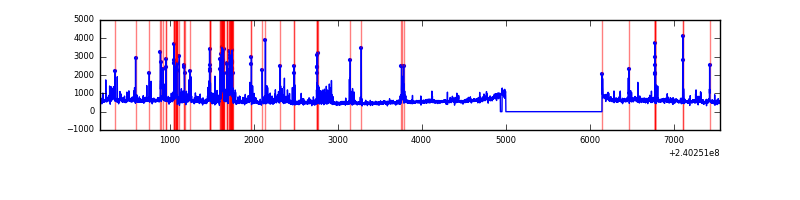 |
Top three noisy pixels from each quadrant. If the there are fewer than three noisy pixels in the level2.evt file, extra rows are filled as -1
| Pixel properties | Quadrant properties | ||||||
|---|---|---|---|---|---|---|---|
| Quadrant | DetID | PixID | Counts | Sigma | Mean | Median | Sigma |
| A | 8 | 15 | 14244 | 85.76 | 765 | 749 | 157.4 |
| A | 15 | 174 | 7923 | 45.59 | 765 | 749 | 157.4 |
| A | 0 | 226 | 7019 | 39.84 | 765 | 749 | 157.4 |
| B | 4 | 81 | 674288 | 4597.48 | 762 | 744 | 146.5 |
| B | 0 | 189 | 42192 | 282.92 | 762 | 744 | 146.5 |
| B | 0 | 198 | 34971 | 233.63 | 762 | 744 | 146.5 |
| C | 14 | 67 | 10560 | 58.14 | 729 | 734 | 169.0 |
| C | 13 | 61 | 5578 | 28.66 | 729 | 734 | 169.0 |
| C | 14 | 234 | 5382 | 27.5 | 729 | 734 | 169.0 |
| D | 8 | 195 | 471843 | 2664.97 | 726 | 705 | 176.8 |
| D | 4 | 95 | 317144 | 1789.92 | 726 | 705 | 176.8 |
| D | 2 | 152 | 160183 | 902.08 | 726 | 705 | 176.8 |
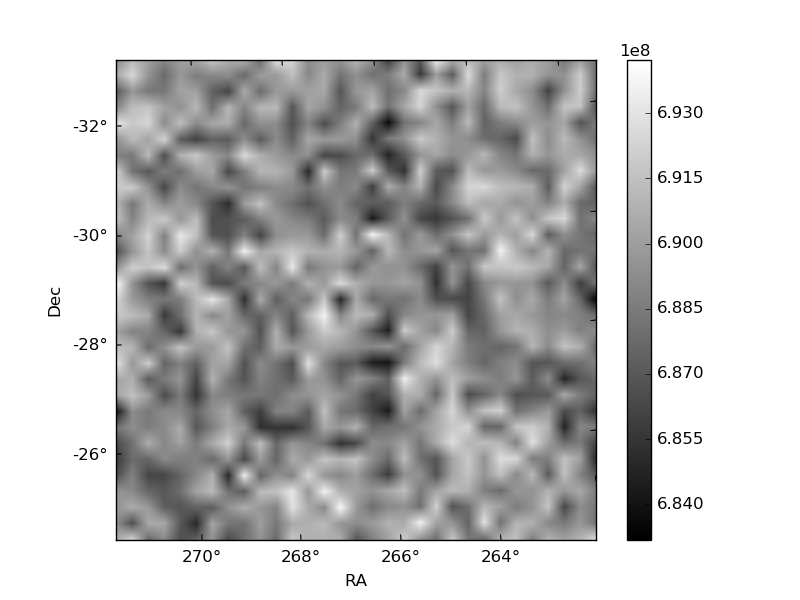
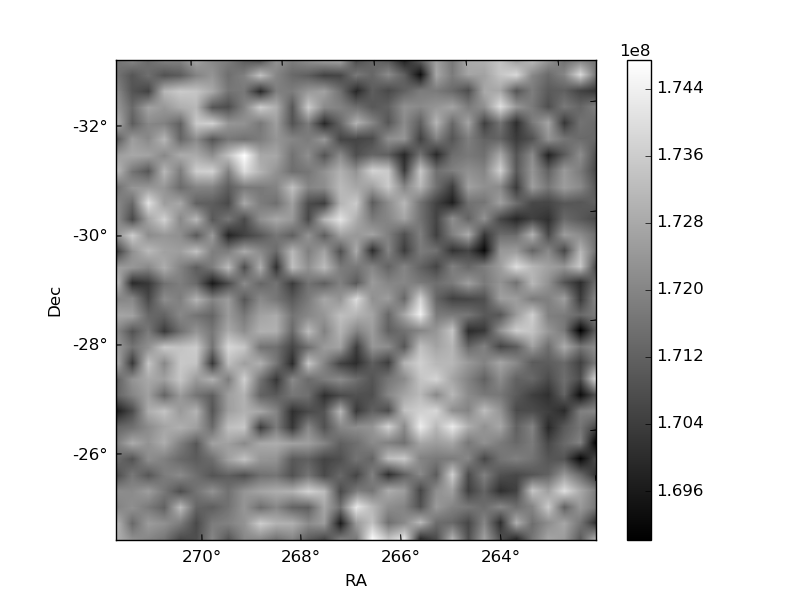
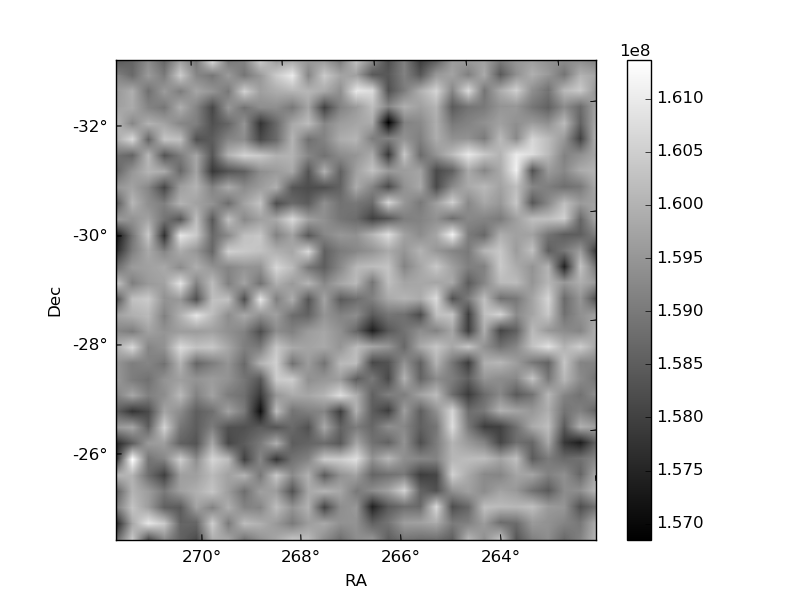
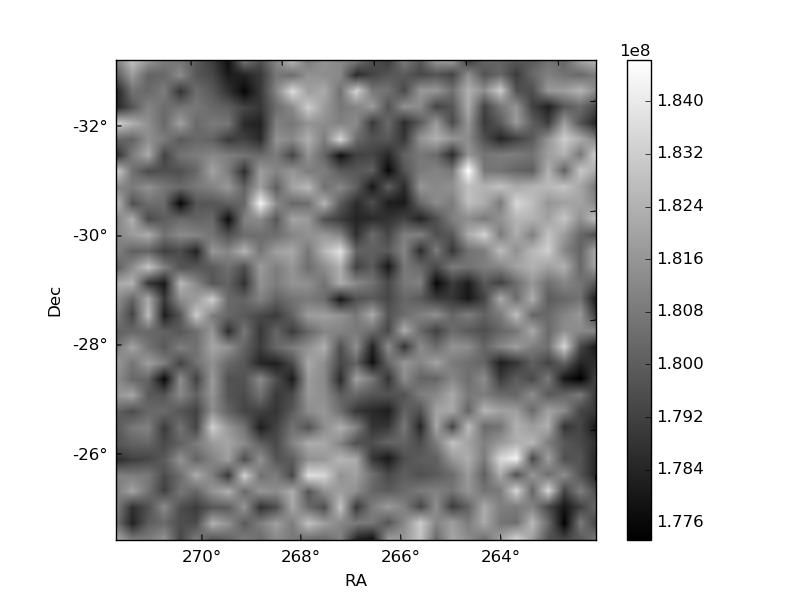
Histogram calculated using DETX and DETY for each event in the final _common_clean file
| Quadrant A | 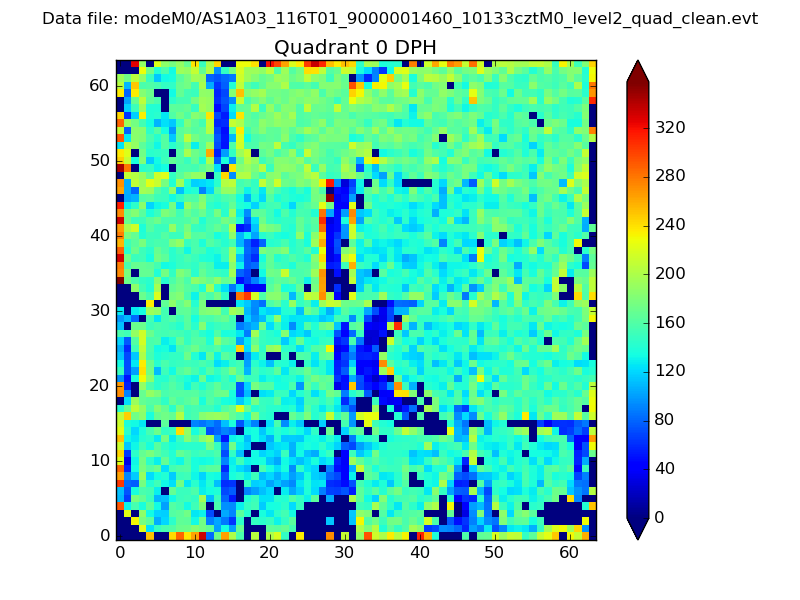 |
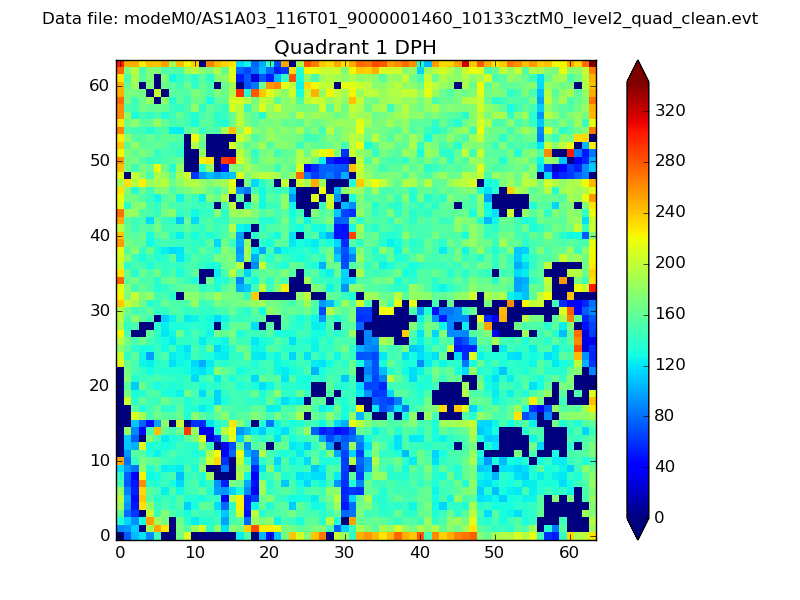 |
Quadrant B |
|---|---|---|---|
| Quadrant D | 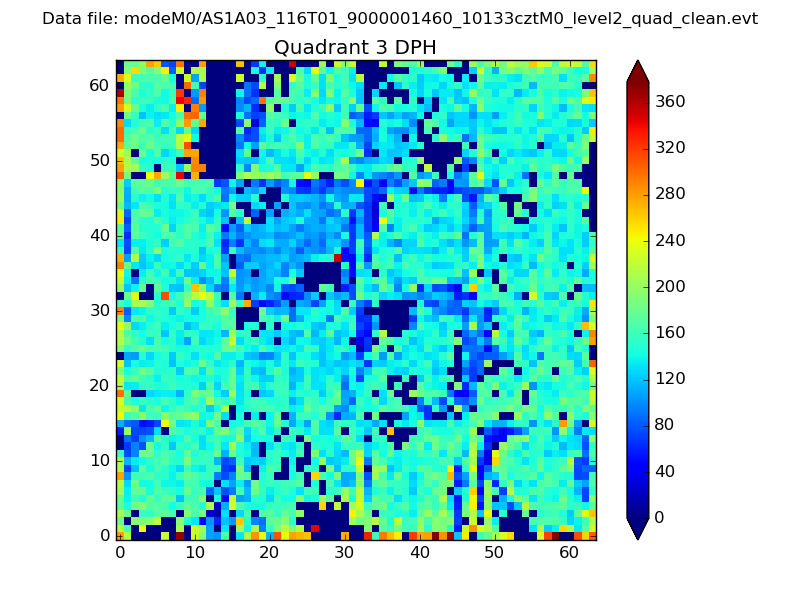 |
 |
Quadrant C |
| Plot type | Count rate plots | Images |
|---|---|---|
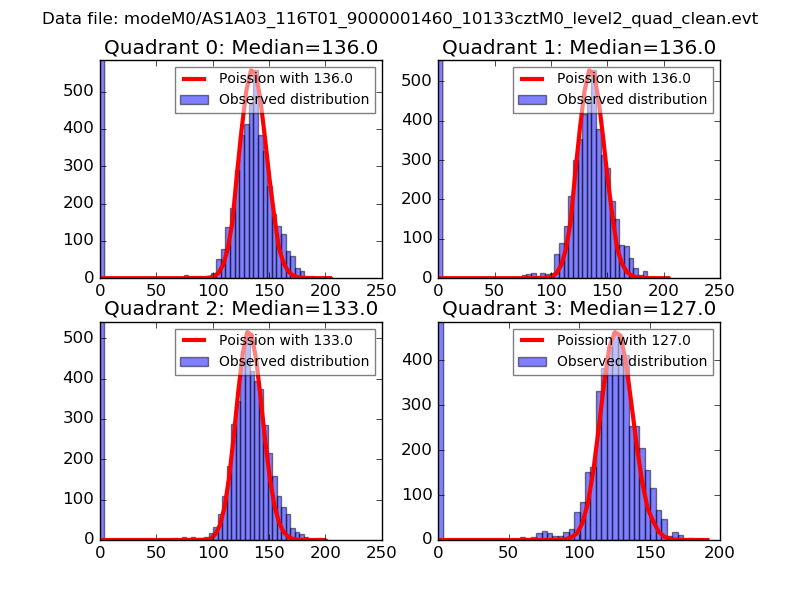
| Comparison with Poisson distribution Blue bars denote a histogram of data divided into 1 sec bins. Red curve is a Poisson curve with rate = median count rate of data. |
 |
 |
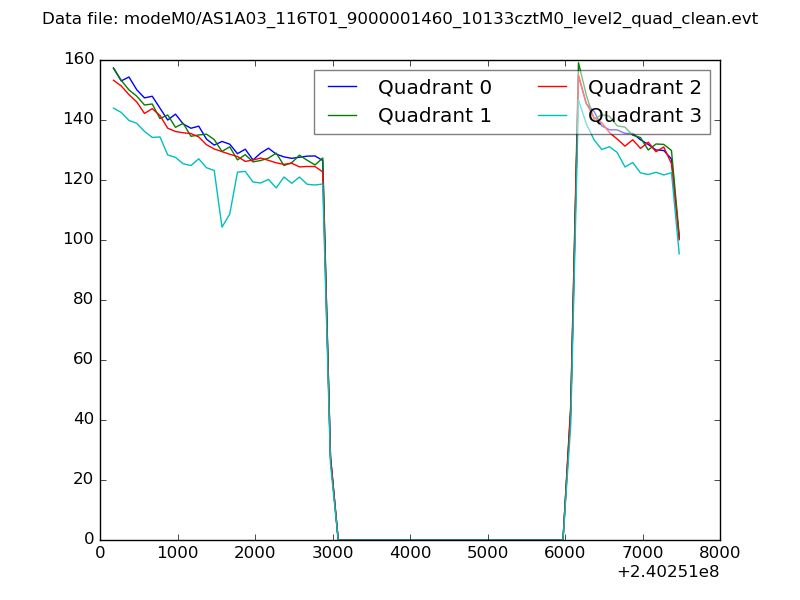
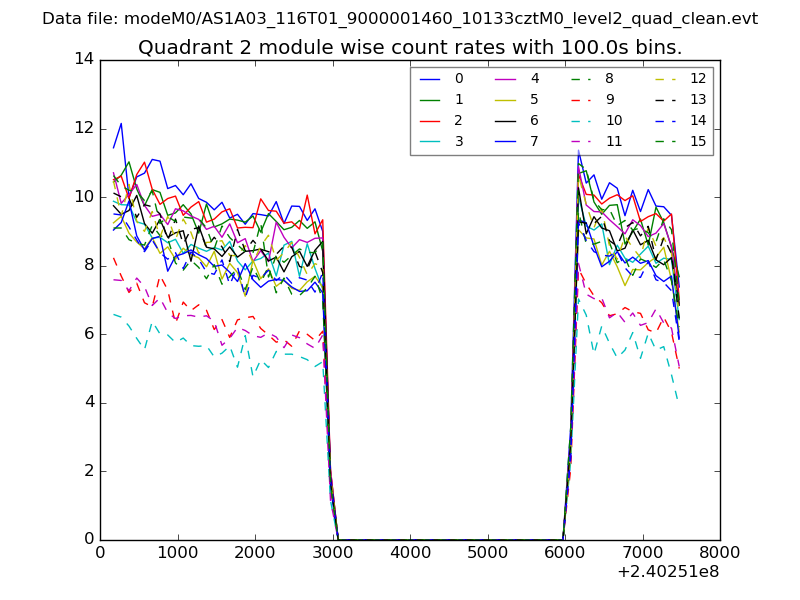
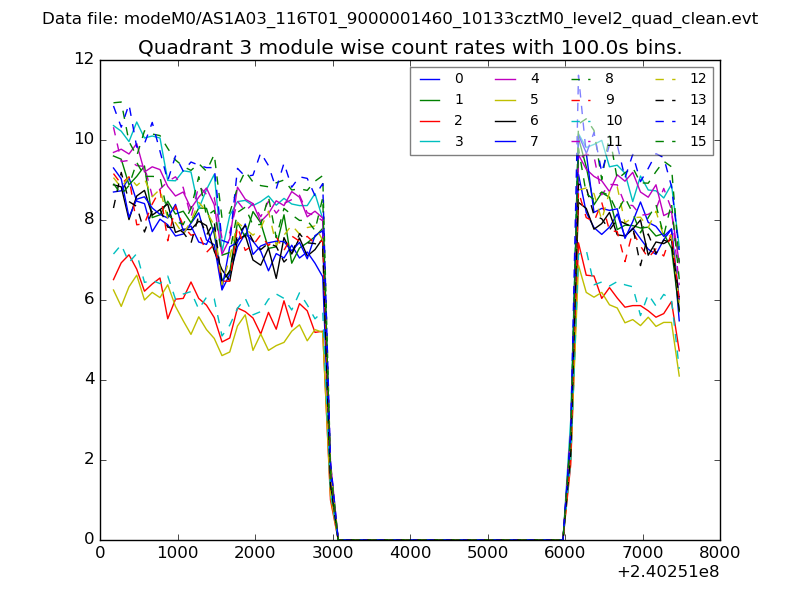
| Quadrant-wise count rates Data is divided into 100 sec bins |
 |
|
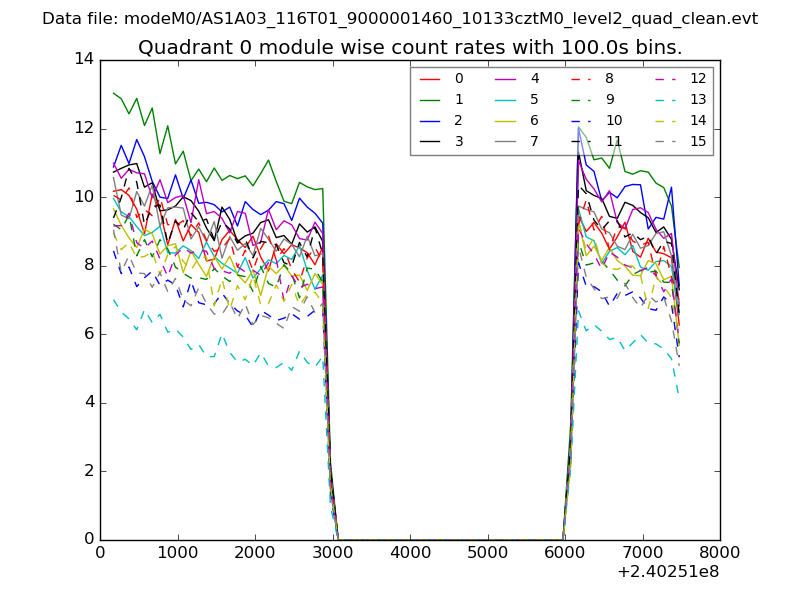
| Module-wise count rates for Quadrant A Data is divided into 100 sec bins |
 |
 |
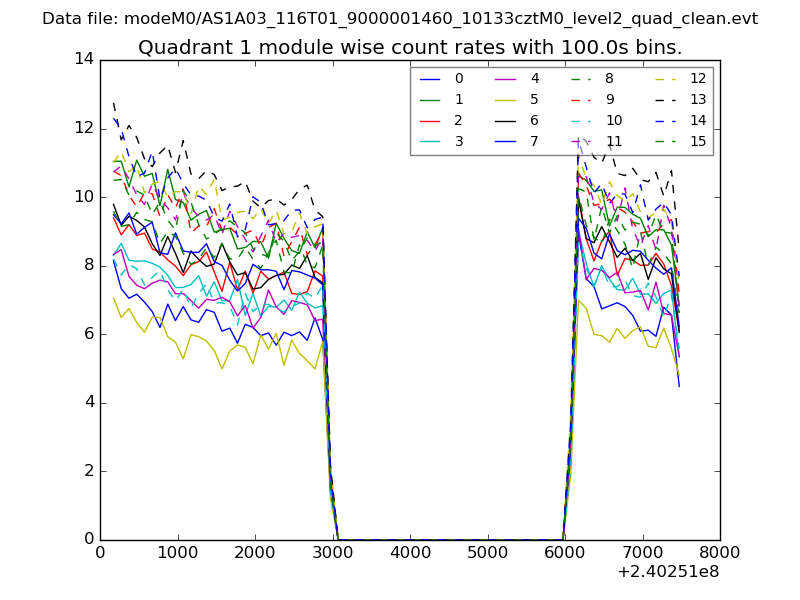
| Module-wise count rates for Quadrant B Data is divided into 100 sec bins |
 |
 |
| Module-wise count rates for Quadrant C Data is divided into 100 sec bins |
 |
 |
| Module-wise count rates for Quadrant D Data is divided into 100 sec bins |
 |
 |
| Parameter | Plot |
|---|---|
| CZT HV Monitor | 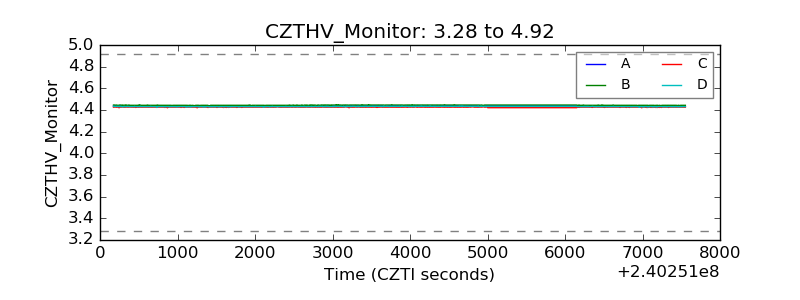 |
| D_VDD | 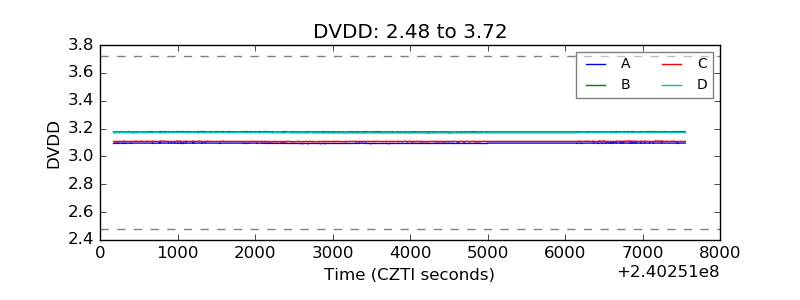 |
| Temperature 1 | 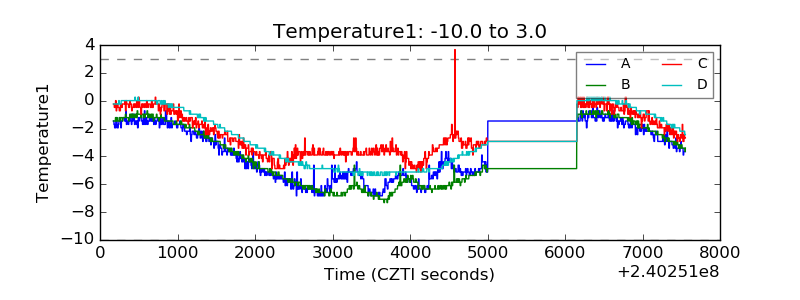 |
| Veto HV Monitor | 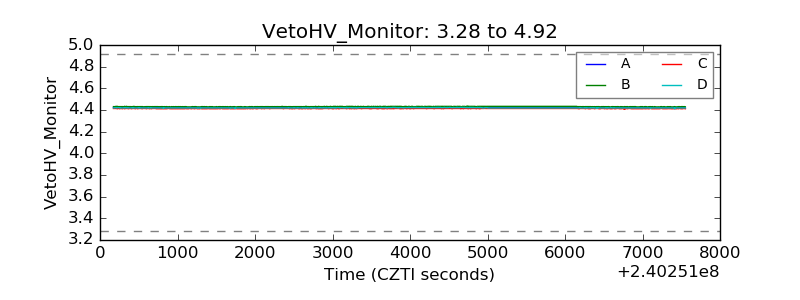 |
| Veto LLD | 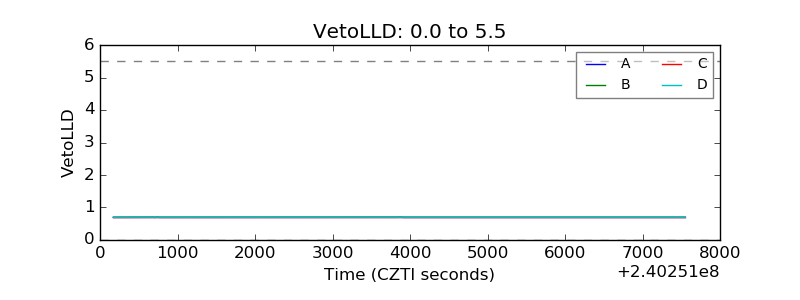 |
| Alpha Counter | 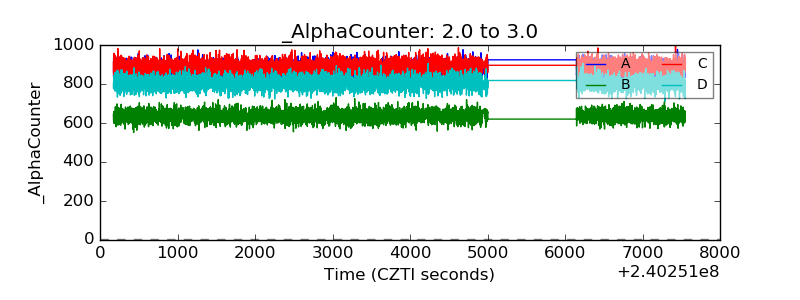 |
| _CPM_Rate | 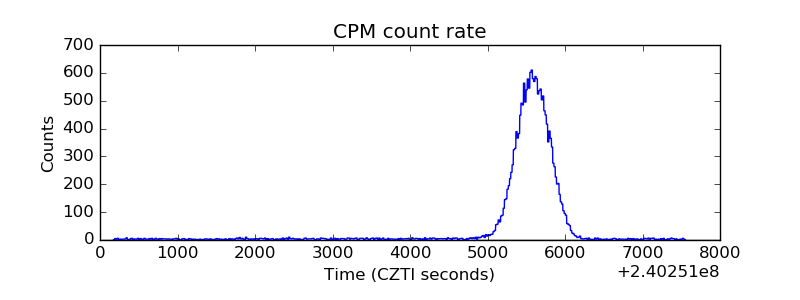 |
| CZT Counter | 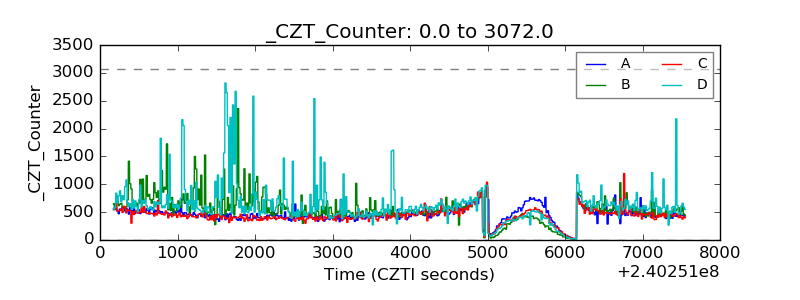 |
| +2.5 Volts monitor |  |
| +5 Volts monitor |  |
| _ROLL_ROT | 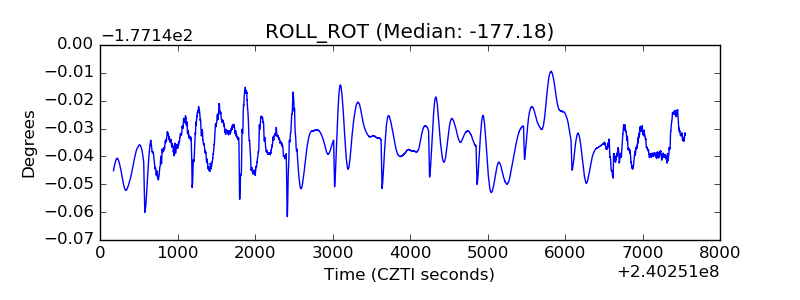 |
| _Roll_DEC | 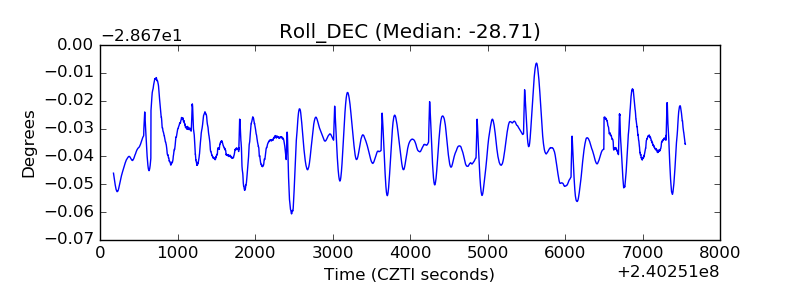 |
| _Roll_RA |  |
| Veto Counter | 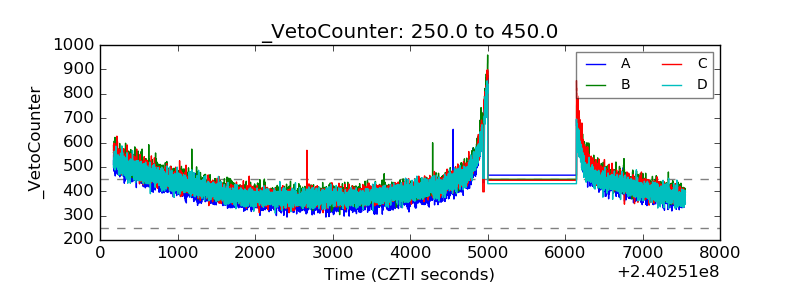 |