| Param | Original file | Final file |
|---|---|---|
| Filename | modeM0/AS1A03_116T01_9000001460_10134cztM0_level2.evt | modeM0/AS1A03_116T01_9000001460_10134cztM0_level2_quad_clean.evt |
| Size (bytes) | 469,693,440 | 93,078,720 |
| Size | 447.9 MB | 88.8 MB |
| Events in quadrant A | 3,137,369 | 598,158 |
| Events in quadrant B | 3,528,793 | 603,838 |
| Events in quadrant C | 3,013,536 | 592,807 |
| Events in quadrant D | 4,091,911 | 559,195 |
| Mode M9 | |||
|---|---|---|---|
| Quadrant | BADHDUFLAG | Total packets | Discarded packets |
| A | 0 | 14 | 0 |
| B | 0 | 14 | 0 |
| C | 0 | 14 | 0 |
| D | 0 | 15 | 0 |
| Mode SS | |||
|---|---|---|---|
| Quadrant | BADHDUFLAG | Total packets | Discarded packets |
| A | 0 | 136 | 0 |
| B | 0 | 136 | 0 |
| C | 0 | 136 | 0 |
| D | 0 | 136 | 0 |
| Mode M0 | |||
|---|---|---|---|
| Quadrant | BADHDUFLAG | Total packets | Discarded packets |
| A | 0 | 13897 | 3 |
| B | 0 | 14763 | 2 |
| C | 0 | 13705 | 2 |
| D | 0 | 16449 | 2 |
| Quadrant | Total seconds | Saturated seconds | Saturation percentage |
|---|---|---|---|
| A | 6666 | 38 | 0.570057% |
| B | 6666 | 48 | 0.720072% |
| C | 6666 | 19 | 0.285029% |
| D | 6666 | 125 | 1.875188% |
Noise dominated data is calculated using 1-second bins in cleaned event files. If a bin has >2000 counts, and if more than 50% of those come from <1% of pixels, then it is considered to be noise-dominated and hence unusable.
| Quadrant | # 1 sec bins | Bins with >0 counts | Bins with >2000 counts | High rate bins dominated by noise | Noise dominated (total time) | Noise dominated (detector-on time) | Marked lightcurve |
|---|---|---|---|---|---|---|---|
| A | 7566 | 6667 | 1 | 1 | 0.01% | 0.01% | 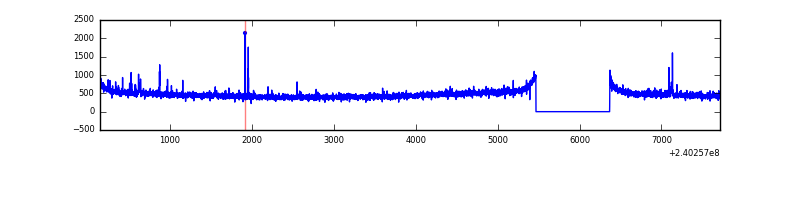 |
| B | 7566 | 6667 | 10 | 10 | 0.13% | 0.15% | 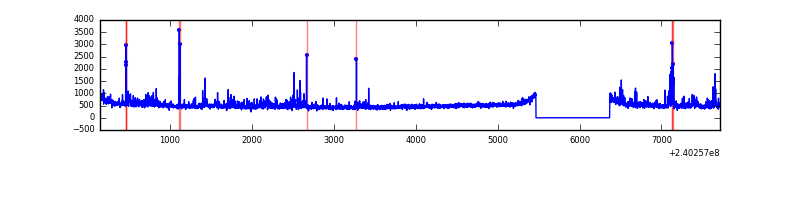 |
| C | 7566 | 6667 | 0 | 0 | 0.00% | 0.00% | 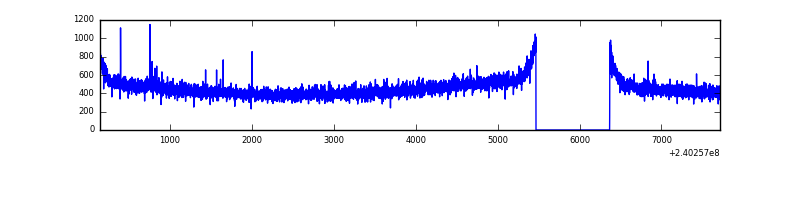 |
| D | 7566 | 6667 | 97 | 97 | 1.28% | 1.45% | 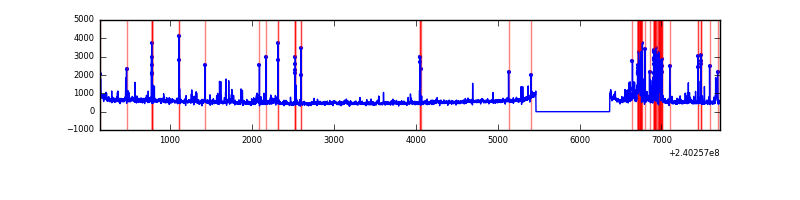 |
Top three noisy pixels from each quadrant. If the there are fewer than three noisy pixels in the level2.evt file, extra rows are filled as -1
| Pixel properties | Quadrant properties | ||||||
|---|---|---|---|---|---|---|---|
| Quadrant | DetID | PixID | Counts | Sigma | Mean | Median | Sigma |
| A | 8 | 15 | 17662 | 102.45 | 803 | 785 | 164.7 |
| A | 15 | 174 | 14620 | 83.98 | 803 | 785 | 164.7 |
| A | 13 | 251 | 9946 | 55.61 | 803 | 785 | 164.7 |
| B | 4 | 81 | 153187 | 984.08 | 806 | 787 | 154.9 |
| B | 0 | 189 | 54421 | 346.32 | 806 | 787 | 154.9 |
| B | 4 | 239 | 52013 | 330.78 | 806 | 787 | 154.9 |
| C | 14 | 67 | 6304 | 31.08 | 769 | 775 | 177.9 |
| C | 13 | 61 | 5837 | 28.45 | 769 | 775 | 177.9 |
| C | 14 | 234 | 5354 | 25.74 | 769 | 775 | 177.9 |
| D | 8 | 195 | 458024 | 2444.81 | 763 | 741 | 187.0 |
| D | 2 | 136 | 275843 | 1470.8 | 763 | 741 | 187.0 |
| D | 2 | 152 | 147363 | 783.9 | 763 | 741 | 187.0 |
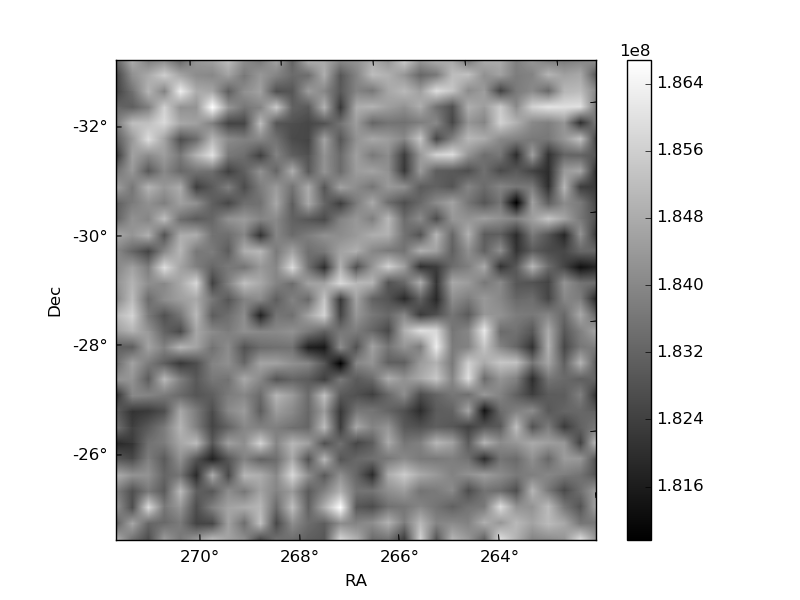
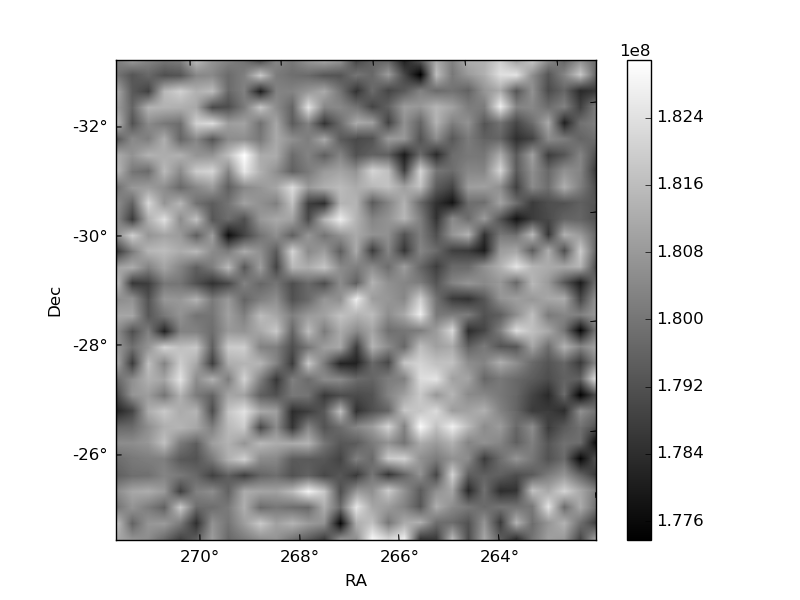
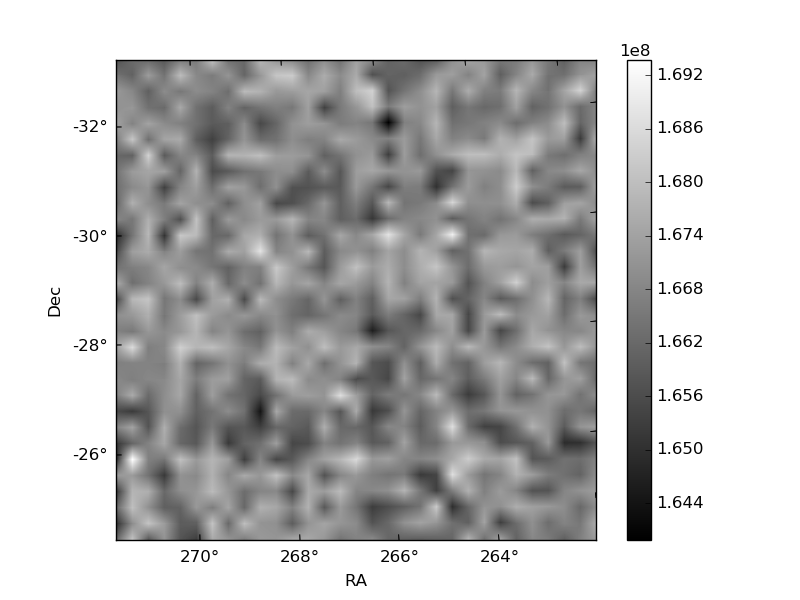
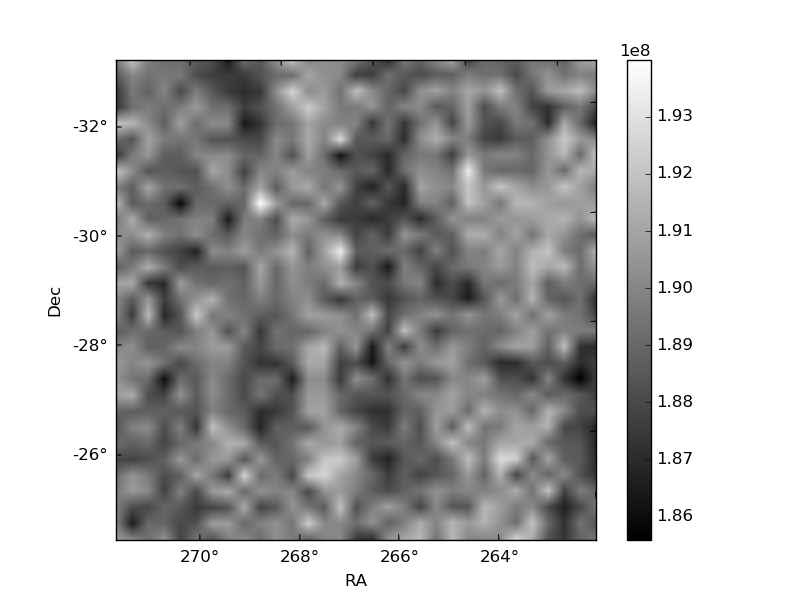
Histogram calculated using DETX and DETY for each event in the final _common_clean file
| Quadrant A | 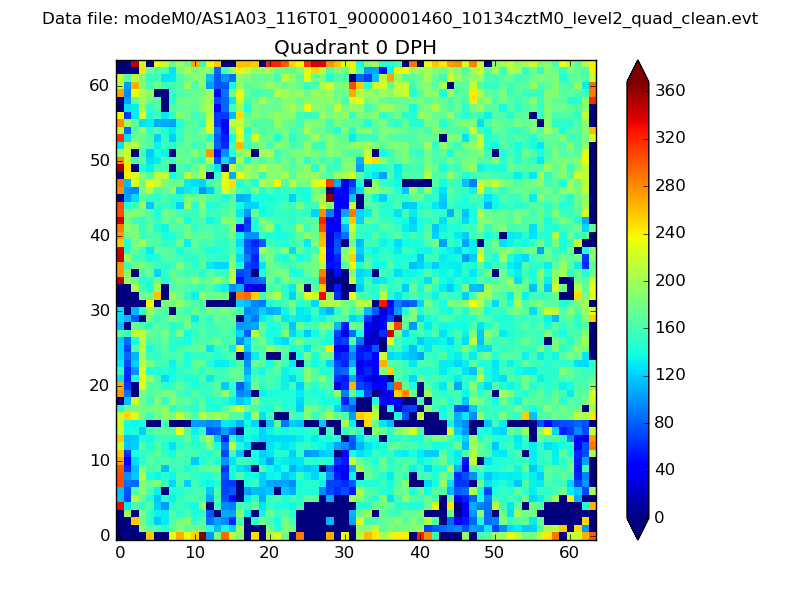 |
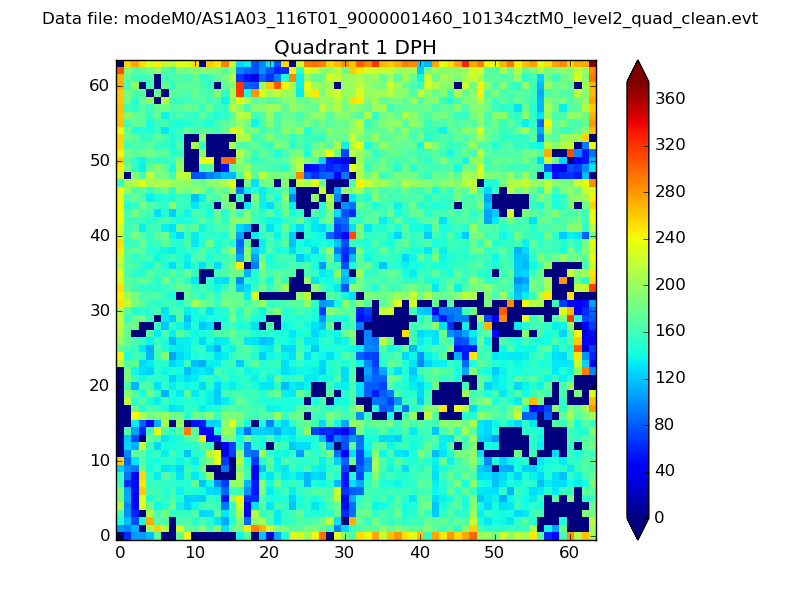 |
Quadrant B |
|---|---|---|---|
| Quadrant D | 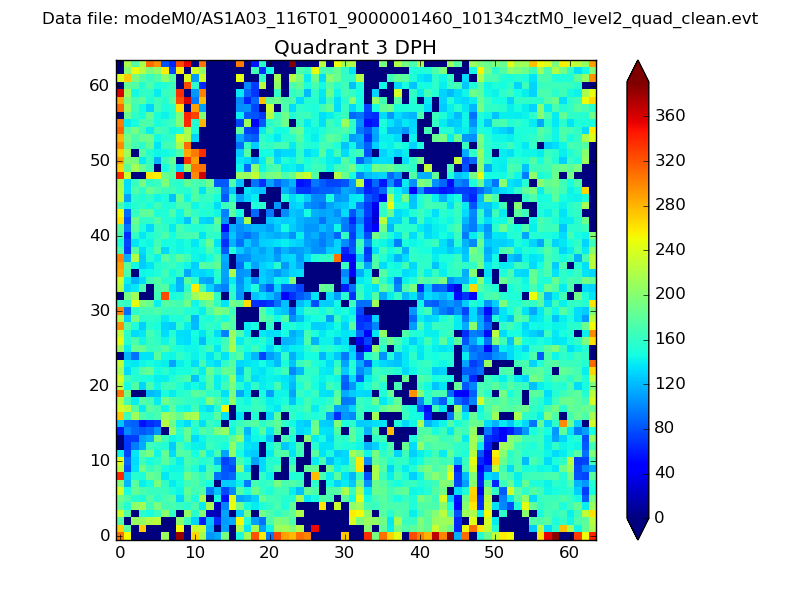 |
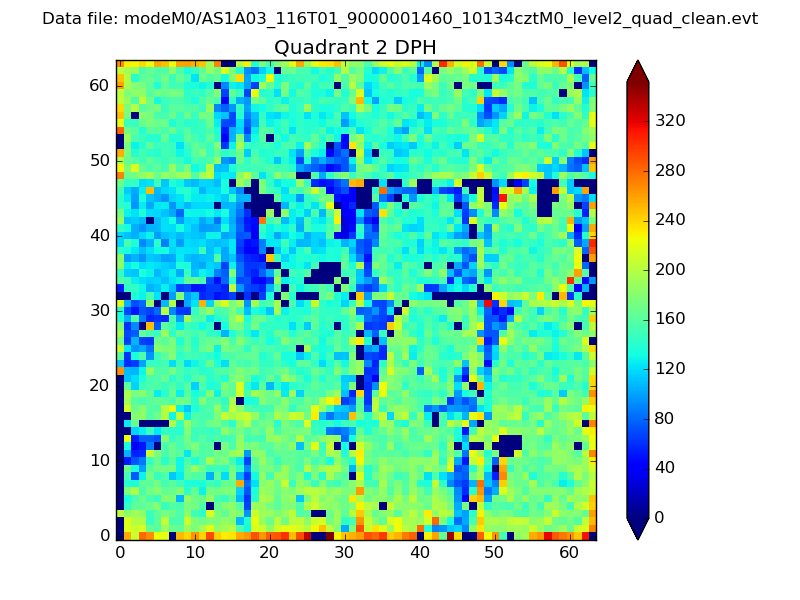 |
Quadrant C |
| Plot type | Count rate plots | Images |
|---|---|---|
| Comparison with Poisson distribution Blue bars denote a histogram of data divided into 1 sec bins. Red curve is a Poisson curve with rate = median count rate of data. |
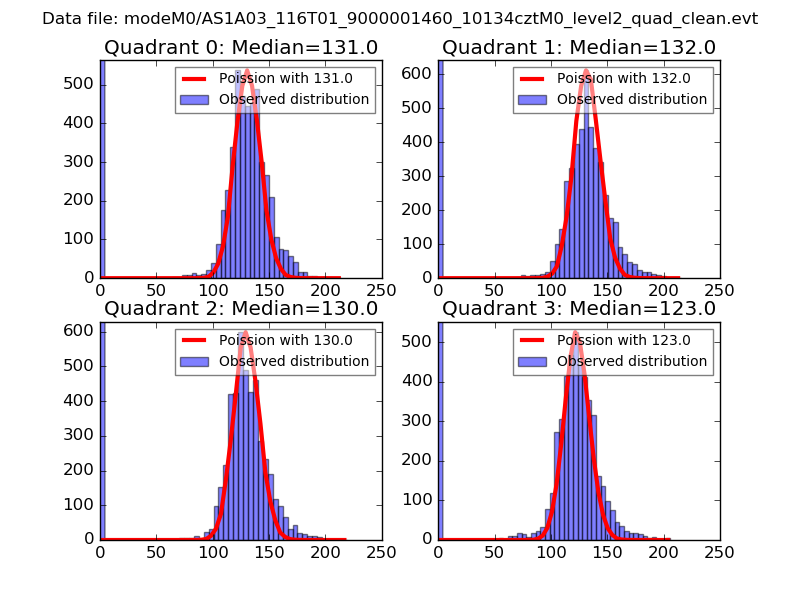 |
 |
| Quadrant-wise count rates Data is divided into 100 sec bins |
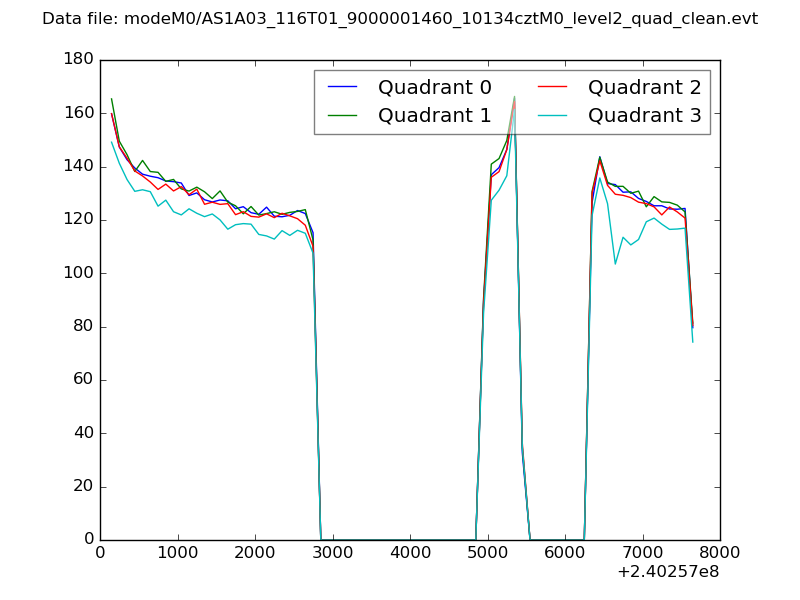 |
|
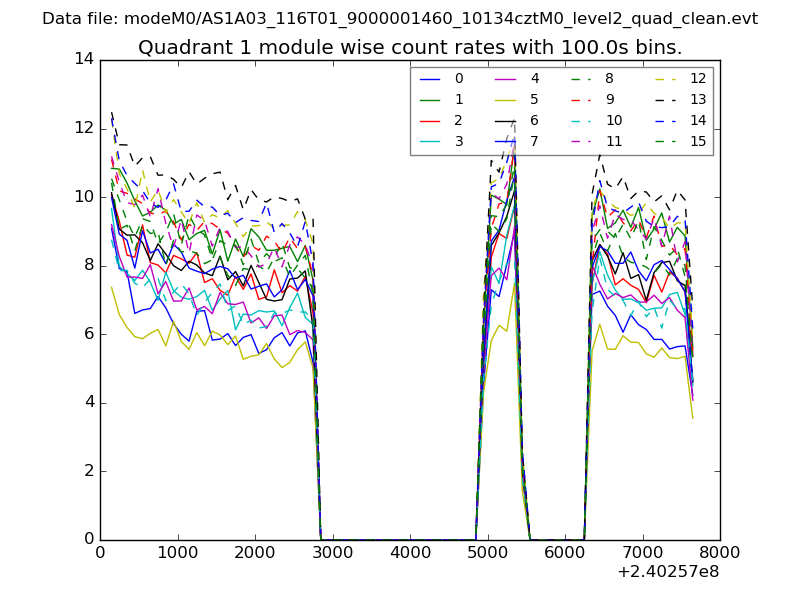
| Module-wise count rates for Quadrant A Data is divided into 100 sec bins |
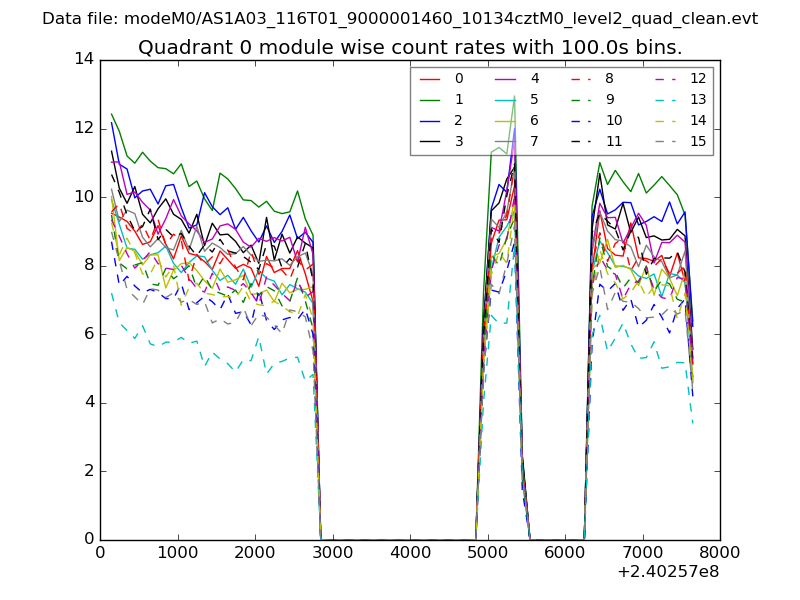 |
 |
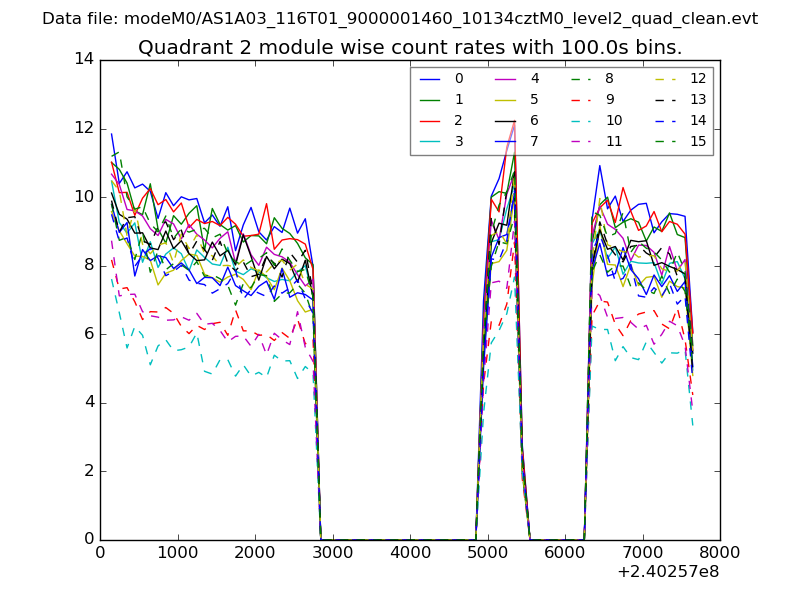
| Module-wise count rates for Quadrant B Data is divided into 100 sec bins |
 |
 |
| Module-wise count rates for Quadrant C Data is divided into 100 sec bins |
 |
 |
| Module-wise count rates for Quadrant D Data is divided into 100 sec bins |
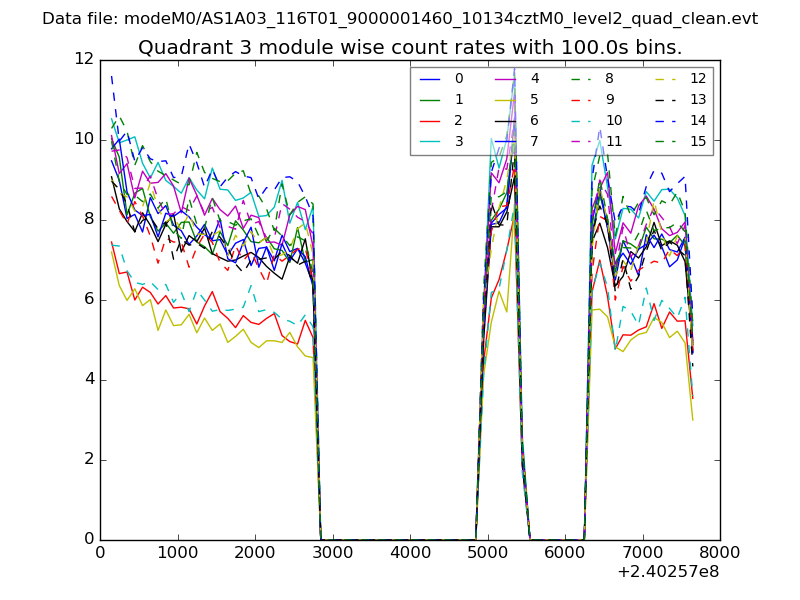 |
 |
| Parameter | Plot |
|---|---|
| CZT HV Monitor | 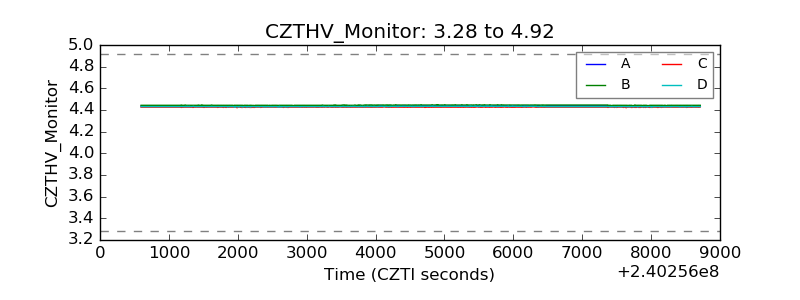 |
| D_VDD |  |
| Temperature 1 | 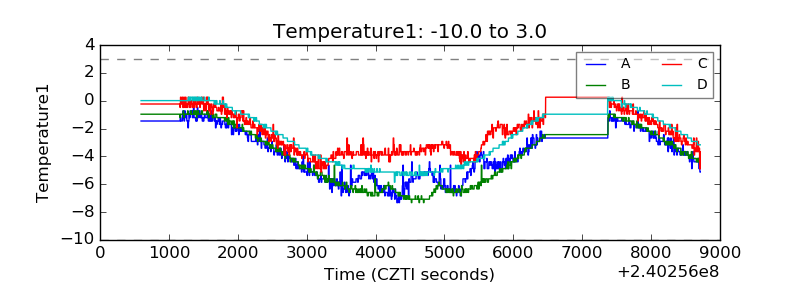 |
| Veto HV Monitor | 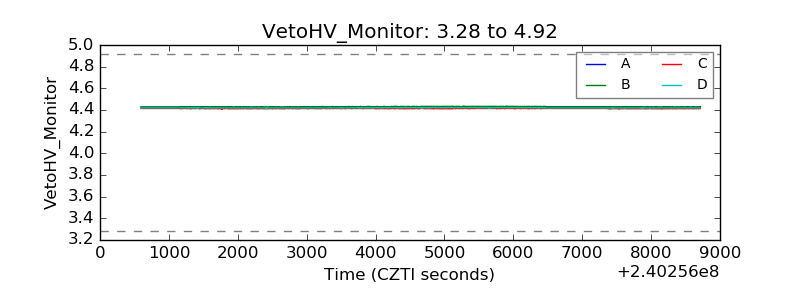 |
| Veto LLD | 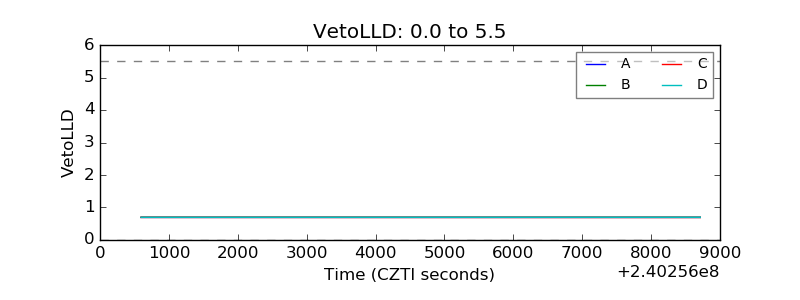 |
| Alpha Counter | 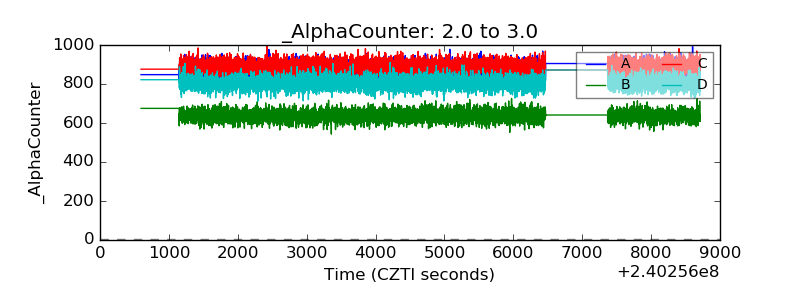 |
| _CPM_Rate | 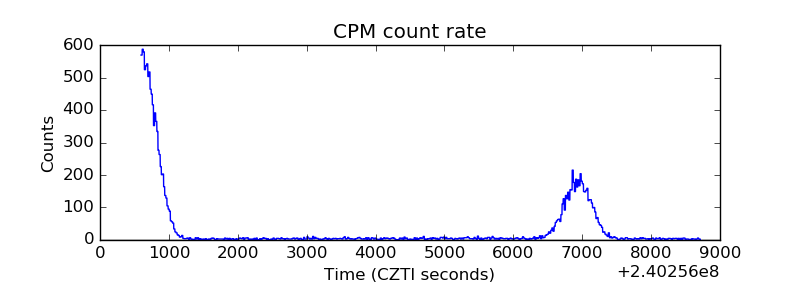 |
| CZT Counter | 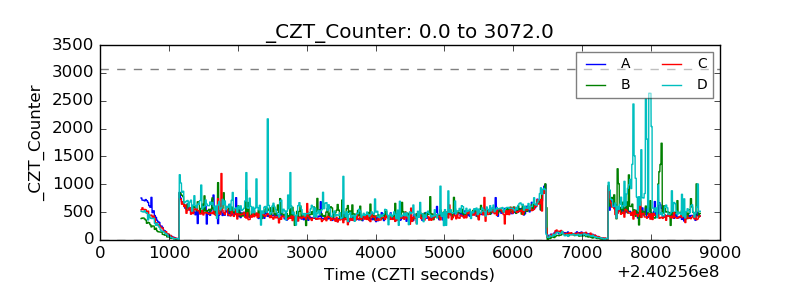 |
| +2.5 Volts monitor |  |
| +5 Volts monitor |  |
| _ROLL_ROT | 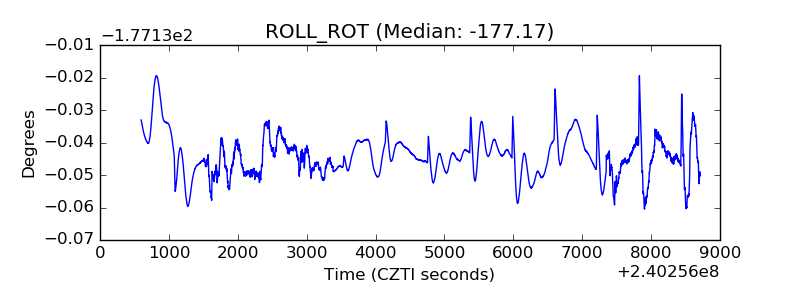 |
| _Roll_DEC | 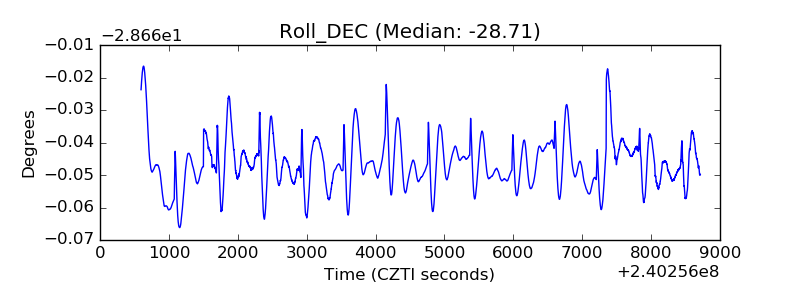 |
| _Roll_RA |  |
| Veto Counter | 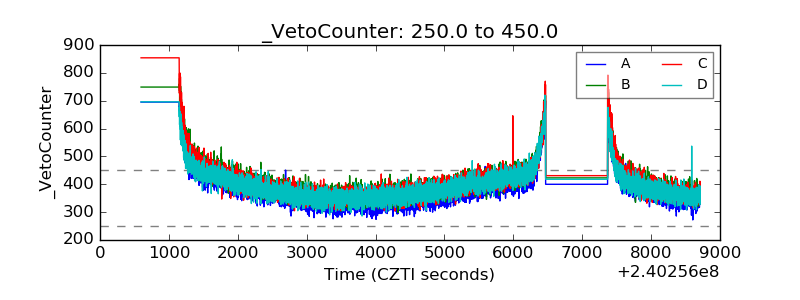 |