| Param | Original file | Final file |
|---|---|---|
| Filename | modeM0/AS1A03_116T01_9000001460_10136cztM0_level2.evt | modeM0/AS1A03_116T01_9000001460_10136cztM0_level2_quad_clean.evt |
| Size (bytes) | 566,196,480 | 117,907,200 |
| Size | 540.0 MB | 112.4 MB |
| Events in quadrant A | 3,952,919 | 758,240 |
| Events in quadrant B | 4,246,373 | 771,475 |
| Events in quadrant C | 3,671,918 | 759,864 |
| Events in quadrant D | 4,727,060 | 719,100 |
| Mode M9 | |||
|---|---|---|---|
| Quadrant | BADHDUFLAG | Total packets | Discarded packets |
| A | 0 | 8 | 0 |
| B | 0 | 8 | 0 |
| C | 0 | 8 | 0 |
| D | 0 | 8 | 0 |
| Mode SS | |||
|---|---|---|---|
| Quadrant | BADHDUFLAG | Total packets | Discarded packets |
| A | 0 | 166 | 0 |
| B | 0 | 166 | 0 |
| C | 0 | 166 | 0 |
| D | 0 | 166 | 0 |
| Mode M0 | |||
|---|---|---|---|
| Quadrant | BADHDUFLAG | Total packets | Discarded packets |
| A | 0 | 17329 | 3 |
| B | 0 | 18079 | 2 |
| C | 0 | 16649 | 2 |
| D | 0 | 19338 | 2 |
| Quadrant | Total seconds | Saturated seconds | Saturation percentage |
|---|---|---|---|
| A | 8089 | 133 | 1.644208% |
| B | 8089 | 111 | 1.372234% |
| C | 8089 | 24 | 0.296699% |
| D | 8089 | 85 | 1.050810% |
Noise dominated data is calculated using 1-second bins in cleaned event files. If a bin has >2000 counts, and if more than 50% of those come from <1% of pixels, then it is considered to be noise-dominated and hence unusable.
| Quadrant | # 1 sec bins | Bins with >0 counts | Bins with >2000 counts | High rate bins dominated by noise | Noise dominated (total time) | Noise dominated (detector-on time) | Marked lightcurve |
|---|---|---|---|---|---|---|---|
| A | 8854 | 8091 | 63 | 63 | 0.71% | 0.78% | 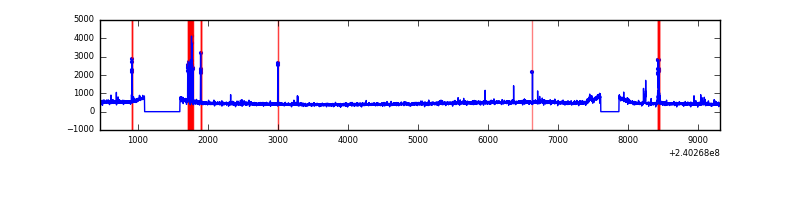 |
| B | 8854 | 8091 | 12 | 12 | 0.14% | 0.15% |  |
| C | 8854 | 8091 | 0 | 0 | 0.00% | 0.00% | 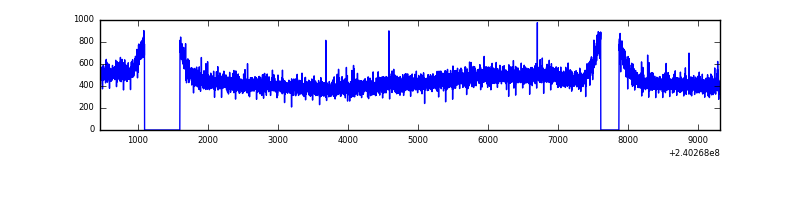 |
| D | 8854 | 8091 | 44 | 44 | 0.50% | 0.54% | 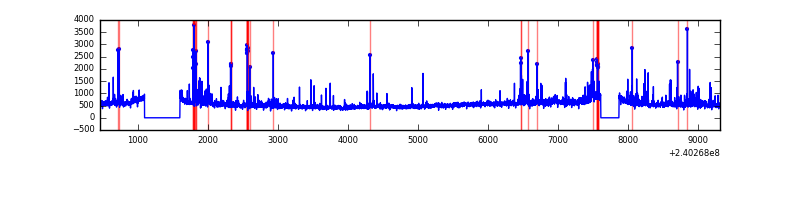 |
Top three noisy pixels from each quadrant. If the there are fewer than three noisy pixels in the level2.evt file, extra rows are filled as -1
| Pixel properties | Quadrant properties | ||||||
|---|---|---|---|---|---|---|---|
| Quadrant | DetID | PixID | Counts | Sigma | Mean | Median | Sigma |
| A | 15 | 174 | 218152 | 1094.94 | 965 | 945 | 198.4 |
| A | 0 | 226 | 8840 | 39.8 | 965 | 945 | 198.4 |
| A | 12 | 194 | 8195 | 36.55 | 965 | 945 | 198.4 |
| B | 0 | 214 | 98467 | 523.09 | 972 | 950 | 186.4 |
| B | 4 | 81 | 93622 | 497.1 | 972 | 950 | 186.4 |
| B | 4 | 239 | 89839 | 476.81 | 972 | 950 | 186.4 |
| C | 8 | 222 | 8101 | 32.86 | 935 | 939 | 218.0 |
| C | 14 | 67 | 7793 | 31.45 | 935 | 939 | 218.0 |
| C | 13 | 61 | 7257 | 28.99 | 935 | 939 | 218.0 |
| D | 8 | 195 | 620552 | 2742.48 | 928 | 896 | 225.9 |
| D | 2 | 152 | 181615 | 799.83 | 928 | 896 | 225.9 |
| D | 7 | 71 | 163207 | 718.36 | 928 | 896 | 225.9 |
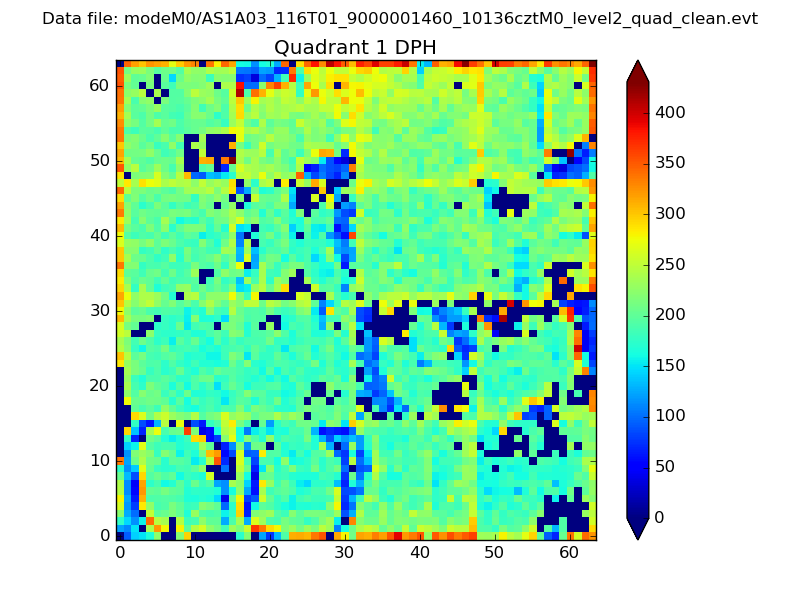
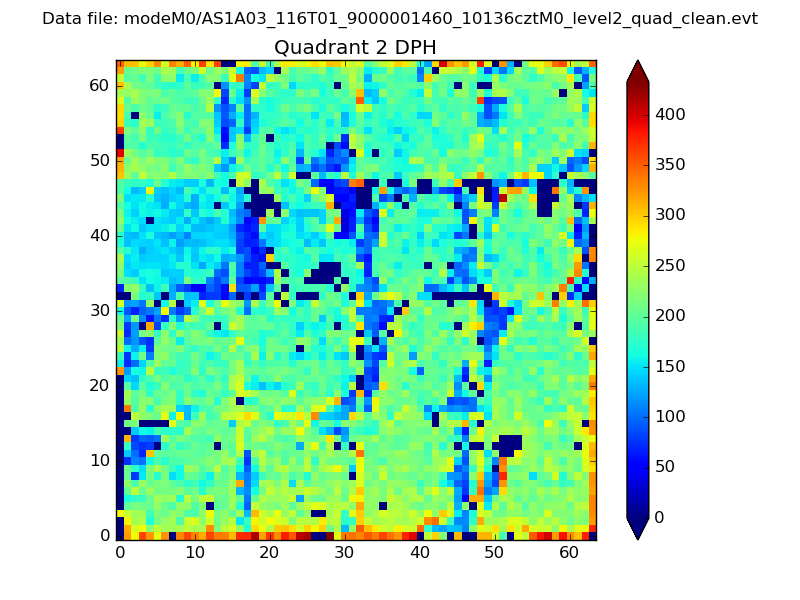
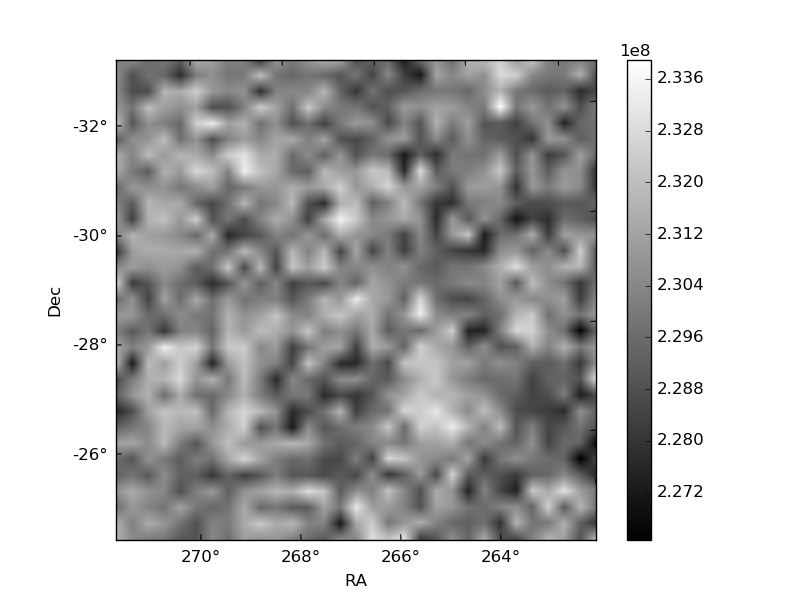
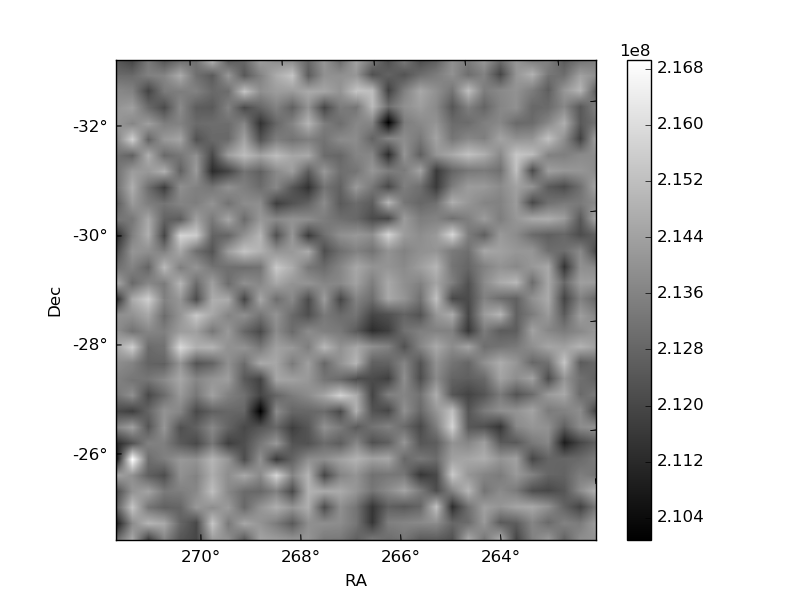
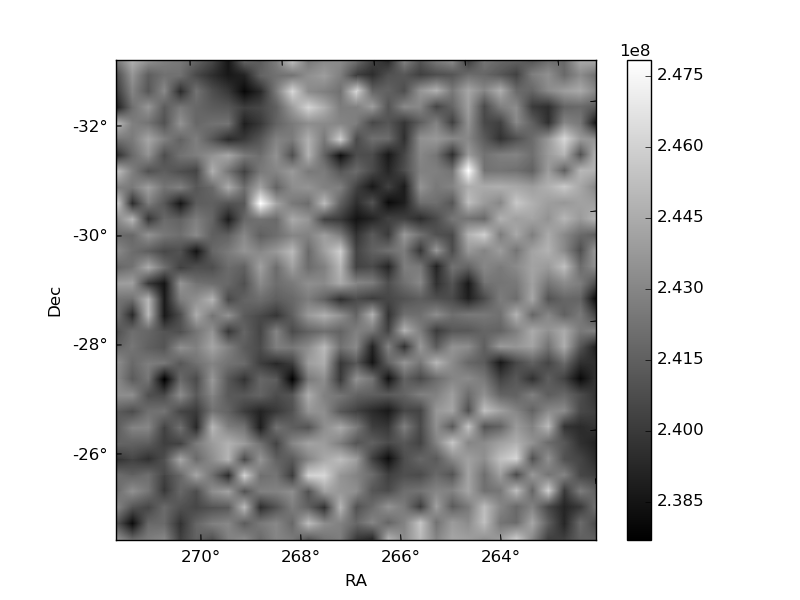
Histogram calculated using DETX and DETY for each event in the final _common_clean file
| Quadrant A | 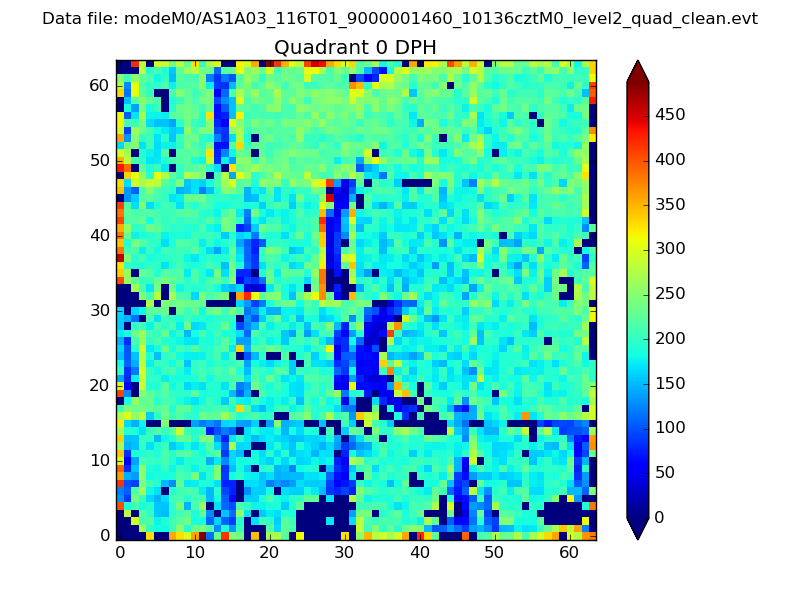 |
 |
Quadrant B |
|---|---|---|---|
| Quadrant D | 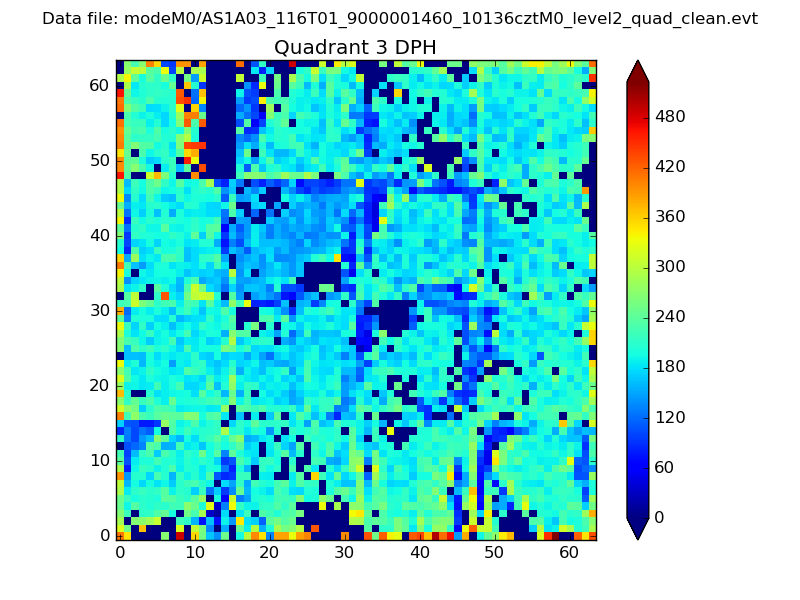 |
 |
Quadrant C |
| Plot type | Count rate plots | Images |
|---|---|---|
| Comparison with Poisson distribution Blue bars denote a histogram of data divided into 1 sec bins. Red curve is a Poisson curve with rate = median count rate of data. |
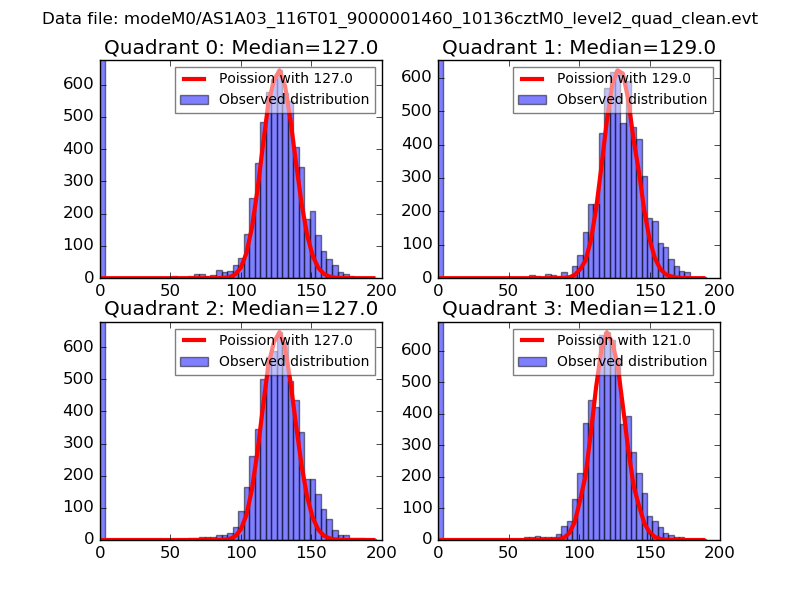 |
 |
| Quadrant-wise count rates Data is divided into 100 sec bins |
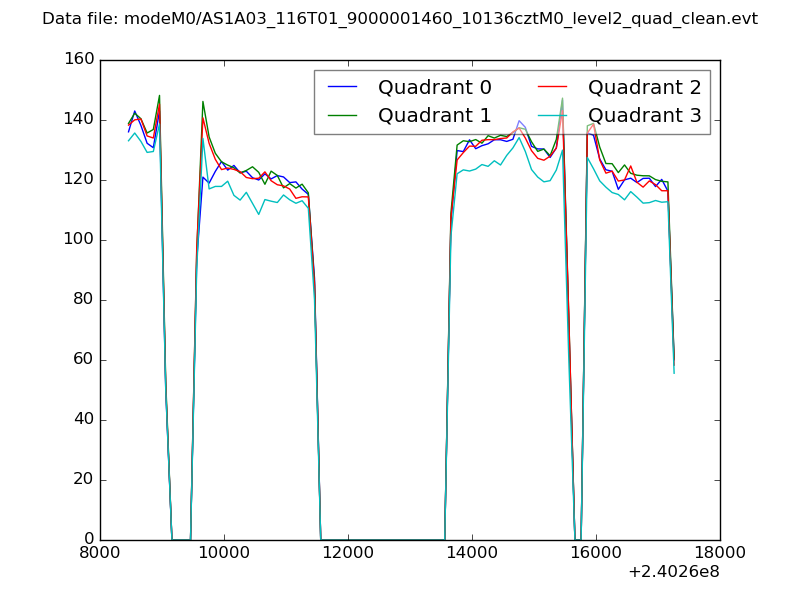 |
|
| Module-wise count rates for Quadrant A Data is divided into 100 sec bins |
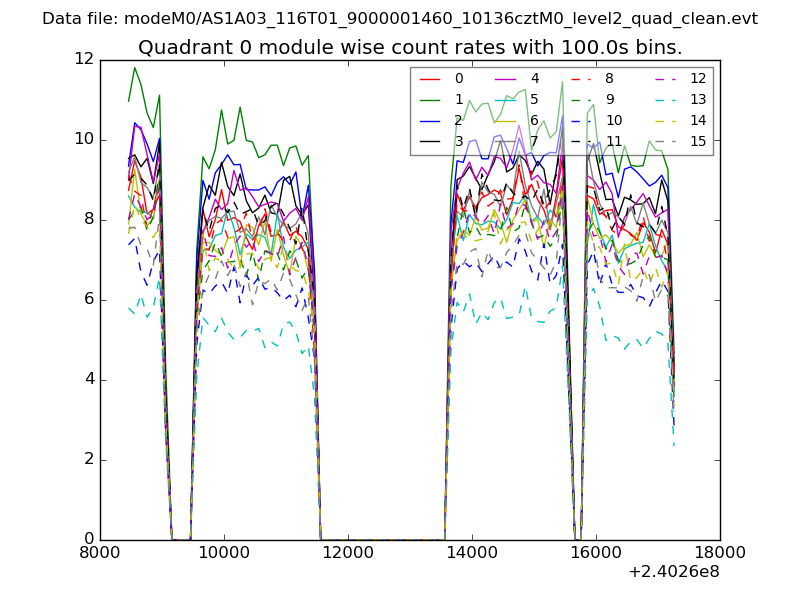 |
 |
| Module-wise count rates for Quadrant B Data is divided into 100 sec bins |
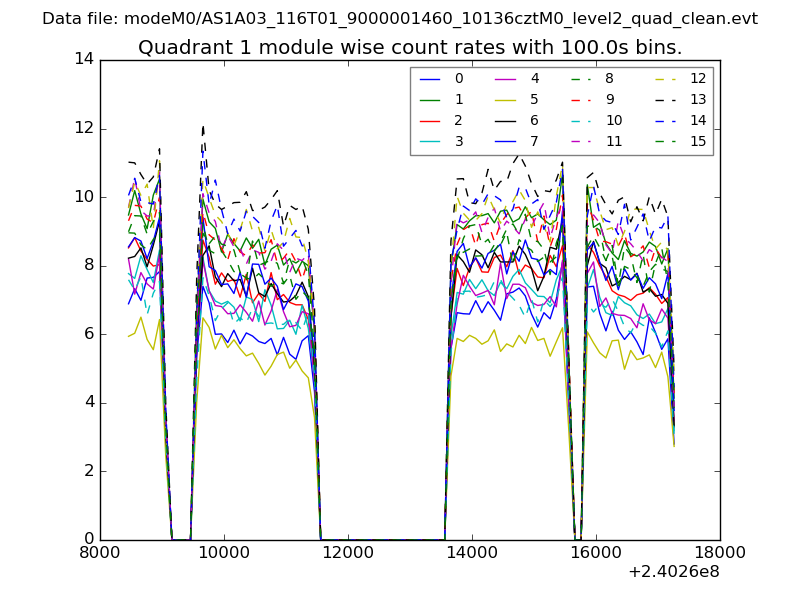 |
 |
| Module-wise count rates for Quadrant C Data is divided into 100 sec bins |
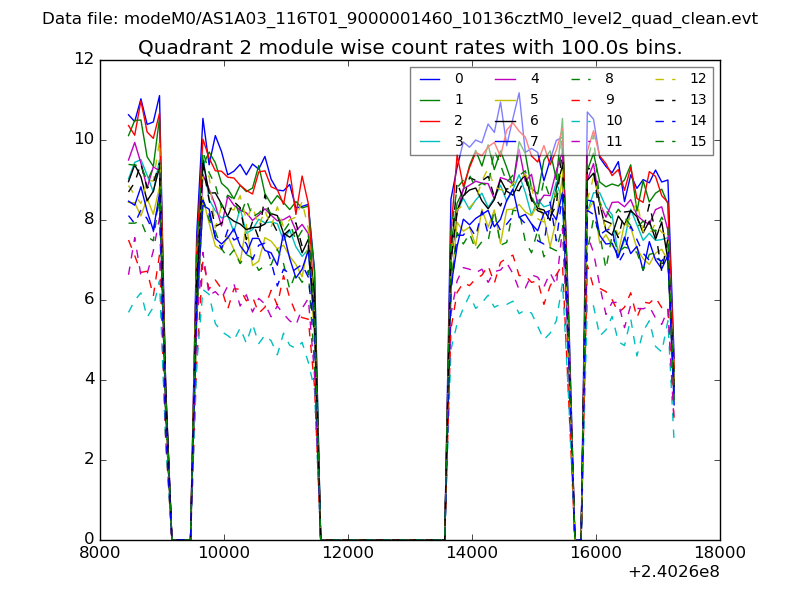 |
 |
| Module-wise count rates for Quadrant D Data is divided into 100 sec bins |
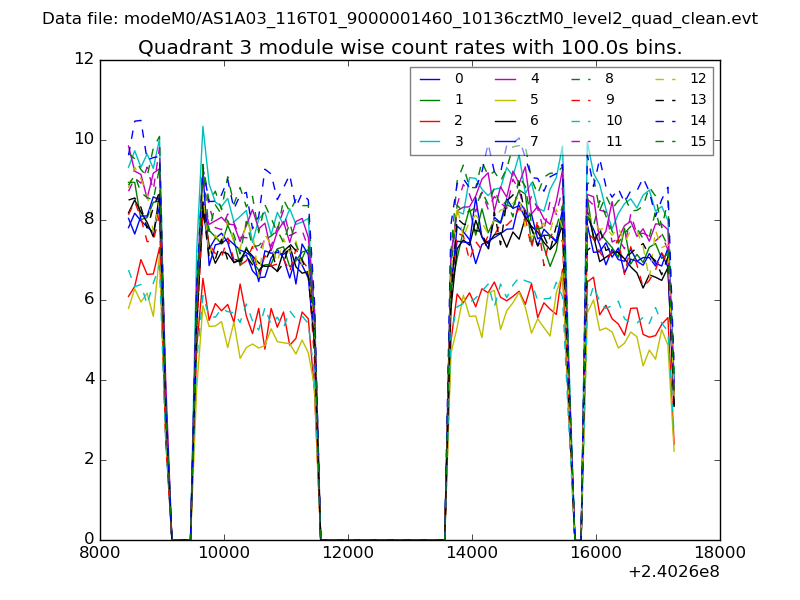 |
 |
| Parameter | Plot |
|---|---|
| CZT HV Monitor | 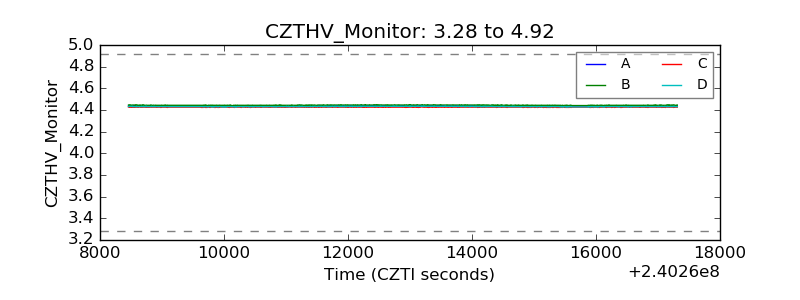 |
| D_VDD | 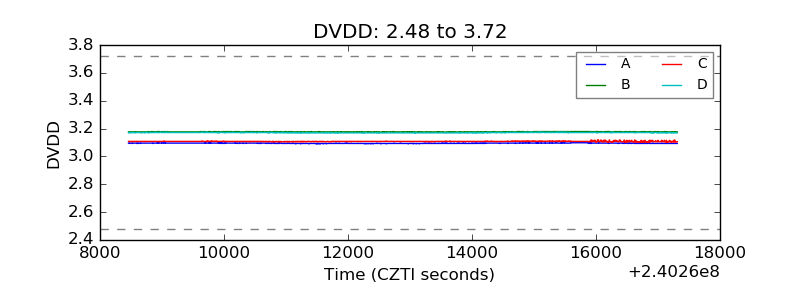 |
| Temperature 1 | 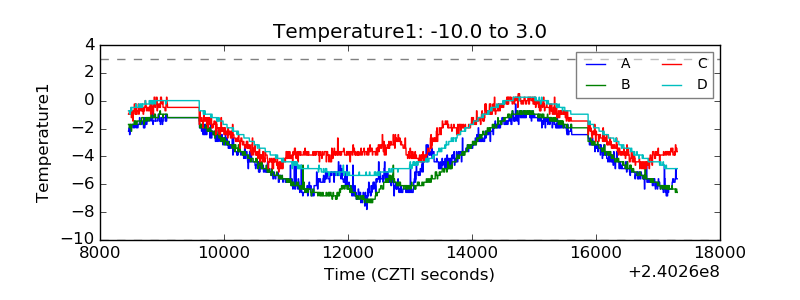 |
| Veto HV Monitor | 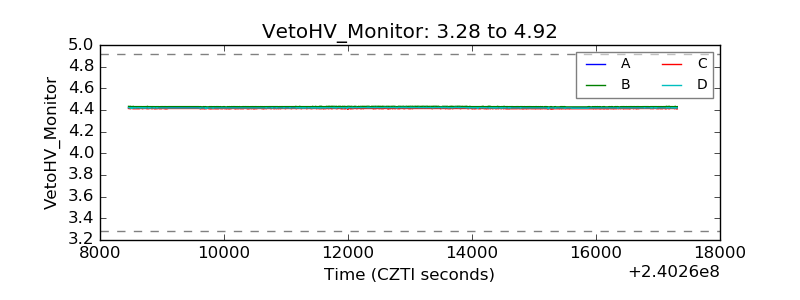 |
| Veto LLD | 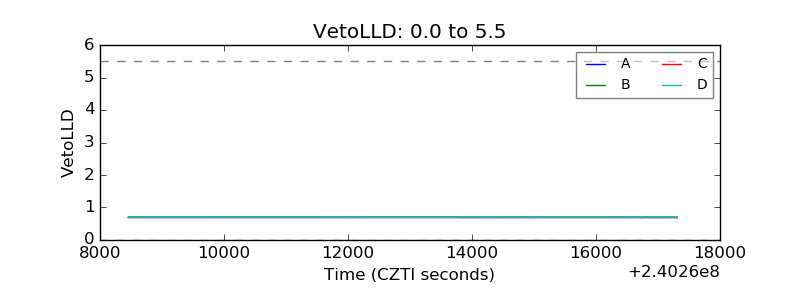 |
| Alpha Counter | 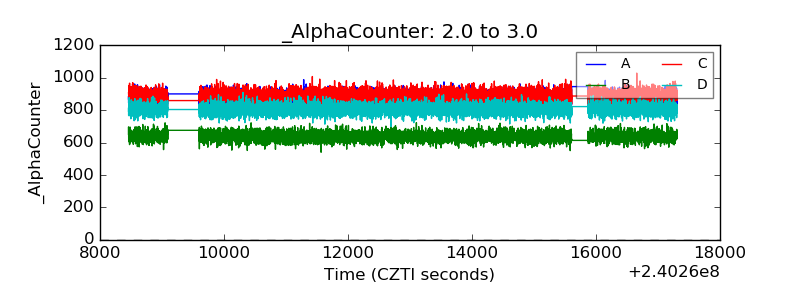 |
| _CPM_Rate | 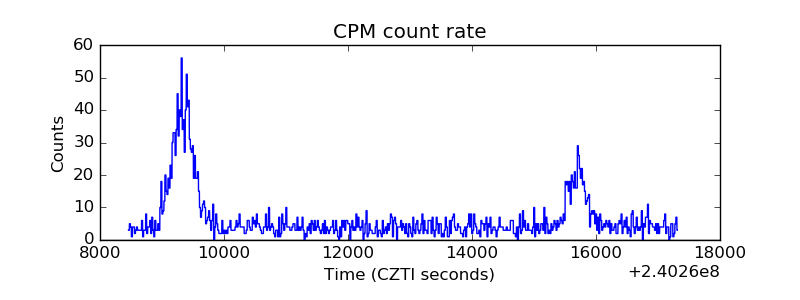 |
| CZT Counter | 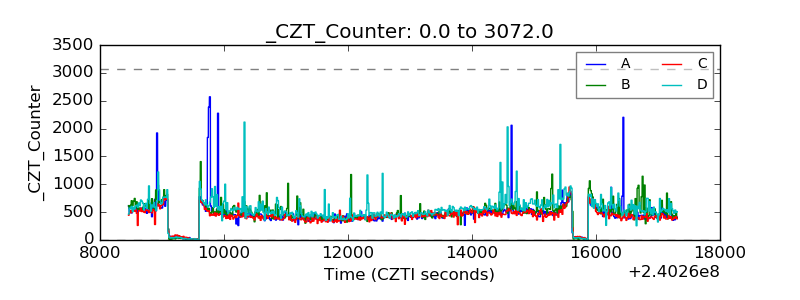 |
| +2.5 Volts monitor |  |
| +5 Volts monitor |  |
| _ROLL_ROT | 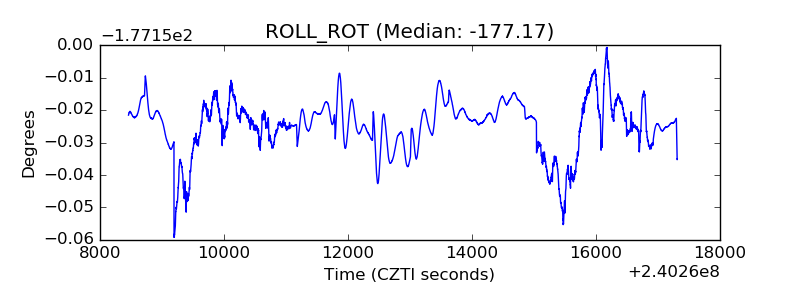 |
| _Roll_DEC | 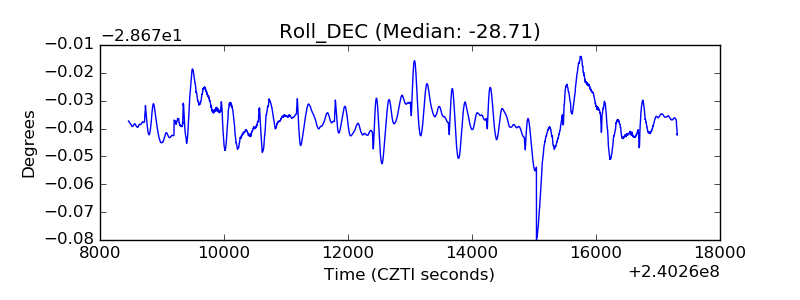 |
| _Roll_RA |  |
| Veto Counter | 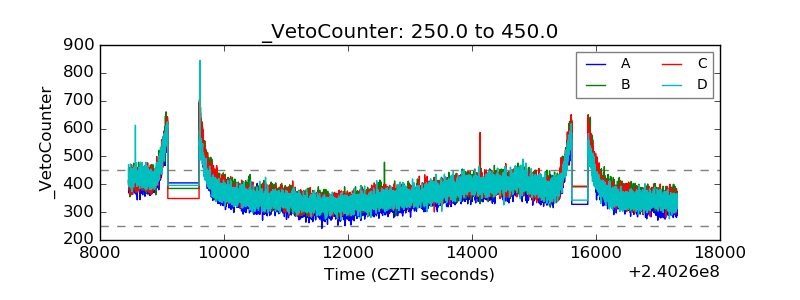 |