| Param | Original file | Final file |
|---|---|---|
| Filename | modeM0/AS1A03_116T01_9000001460_10141cztM0_level2.evt | modeM0/AS1A03_116T01_9000001460_10141cztM0_level2_quad_clean.evt |
| Size (bytes) | 592,151,040 | 81,843,840 |
| Size | 564.7 MB | 78.1 MB |
| Events in quadrant A | 3,394,148 | 507,102 |
| Events in quadrant B | 3,568,404 | 513,626 |
| Events in quadrant C | 3,308,968 | 510,246 |
| Events in quadrant D | 7,174,279 | 446,339 |
| Mode M9 | |||
|---|---|---|---|
| Quadrant | BADHDUFLAG | Total packets | Discarded packets |
| A | 0 | 19 | 0 |
| B | 0 | 19 | 0 |
| C | 0 | 19 | 0 |
| D | 0 | 19 | 0 |
| Mode SS | |||
|---|---|---|---|
| Quadrant | BADHDUFLAG | Total packets | Discarded packets |
| A | 0 | 148 | 0 |
| B | 0 | 148 | 0 |
| C | 0 | 148 | 0 |
| D | 0 | 148 | 0 |
| Mode M0 | |||
|---|---|---|---|
| Quadrant | BADHDUFLAG | Total packets | Discarded packets |
| A | 0 | 14789 | 3 |
| B | 0 | 15078 | 2 |
| C | 0 | 14718 | 2 |
| D | 0 | 26188 | 2 |
| Quadrant | Total seconds | Saturated seconds | Saturation percentage |
|---|---|---|---|
| A | 7190 | 75 | 1.043115% |
| B | 7190 | 94 | 1.307371% |
| C | 7190 | 80 | 1.112656% |
| D | 7190 | 1132 | 15.744089% |
Noise dominated data is calculated using 1-second bins in cleaned event files. If a bin has >2000 counts, and if more than 50% of those come from <1% of pixels, then it is considered to be noise-dominated and hence unusable.
| Quadrant | # 1 sec bins | Bins with >0 counts | Bins with >2000 counts | High rate bins dominated by noise | Noise dominated (total time) | Noise dominated (detector-on time) | Marked lightcurve |
|---|---|---|---|---|---|---|---|
| A | 9025 | 7190 | 0 | 0 | 0.00% | 0.00% | 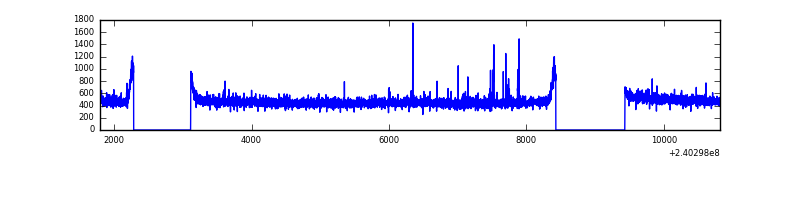 |
| B | 9025 | 7190 | 4 | 4 | 0.04% | 0.06% | 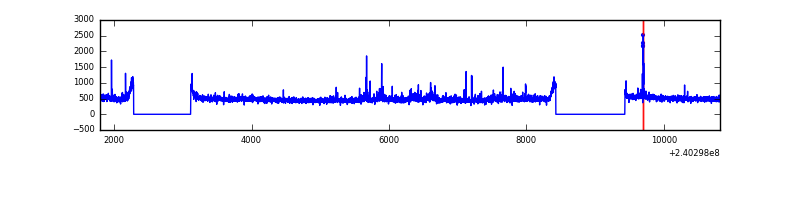 |
| C | 9025 | 7190 | 0 | 0 | 0.00% | 0.00% |  |
| D | 9024 | 7189 | 843 | 843 | 9.34% | 11.73% | 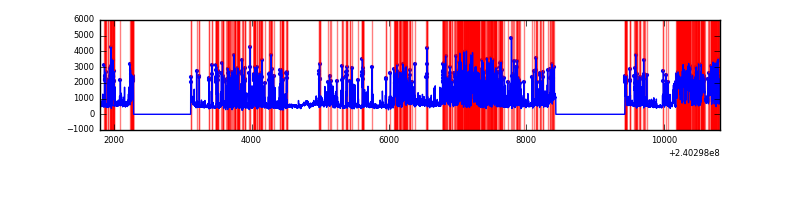 |
Top three noisy pixels from each quadrant. If the there are fewer than three noisy pixels in the level2.evt file, extra rows are filled as -1
| Pixel properties | Quadrant properties | ||||||
|---|---|---|---|---|---|---|---|
| Quadrant | DetID | PixID | Counts | Sigma | Mean | Median | Sigma |
| A | 15 | 174 | 23616 | 127.76 | 871 | 853 | 178.2 |
| A | 3 | 1 | 15592 | 82.72 | 871 | 853 | 178.2 |
| A | 0 | 226 | 7861 | 39.33 | 871 | 853 | 178.2 |
| B | 0 | 214 | 43695 | 255.17 | 874 | 853 | 167.9 |
| B | 4 | 239 | 43451 | 253.72 | 874 | 853 | 167.9 |
| B | 4 | 81 | 43077 | 251.49 | 874 | 853 | 167.9 |
| C | 13 | 61 | 6205 | 27.09 | 847 | 851 | 197.6 |
| C | 14 | 67 | 3615 | 13.99 | 847 | 851 | 197.6 |
| C | 14 | 225 | 2154 | 6.59 | 847 | 851 | 197.6 |
| D | 4 | 95 | 2374497 | 11719.86 | 785 | 767 | 202.5 |
| D | 1 | 52 | 847050 | 4178.37 | 785 | 767 | 202.5 |
| D | 8 | 195 | 384536 | 1894.79 | 785 | 767 | 202.5 |
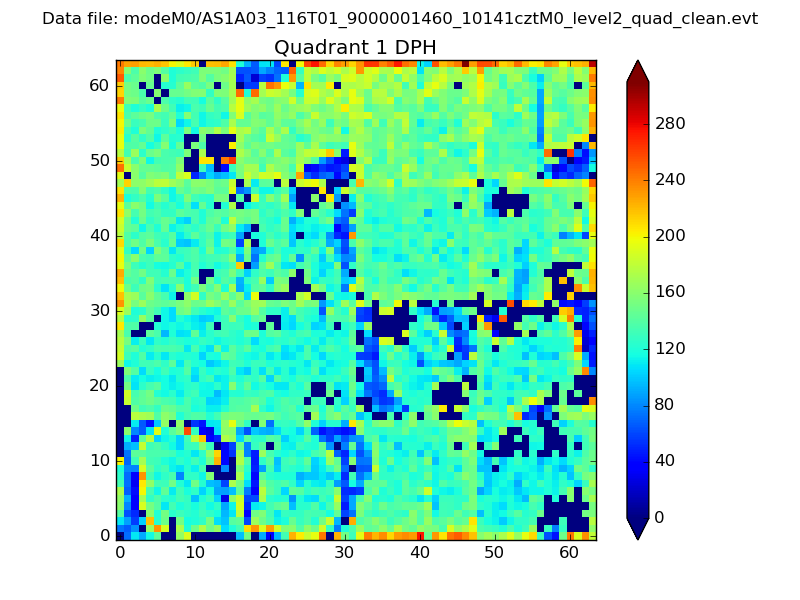
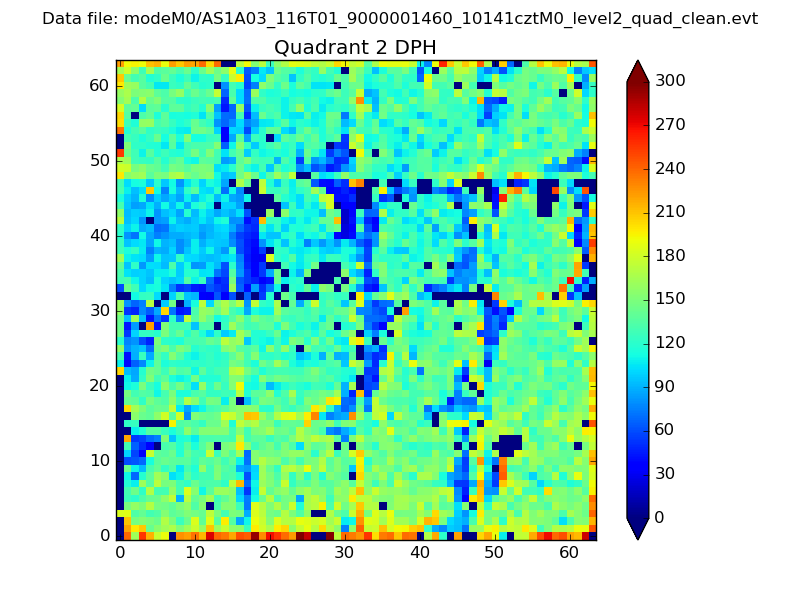
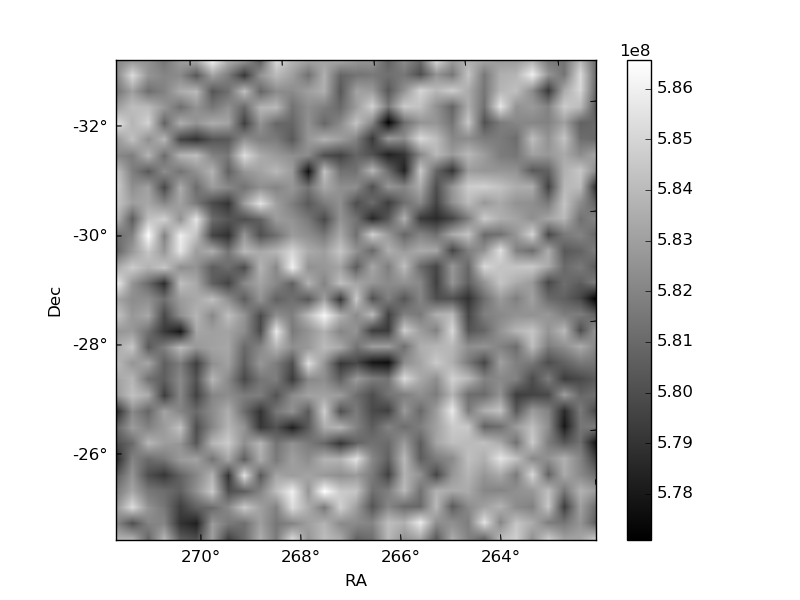
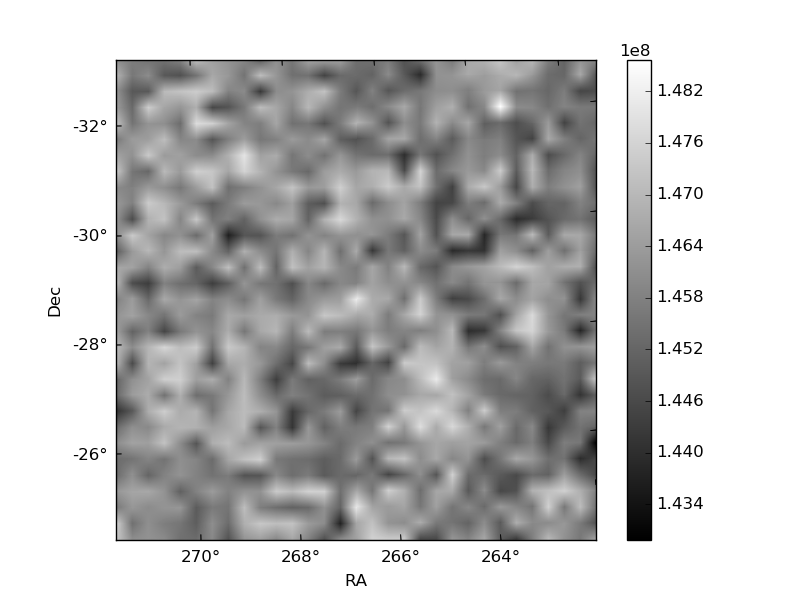
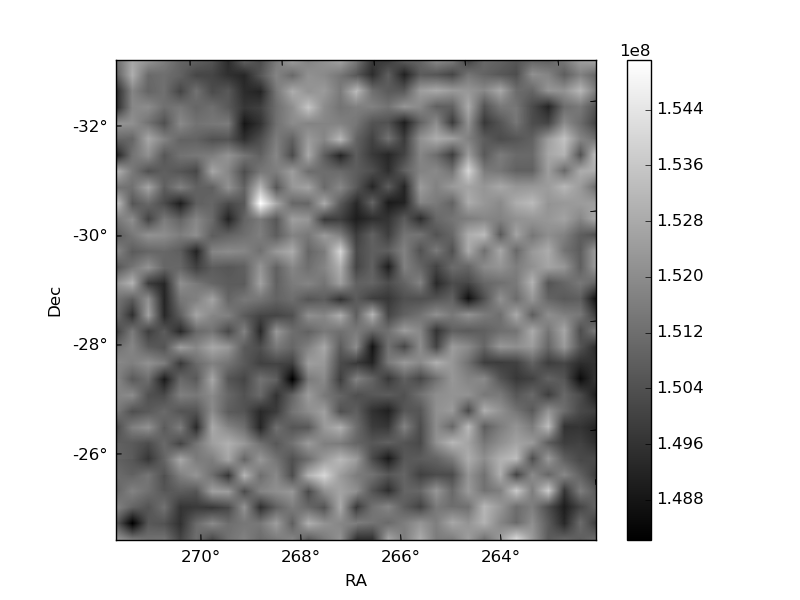
Histogram calculated using DETX and DETY for each event in the final _common_clean file
| Quadrant A | 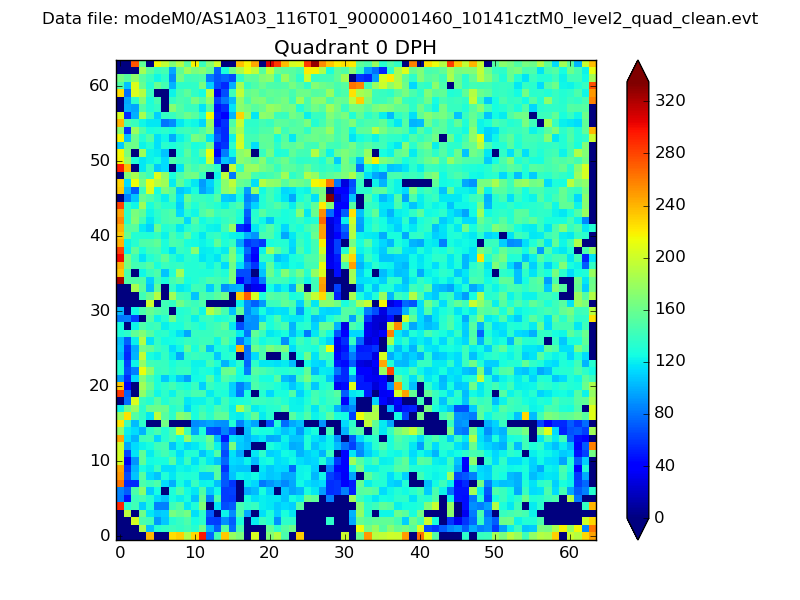 |
 |
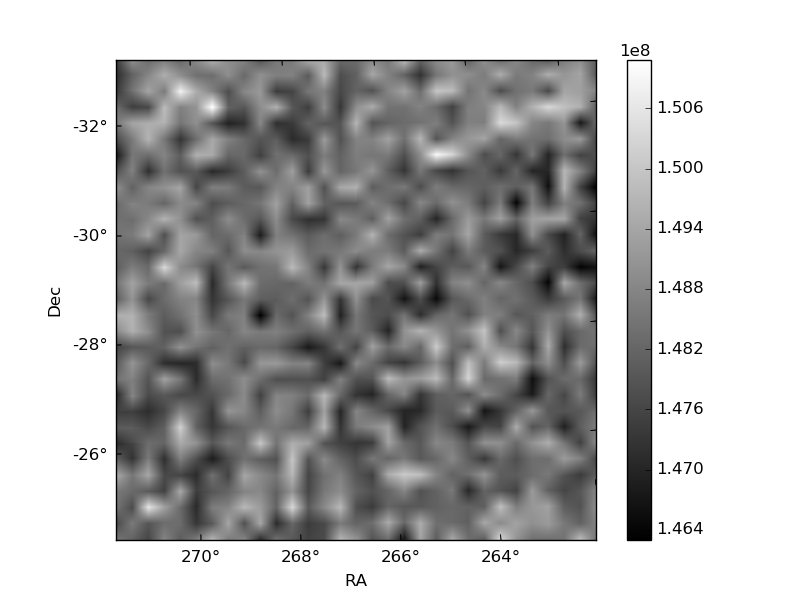
Quadrant B |
|---|---|---|---|
| Quadrant D | 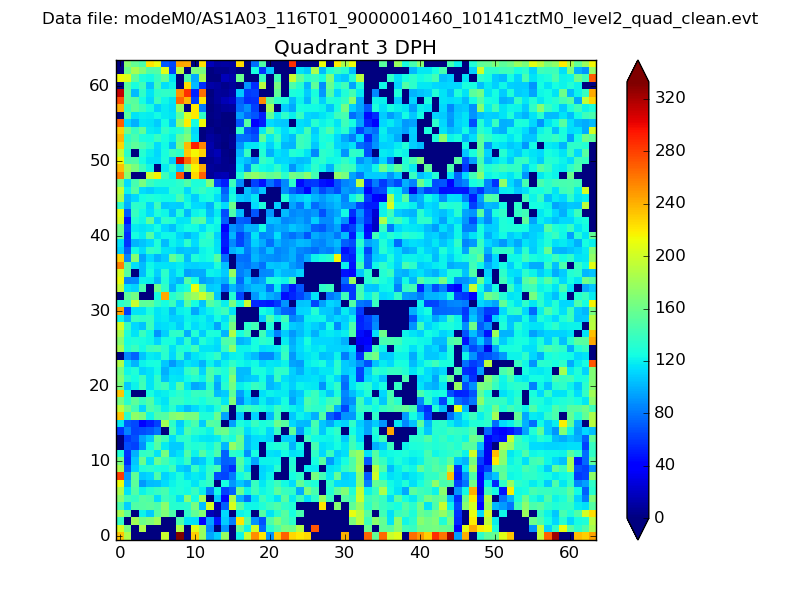 |
 |
Quadrant C |
| Plot type | Count rate plots | Images |
|---|---|---|
| Comparison with Poisson distribution Blue bars denote a histogram of data divided into 1 sec bins. Red curve is a Poisson curve with rate = median count rate of data. |
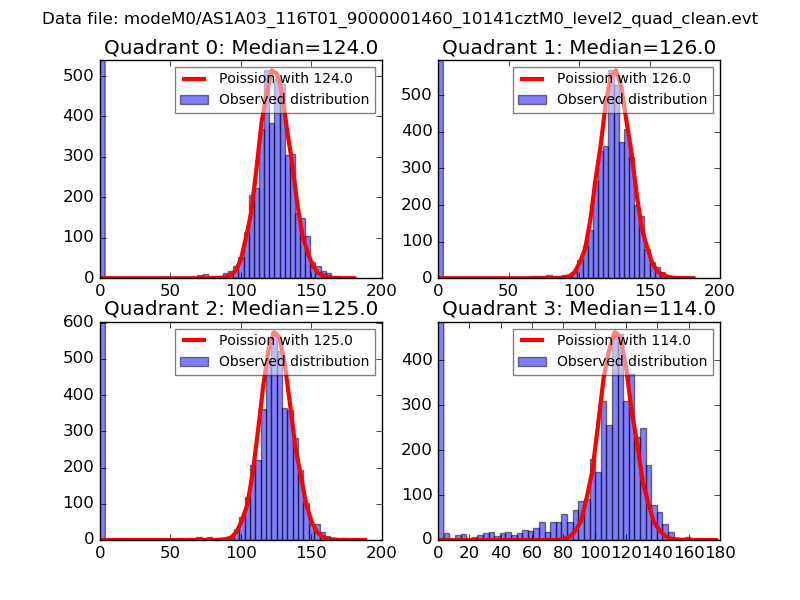 |
 |
| Quadrant-wise count rates Data is divided into 100 sec bins |
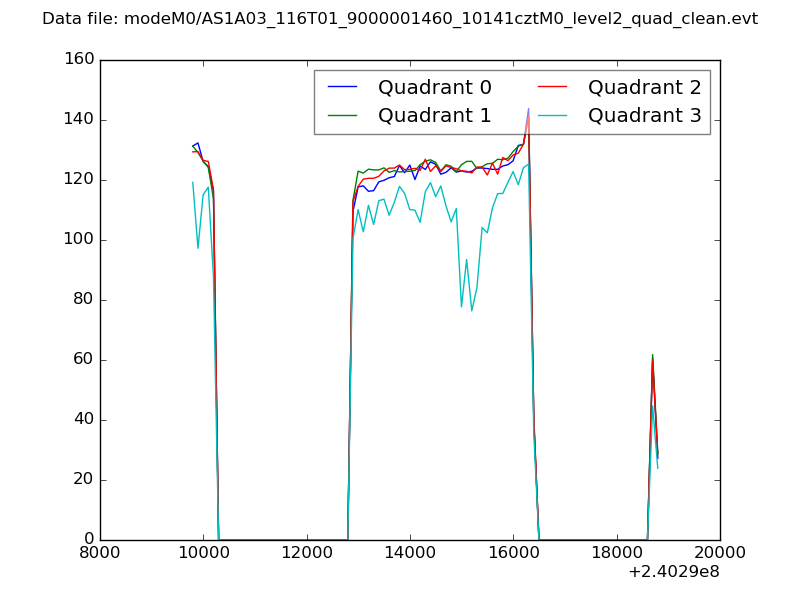 |
|
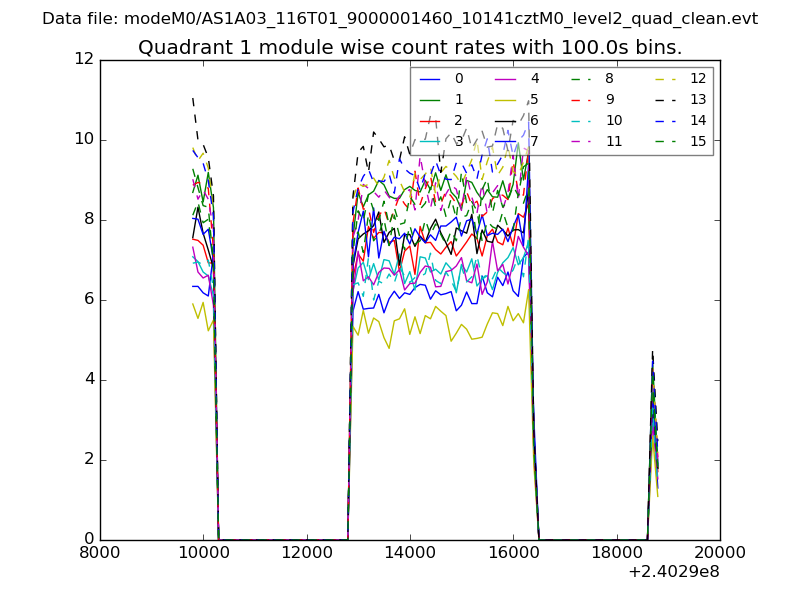
| Module-wise count rates for Quadrant A Data is divided into 100 sec bins |
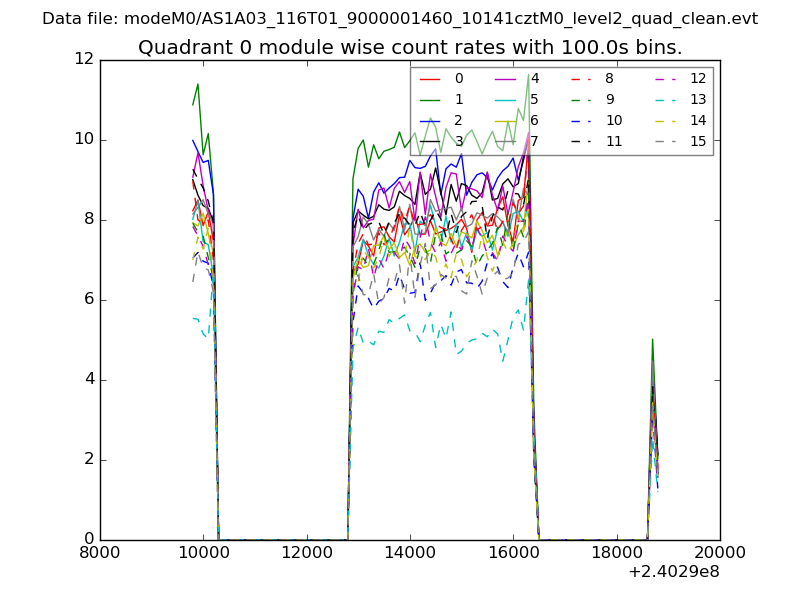 |
 |
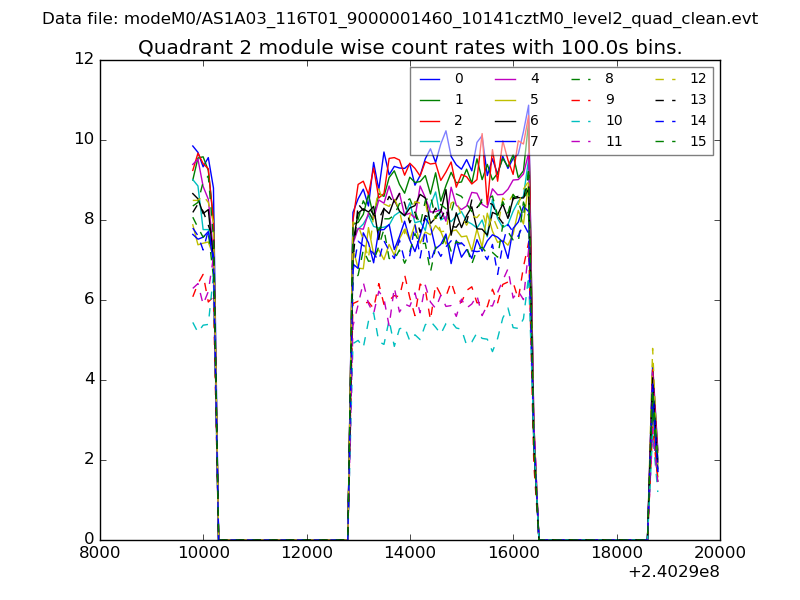
| Module-wise count rates for Quadrant B Data is divided into 100 sec bins |
 |
 |
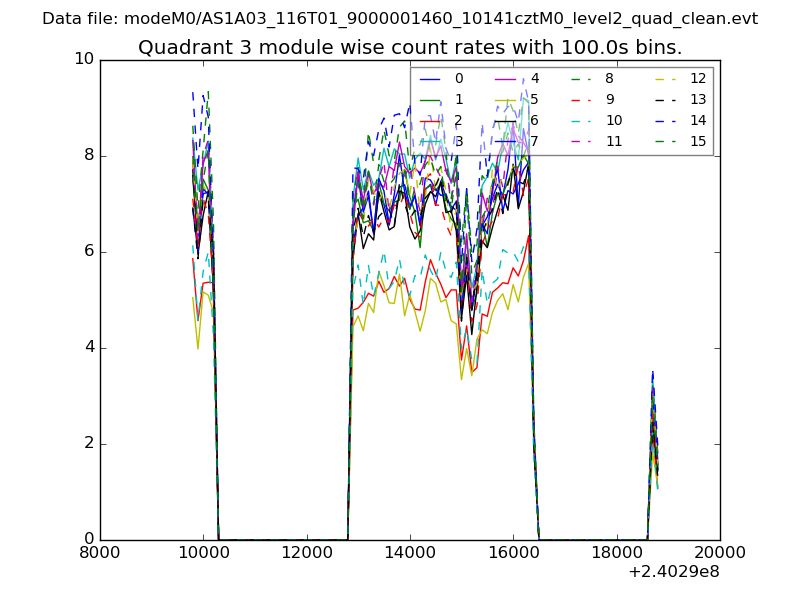
| Module-wise count rates for Quadrant C Data is divided into 100 sec bins |
 |
 |
| Module-wise count rates for Quadrant D Data is divided into 100 sec bins |
 |
 |
| Parameter | Plot |
|---|---|
| CZT HV Monitor | 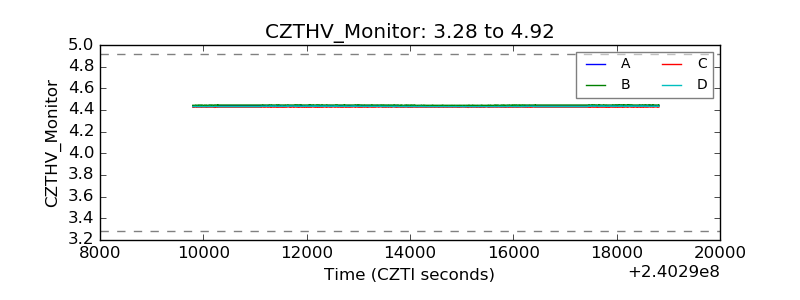 |
| D_VDD | 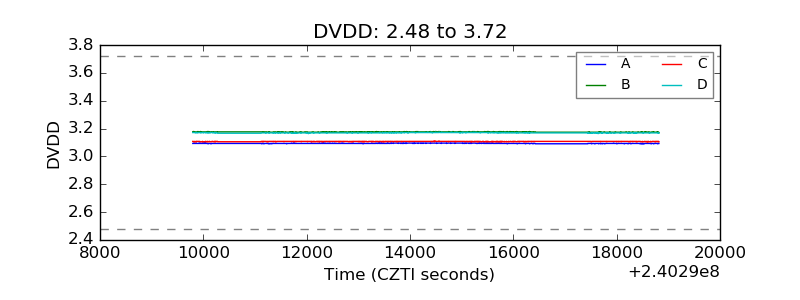 |
| Temperature 1 | 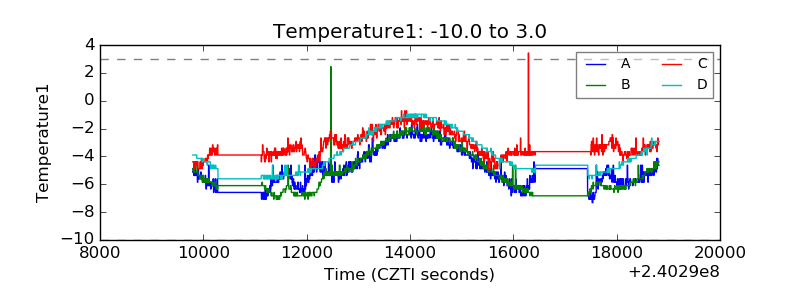 |
| Veto HV Monitor |  |
| Veto LLD | 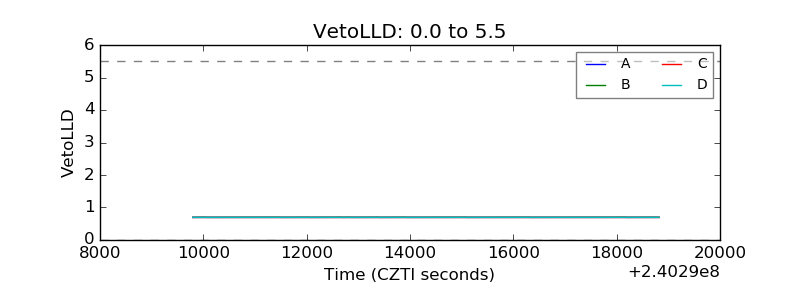 |
| Alpha Counter | 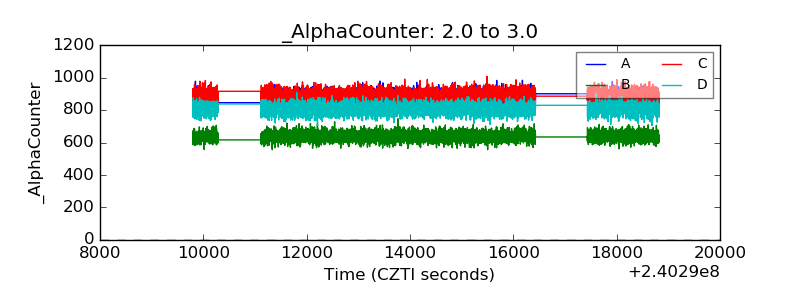 |
| _CPM_Rate | 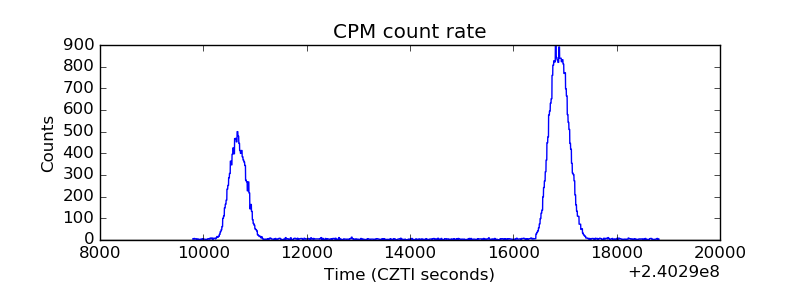 |
| CZT Counter | 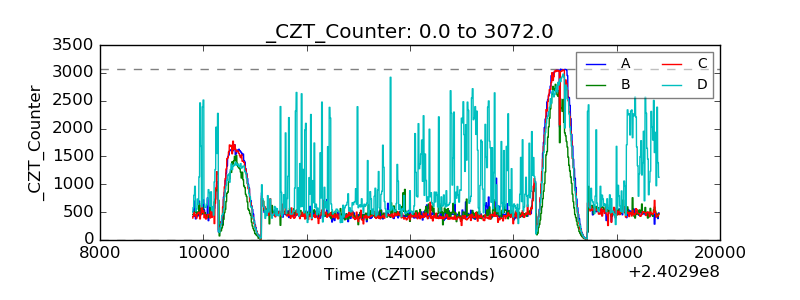 |
| +2.5 Volts monitor |  |
| +5 Volts monitor |  |
| _ROLL_ROT | 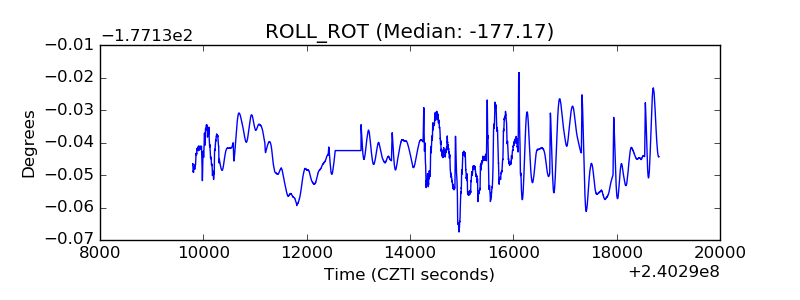 |
| _Roll_DEC | 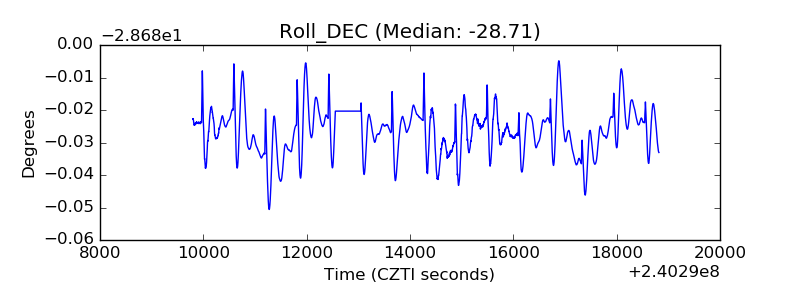 |
| _Roll_RA | 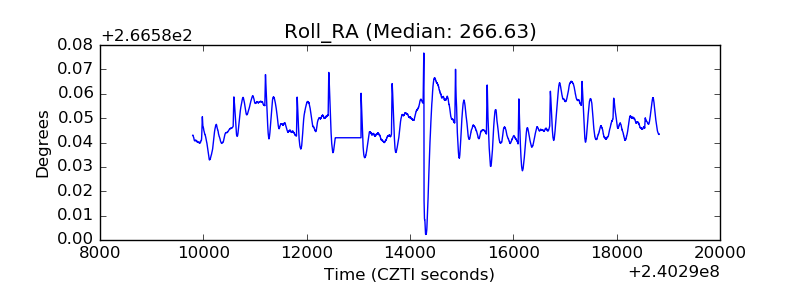 |
| Veto Counter | 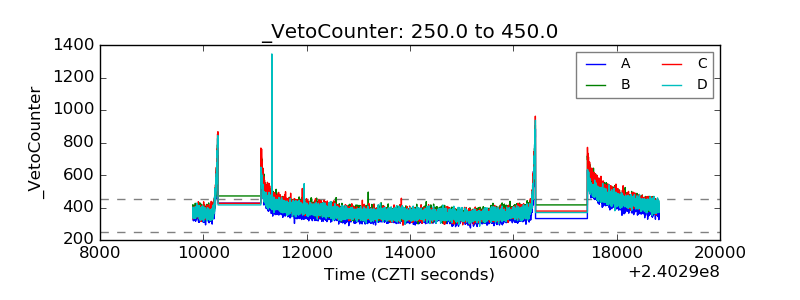 |