| Param | Original file | Final file |
|---|---|---|
| Filename | modeM0/AS1A03_116T01_9000001460_10143cztM0_level2.evt | modeM0/AS1A03_116T01_9000001460_10143cztM0_level2_quad_clean.evt |
| Size (bytes) | 624,795,840 | 85,757,760 |
| Size | 595.9 MB | 81.8 MB |
| Events in quadrant A | 3,240,035 | 556,437 |
| Events in quadrant B | 3,410,370 | 561,885 |
| Events in quadrant C | 3,160,970 | 556,075 |
| Events in quadrant D | 8,658,089 | 456,277 |
| Mode M9 | |||
|---|---|---|---|
| Quadrant | BADHDUFLAG | Total packets | Discarded packets |
| A | 0 | 21 | 0 |
| B | 0 | 21 | 0 |
| C | 0 | 21 | 0 |
| D | 0 | 21 | 0 |
| Mode SS | |||
|---|---|---|---|
| Quadrant | BADHDUFLAG | Total packets | Discarded packets |
| A | 0 | 138 | 0 |
| B | 0 | 138 | 0 |
| C | 0 | 138 | 0 |
| D | 0 | 138 | 0 |
| Mode M0 | |||
|---|---|---|---|
| Quadrant | BADHDUFLAG | Total packets | Discarded packets |
| A | 0 | 13871 | 3 |
| B | 0 | 14276 | 2 |
| C | 0 | 13804 | 2 |
| D | 0 | 30221 | 2 |
| Quadrant | Total seconds | Saturated seconds | Saturation percentage |
|---|---|---|---|
| A | 6677 | 60 | 0.898607% |
| B | 6677 | 85 | 1.273027% |
| C | 6677 | 66 | 0.988468% |
| D | 6677 | 1805 | 27.033099% |
Noise dominated data is calculated using 1-second bins in cleaned event files. If a bin has >2000 counts, and if more than 50% of those come from <1% of pixels, then it is considered to be noise-dominated and hence unusable.
| Quadrant | # 1 sec bins | Bins with >0 counts | Bins with >2000 counts | High rate bins dominated by noise | Noise dominated (total time) | Noise dominated (detector-on time) | Marked lightcurve |
|---|---|---|---|---|---|---|---|
| A | 8807 | 6678 | 0 | 0 | 0.00% | 0.00% | 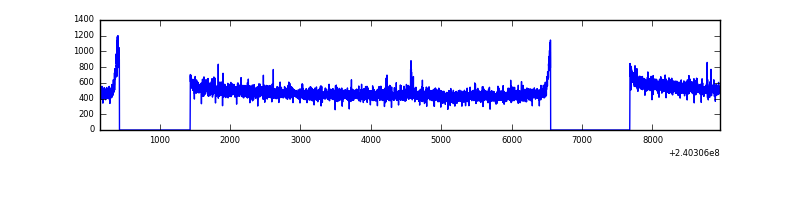 |
| B | 8807 | 6678 | 9 | 9 | 0.10% | 0.13% | 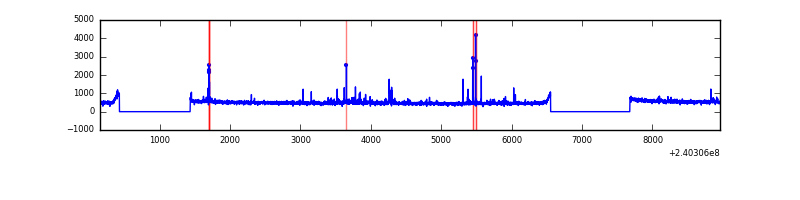 |
| C | 8807 | 6678 | 0 | 0 | 0.00% | 0.00% | 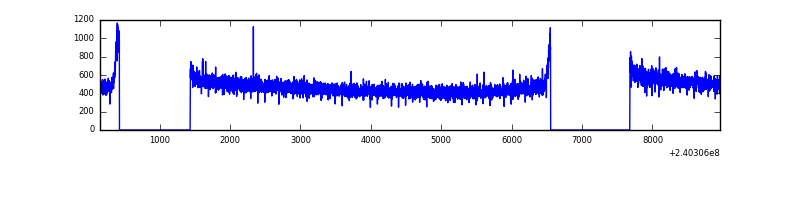 |
| D | 8807 | 6677 | 1620 | 1620 | 18.39% | 24.26% | 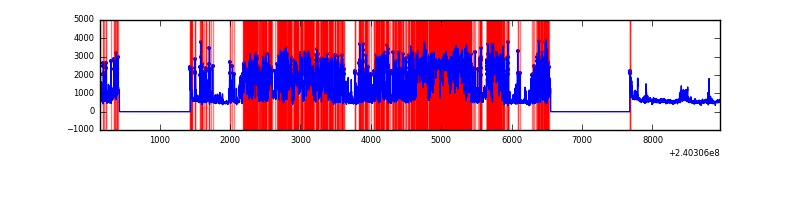 |
Top three noisy pixels from each quadrant. If the there are fewer than three noisy pixels in the level2.evt file, extra rows are filled as -1
| Pixel properties | Quadrant properties | ||||||
|---|---|---|---|---|---|---|---|
| Quadrant | DetID | PixID | Counts | Sigma | Mean | Median | Sigma |
| A | 8 | 15 | 14144 | 78.58 | 835 | 818 | 169.6 |
| A | 15 | 174 | 7697 | 40.56 | 835 | 818 | 169.6 |
| A | 0 | 226 | 7629 | 40.16 | 835 | 818 | 169.6 |
| B | 4 | 239 | 51924 | 320.03 | 834 | 815 | 159.7 |
| B | 0 | 214 | 46222 | 284.33 | 834 | 815 | 159.7 |
| B | 4 | 81 | 28068 | 170.65 | 834 | 815 | 159.7 |
| C | 13 | 61 | 6107 | 28.22 | 810 | 815 | 187.5 |
| C | 3 | 202 | 2049 | 6.58 | 810 | 815 | 187.5 |
| C | 14 | 67 | 1953 | 6.07 | 810 | 815 | 187.5 |
| D | 1 | 52 | 4147620 | 22567.41 | 739 | 721 | 183.8 |
| D | 4 | 95 | 1167435 | 6349.25 | 739 | 721 | 183.8 |
| D | 8 | 195 | 327688 | 1779.35 | 739 | 721 | 183.8 |
Histogram calculated using DETX and DETY for each event in the final _common_clean file
| Quadrant A | 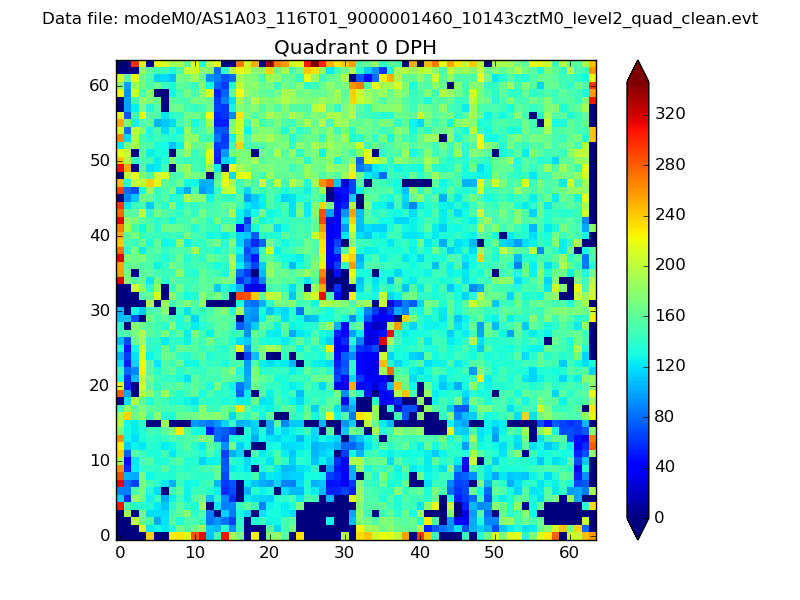 |
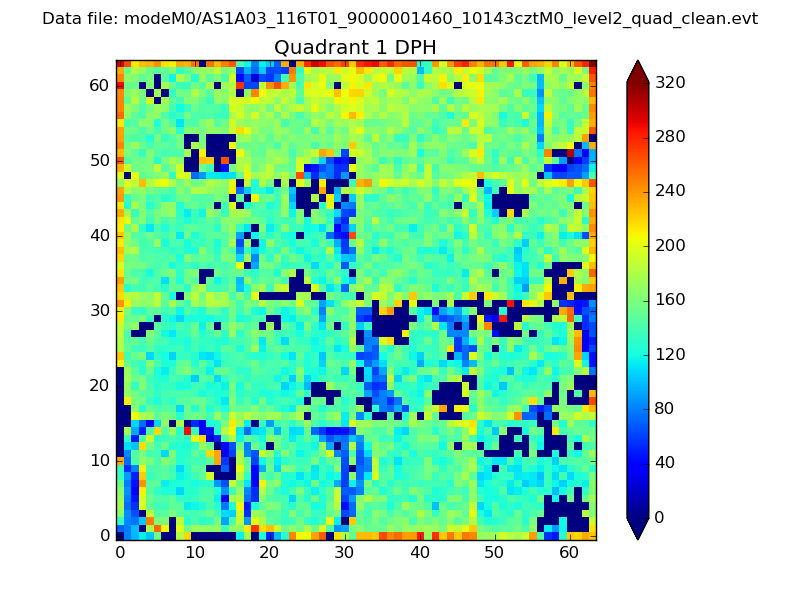 |
Quadrant B |
|---|---|---|---|
| Quadrant D | 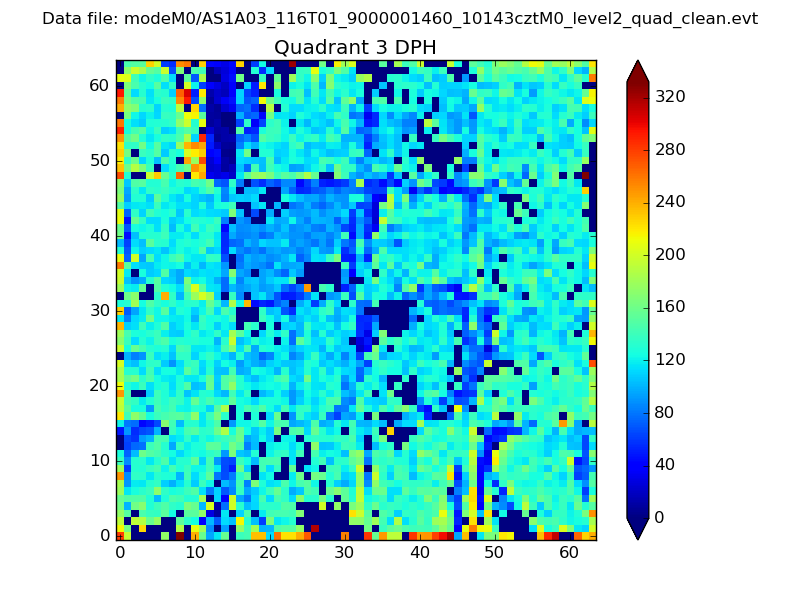 |
 |
Quadrant C |
| Plot type | Count rate plots | Images |
|---|---|---|
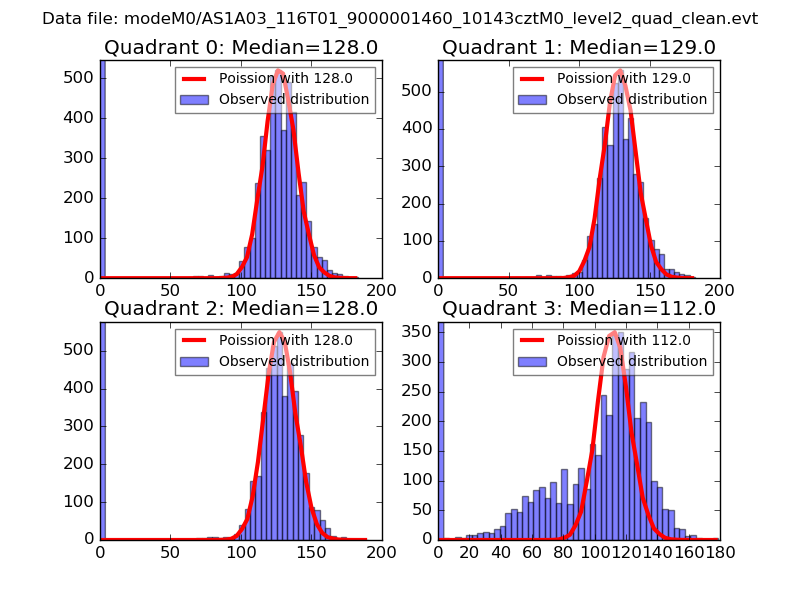
| Comparison with Poisson distribution Blue bars denote a histogram of data divided into 1 sec bins. Red curve is a Poisson curve with rate = median count rate of data. |
 |
 |
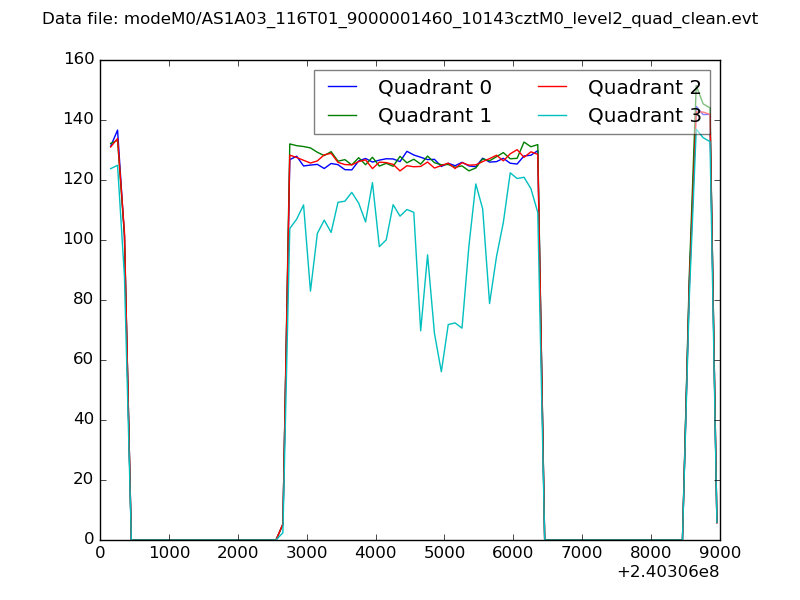
| Quadrant-wise count rates Data is divided into 100 sec bins |
 |
|
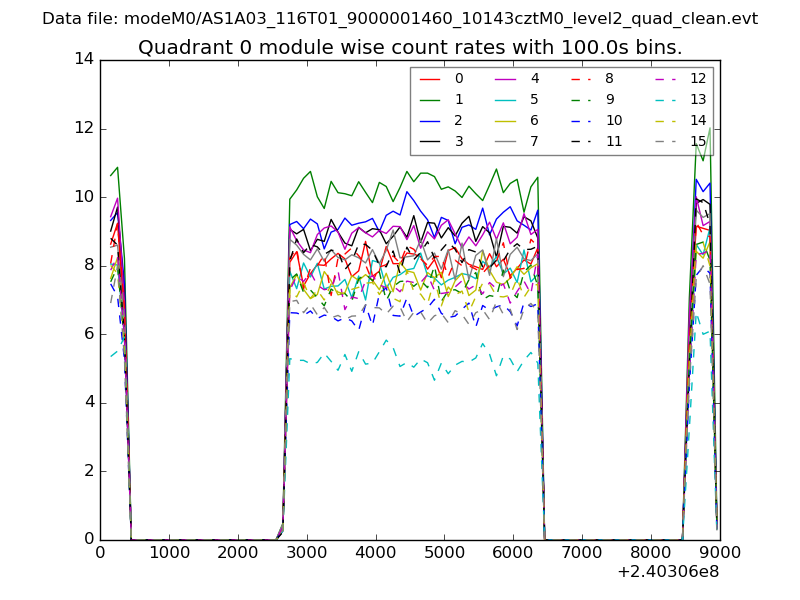
| Module-wise count rates for Quadrant A Data is divided into 100 sec bins |
 |
 |
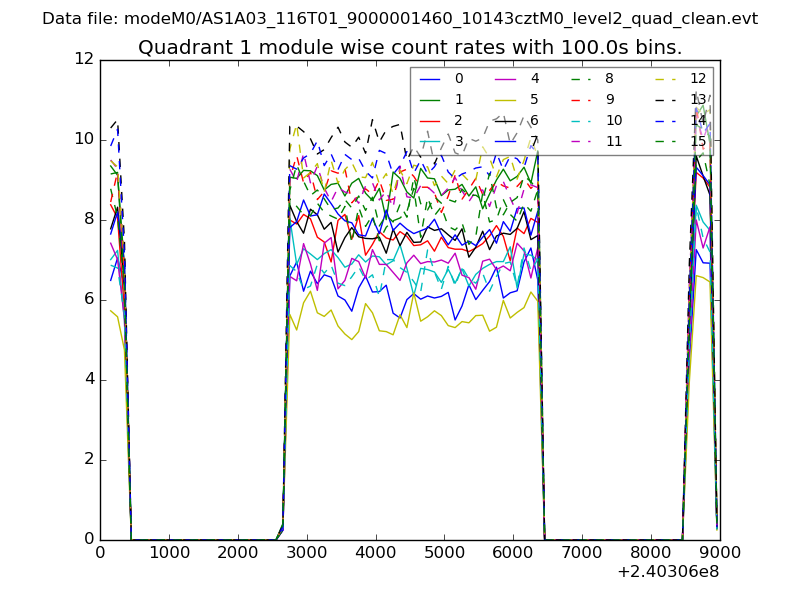
| Module-wise count rates for Quadrant B Data is divided into 100 sec bins |
 |
 |
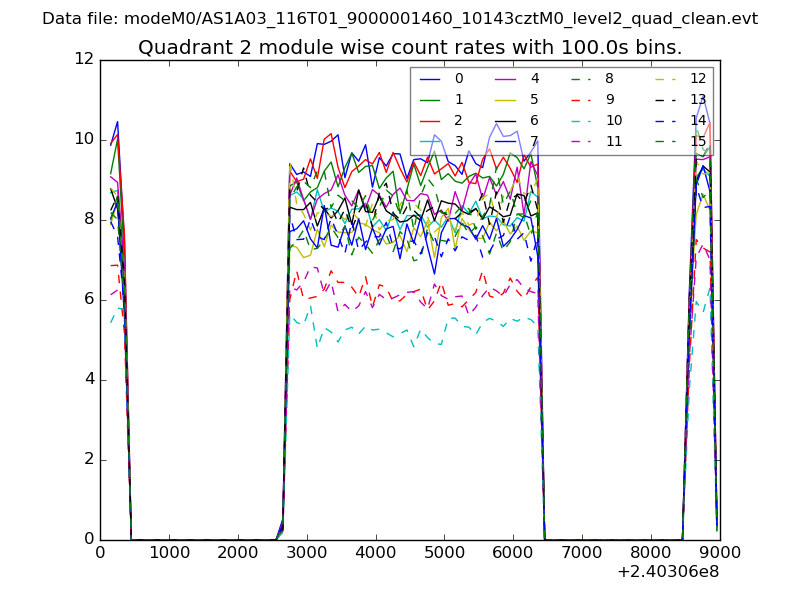
| Module-wise count rates for Quadrant C Data is divided into 100 sec bins |
 |
 |
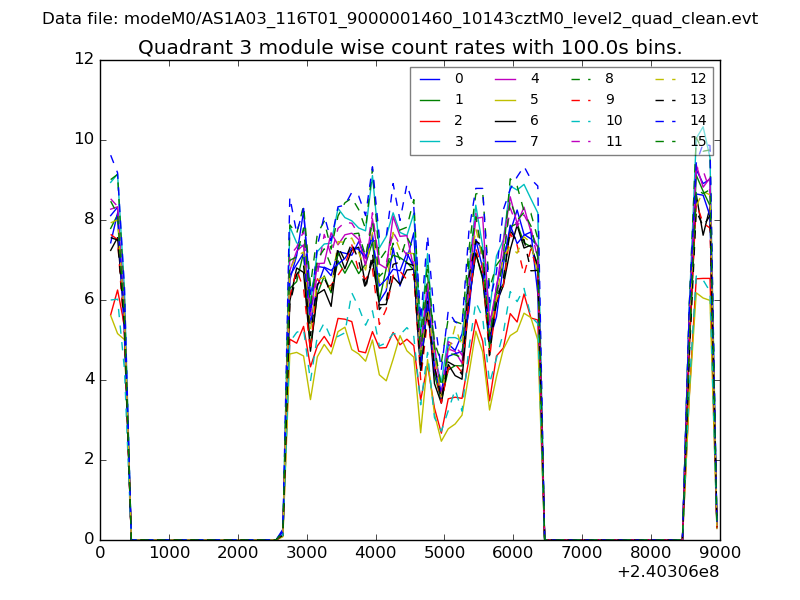
| Module-wise count rates for Quadrant D Data is divided into 100 sec bins |
 |
 |
| Parameter | Plot |
|---|---|
| CZT HV Monitor | 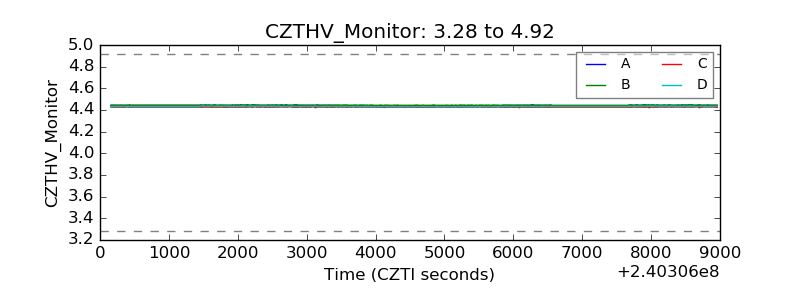 |
| D_VDD |  |
| Temperature 1 | 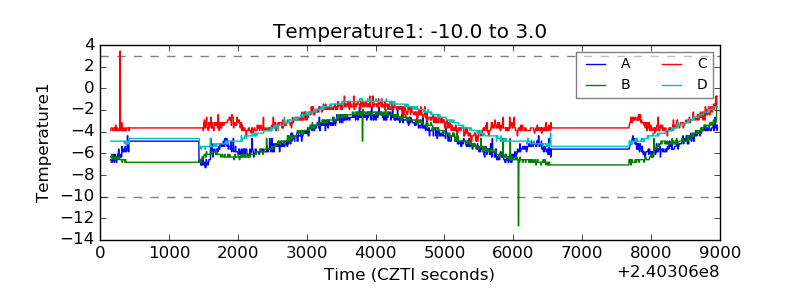 |
| Veto HV Monitor | 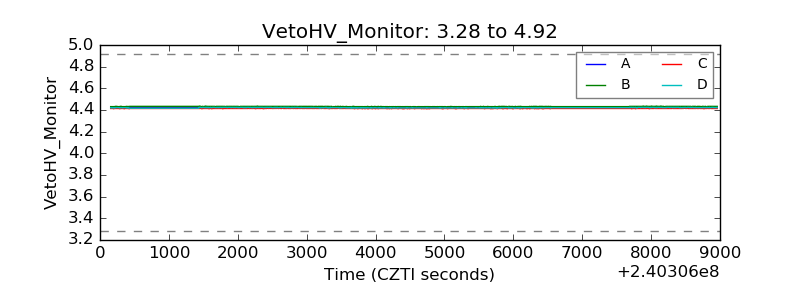 |
| Veto LLD | 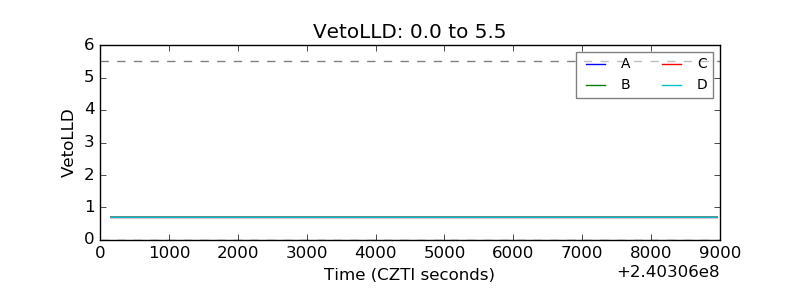 |
| Alpha Counter | 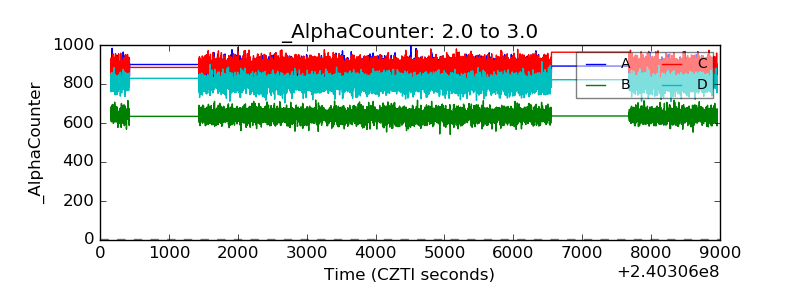 |
| _CPM_Rate | 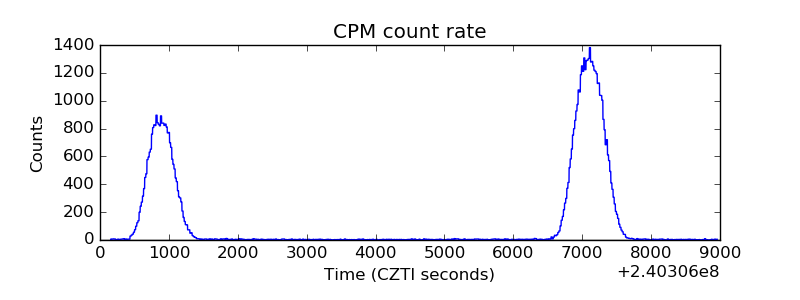 |
| CZT Counter |  |
| +2.5 Volts monitor |  |
| +5 Volts monitor |  |
| _ROLL_ROT | 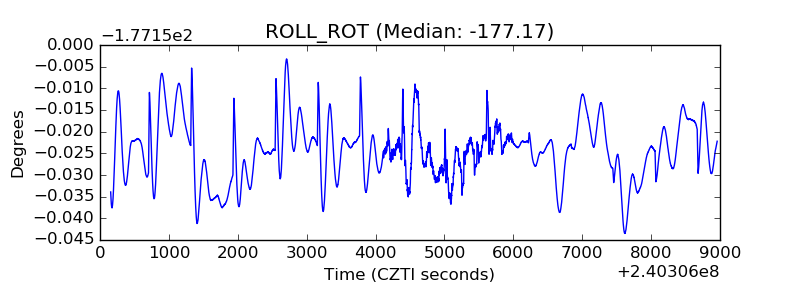 |
| _Roll_DEC | 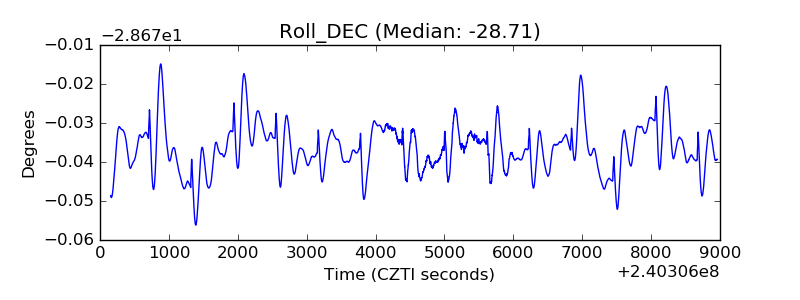 |
| _Roll_RA |  |
| Veto Counter | 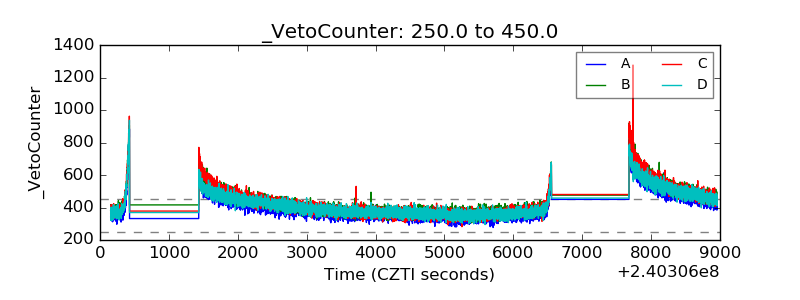 |