| Param | Original file | Final file |
|---|---|---|
| Filename | modeM0/AS1A03_116T01_9000001460_10144cztM0_level2.evt | modeM0/AS1A03_116T01_9000001460_10144cztM0_level2_quad_clean.evt |
| Size (bytes) | 482,005,440 | 95,040,000 |
| Size | 459.7 MB | 90.6 MB |
| Events in quadrant A | 3,159,863 | 620,954 |
| Events in quadrant B | 3,408,162 | 627,635 |
| Events in quadrant C | 3,046,655 | 617,294 |
| Events in quadrant D | 4,556,054 | 573,335 |
| Mode M9 | |||
|---|---|---|---|
| Quadrant | BADHDUFLAG | Total packets | Discarded packets |
| A | 0 | 12 | 0 |
| B | 0 | 12 | 0 |
| C | 0 | 12 | 0 |
| D | 0 | 12 | 0 |
| Mode SS | |||
|---|---|---|---|
| Quadrant | BADHDUFLAG | Total packets | Discarded packets |
| A | 0 | 128 | 0 |
| B | 0 | 128 | 0 |
| C | 0 | 128 | 0 |
| D | 0 | 128 | 0 |
| Mode M0 | |||
|---|---|---|---|
| Quadrant | BADHDUFLAG | Total packets | Discarded packets |
| A | 0 | 13395 | 6 |
| B | 0 | 14096 | 1 |
| C | 0 | 13169 | 1 |
| D | 0 | 17521 | 1 |
| Quadrant | Total seconds | Saturated seconds | Saturation percentage |
|---|---|---|---|
| A | 6286 | 62 | 0.986319% |
| B | 6288 | 71 | 1.129135% |
| C | 6288 | 47 | 0.747455% |
| D | 6288 | 310 | 4.930025% |
Noise dominated data is calculated using 1-second bins in cleaned event files. If a bin has >2000 counts, and if more than 50% of those come from <1% of pixels, then it is considered to be noise-dominated and hence unusable.
| Quadrant | # 1 sec bins | Bins with >0 counts | Bins with >2000 counts | High rate bins dominated by noise | Noise dominated (total time) | Noise dominated (detector-on time) | Marked lightcurve |
|---|---|---|---|---|---|---|---|
| A | 7483 | 6288 | 2 | 2 | 0.03% | 0.03% | 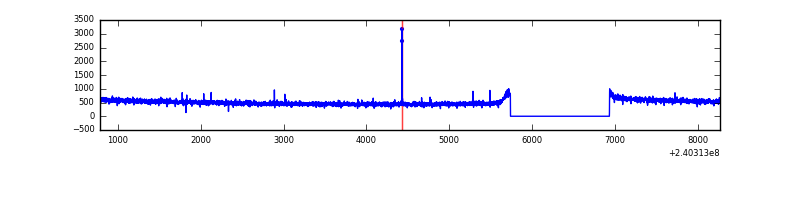 |
| B | 7483 | 6288 | 10 | 10 | 0.13% | 0.16% | 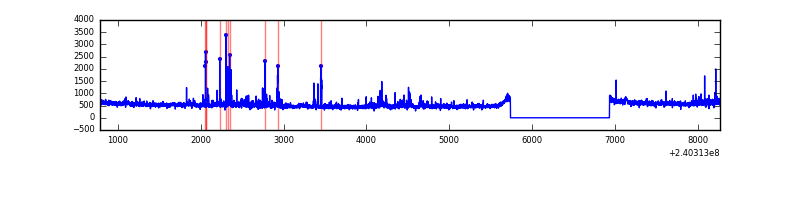 |
| C | 7483 | 6288 | 0 | 0 | 0.00% | 0.00% | 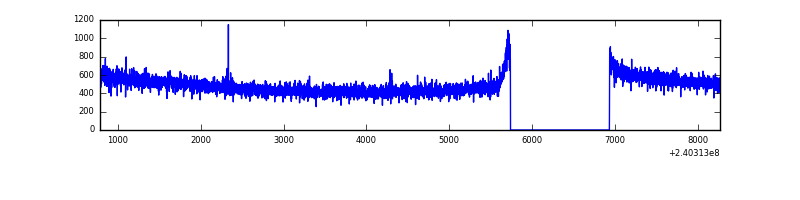 |
| D | 7483 | 6288 | 254 | 254 | 3.39% | 4.04% | 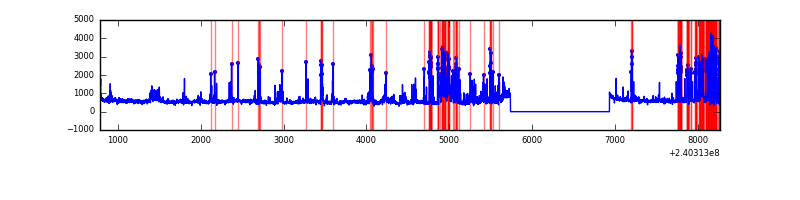 |
Top three noisy pixels from each quadrant. If the there are fewer than three noisy pixels in the level2.evt file, extra rows are filled as -1
| Pixel properties | Quadrant properties | ||||||
|---|---|---|---|---|---|---|---|
| Quadrant | DetID | PixID | Counts | Sigma | Mean | Median | Sigma |
| A | 15 | 174 | 10237 | 57.9 | 815 | 800 | 163.0 |
| A | 8 | 15 | 9389 | 52.7 | 815 | 800 | 163.0 |
| A | 0 | 226 | 7611 | 41.79 | 815 | 800 | 163.0 |
| B | 0 | 214 | 129349 | 836.01 | 809 | 792 | 153.8 |
| B | 4 | 81 | 31724 | 201.15 | 809 | 792 | 153.8 |
| B | 4 | 239 | 30107 | 190.64 | 809 | 792 | 153.8 |
| C | 13 | 61 | 5851 | 28.19 | 781 | 788 | 179.6 |
| C | 3 | 202 | 1959 | 6.52 | 781 | 788 | 179.6 |
| C | -1 | -1 | -1 | -1.0 | 781 | 788 | 179.6 |
| D | 1 | 52 | 1082254 | 5566.97 | 766 | 747 | 194.3 |
| D | 8 | 195 | 215297 | 1104.38 | 766 | 747 | 194.3 |
| D | 2 | 33 | 152390 | 780.57 | 766 | 747 | 194.3 |
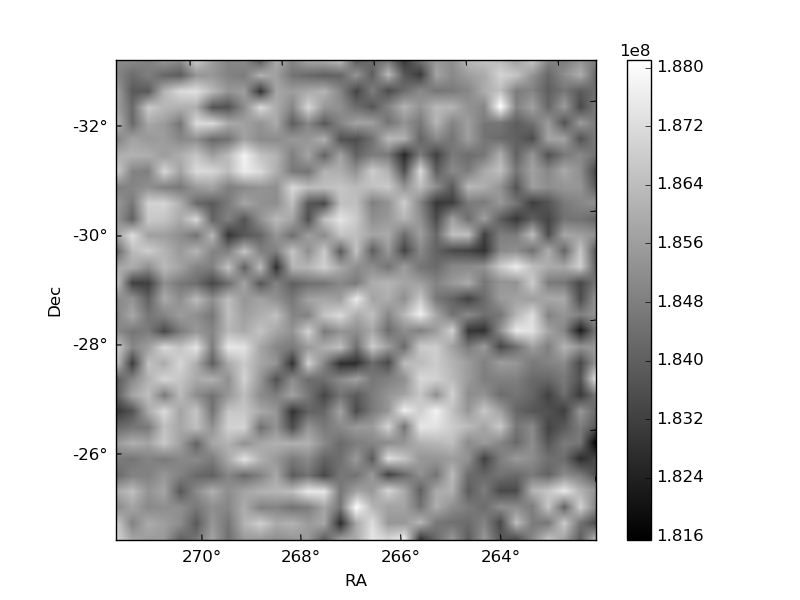
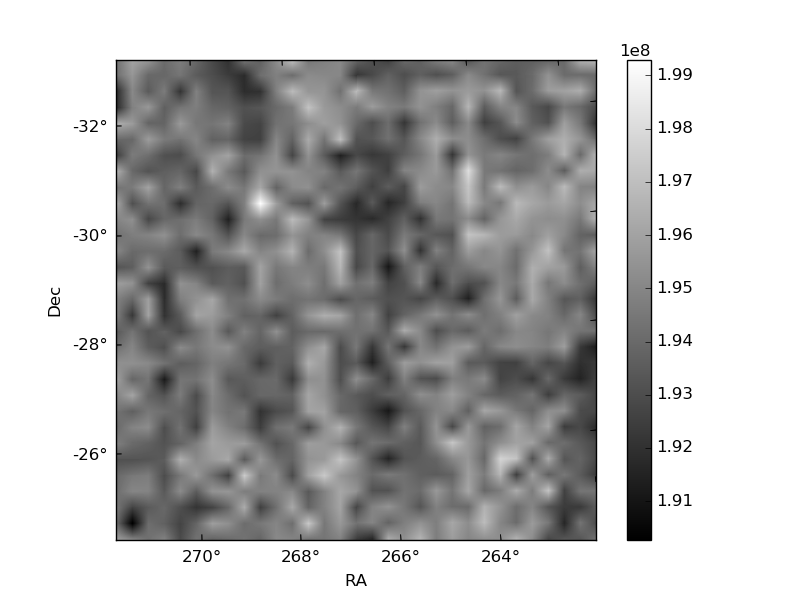
Histogram calculated using DETX and DETY for each event in the final _common_clean file
| Quadrant A | 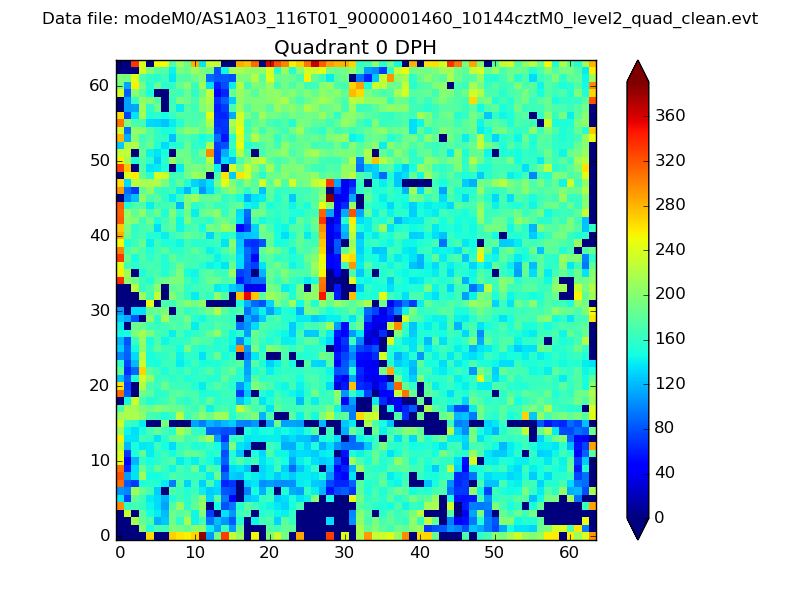 |
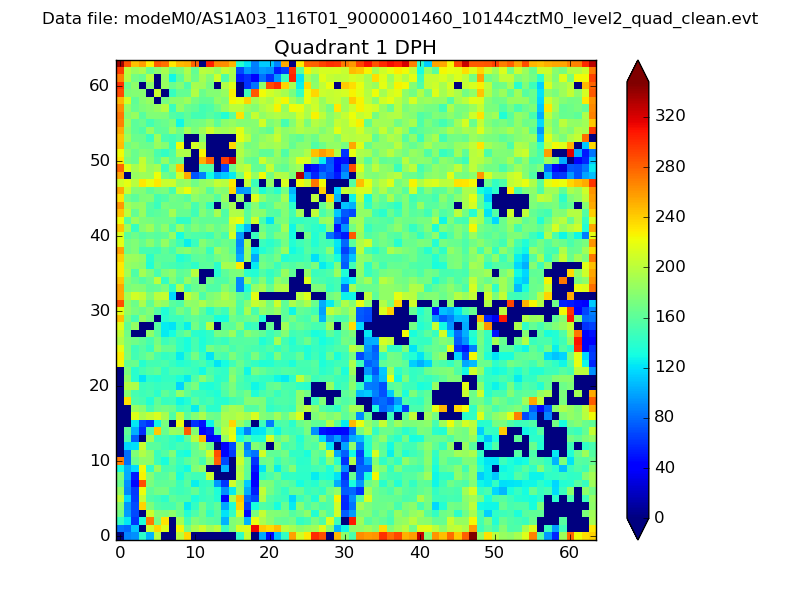 |
Quadrant B |
|---|---|---|---|
| Quadrant D | 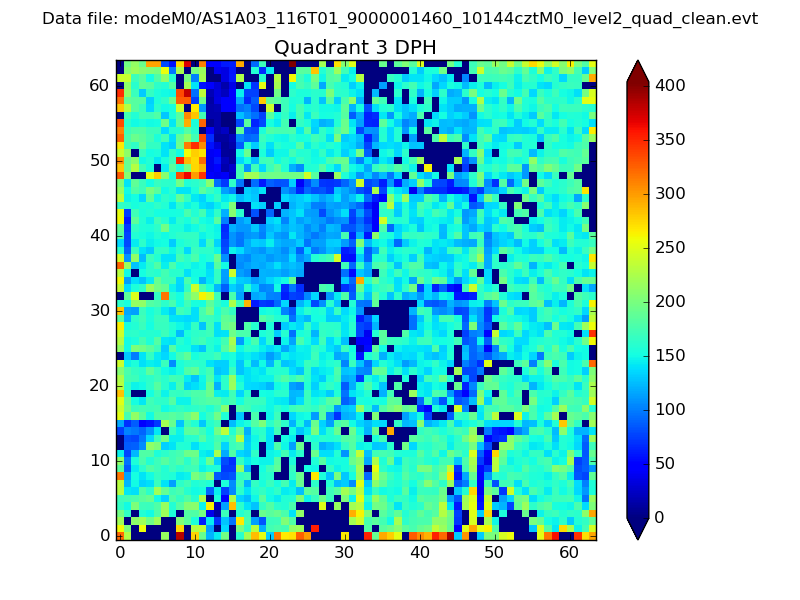 |
 |
Quadrant C |
| Plot type | Count rate plots | Images |
|---|---|---|
| Comparison with Poisson distribution Blue bars denote a histogram of data divided into 1 sec bins. Red curve is a Poisson curve with rate = median count rate of data. |
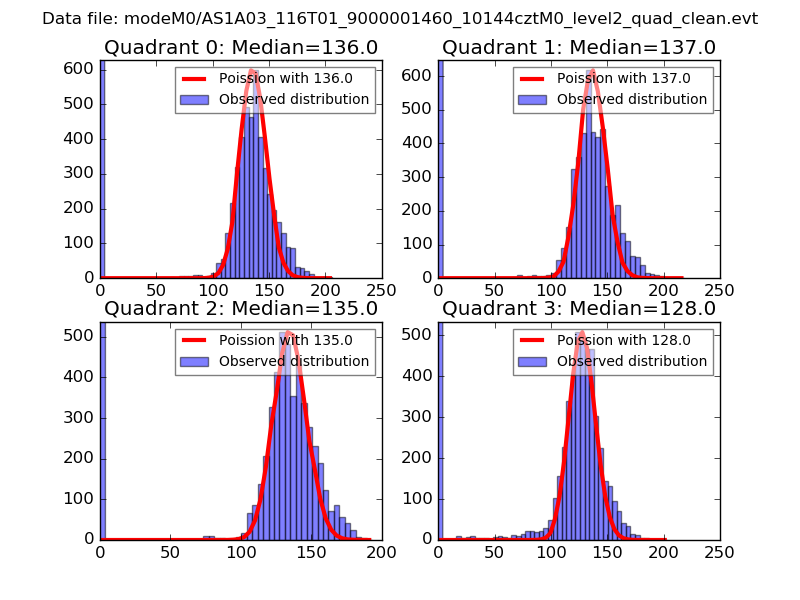 |
 |
| Quadrant-wise count rates Data is divided into 100 sec bins |
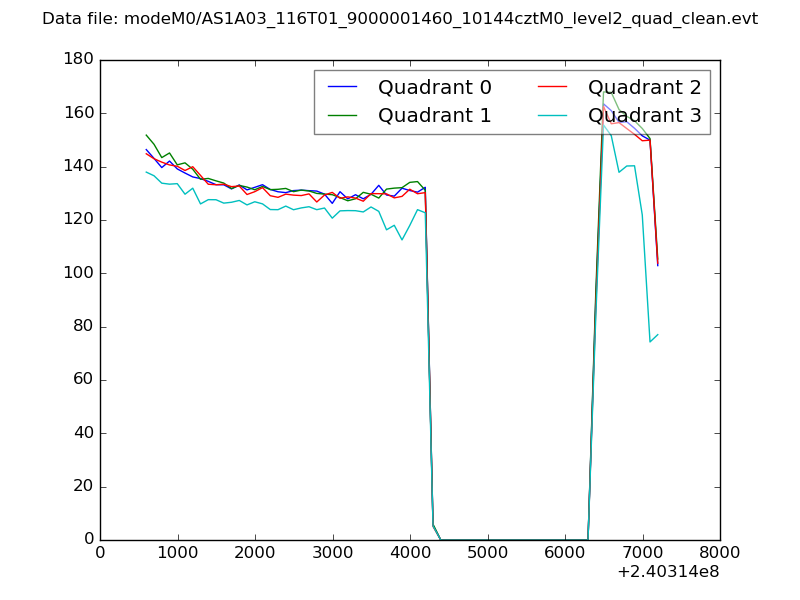 |
|
| Module-wise count rates for Quadrant A Data is divided into 100 sec bins |
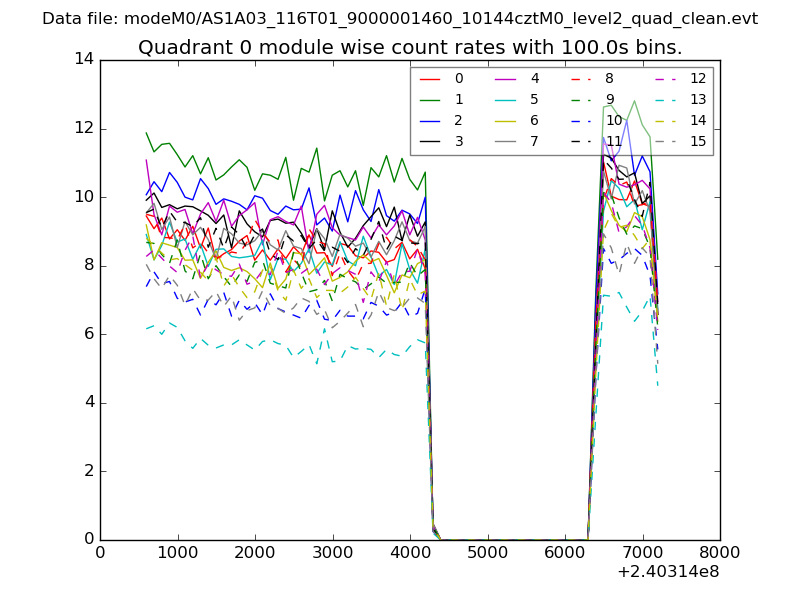 |
 |
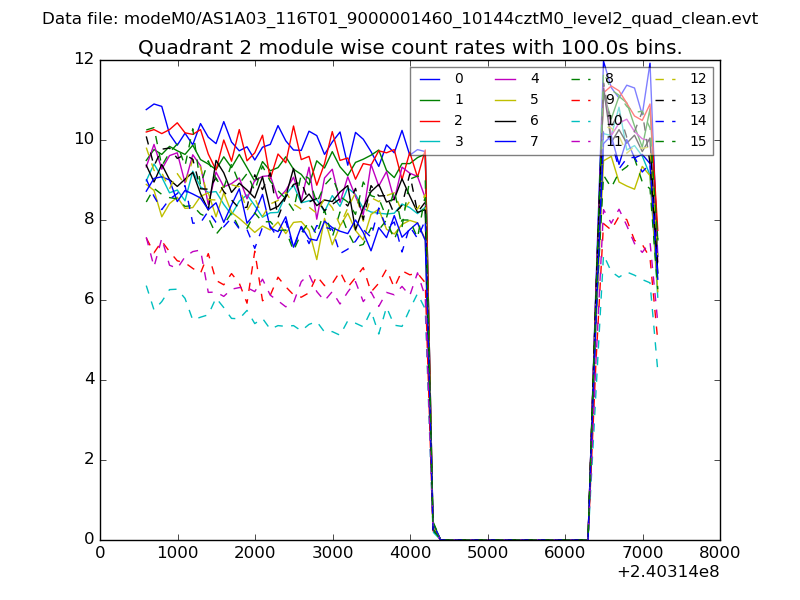
| Module-wise count rates for Quadrant B Data is divided into 100 sec bins |
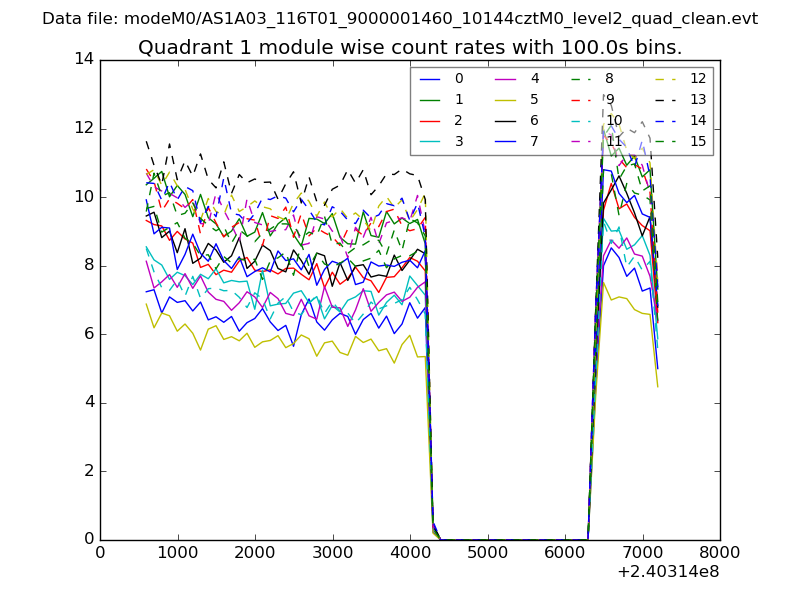 |
 |
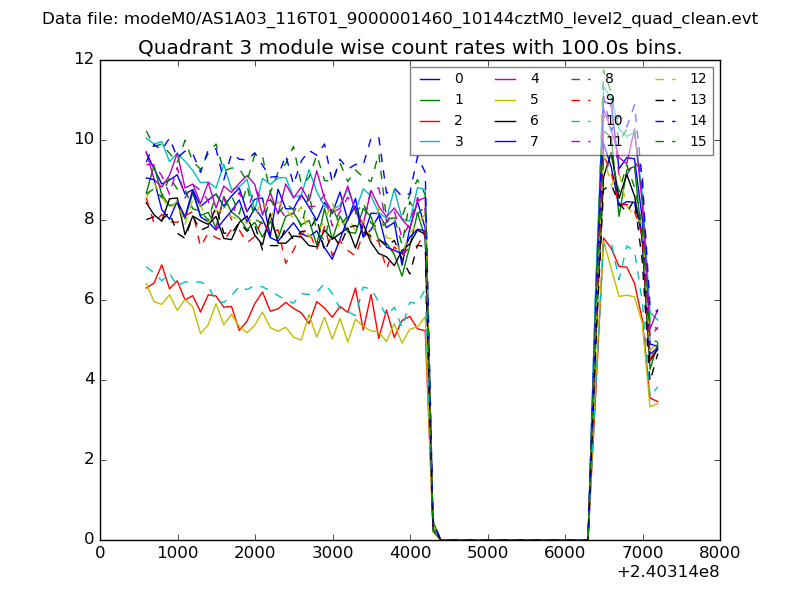
| Module-wise count rates for Quadrant C Data is divided into 100 sec bins |
 |
 |
| Module-wise count rates for Quadrant D Data is divided into 100 sec bins |
 |
 |
| Parameter | Plot |
|---|---|
| CZT HV Monitor | 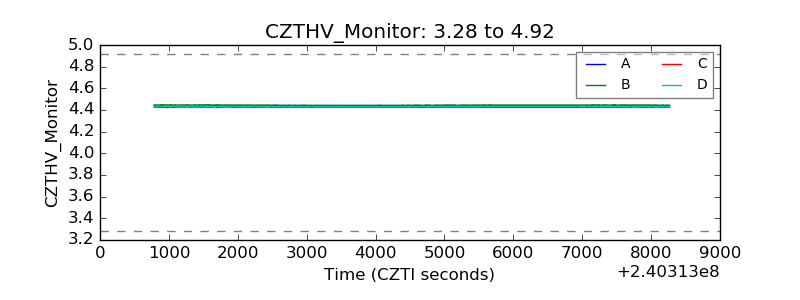 |
| D_VDD |  |
| Temperature 1 | 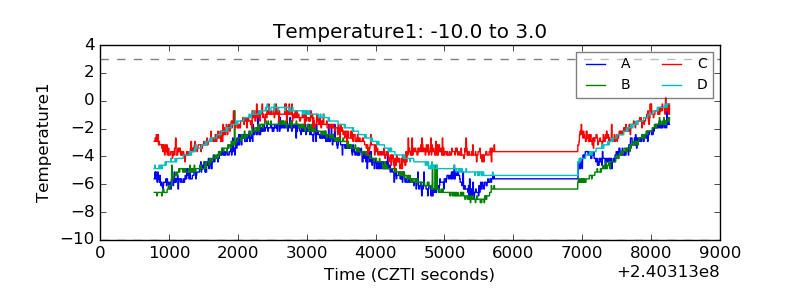 |
| Veto HV Monitor | 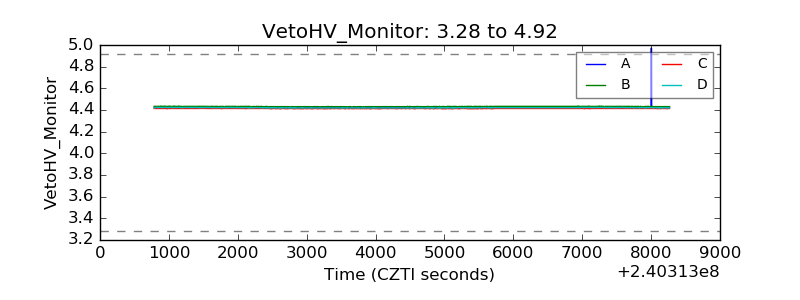 |
| Veto LLD | 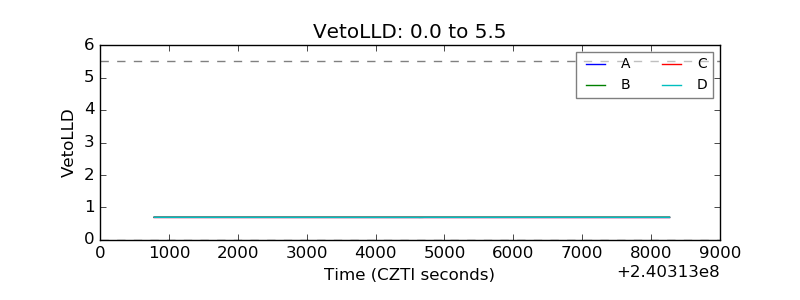 |
| Alpha Counter | 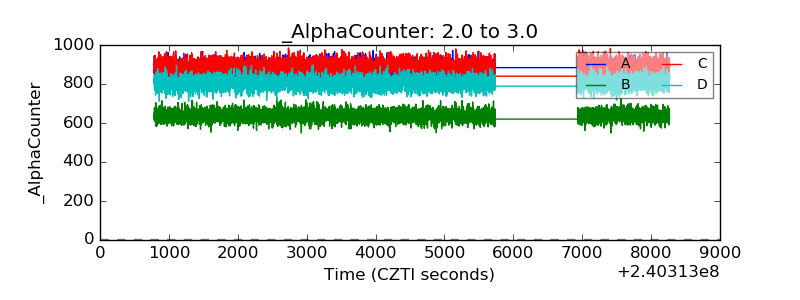 |
| _CPM_Rate | 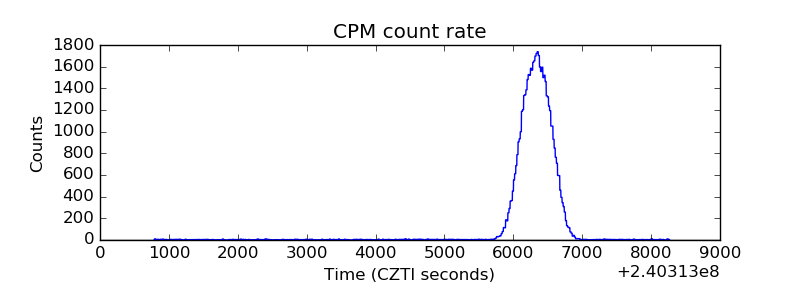 |
| CZT Counter |  |
| +2.5 Volts monitor |  |
| +5 Volts monitor |  |
| _ROLL_ROT | 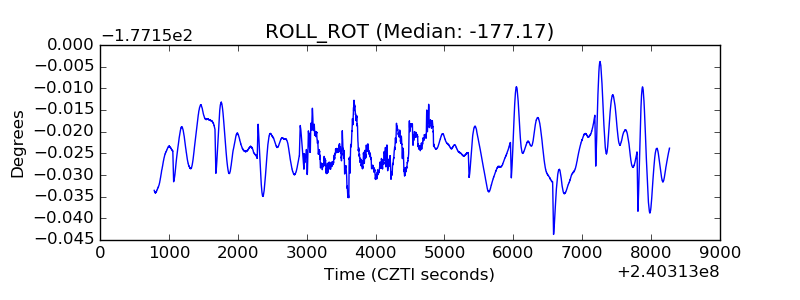 |
| _Roll_DEC | 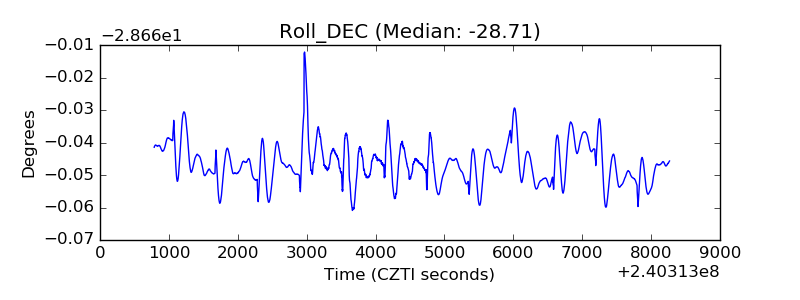 |
| _Roll_RA | 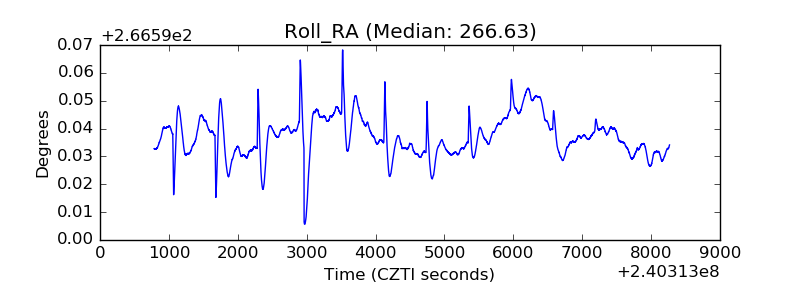 |
| Veto Counter | 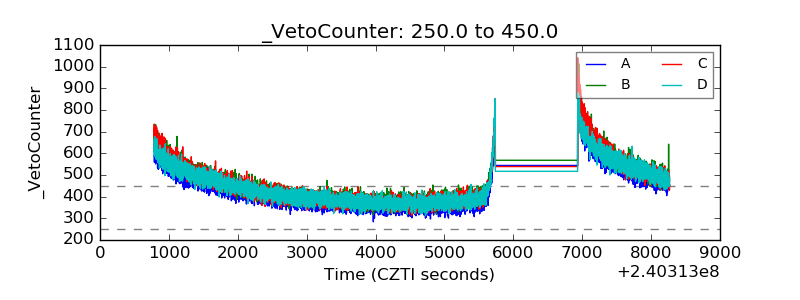 |