| Param | Original file | Final file |
|---|---|---|
| Filename | modeM0/AS1A03_116T01_9000001460_10146cztM0_level2.evt | modeM0/AS1A03_116T01_9000001460_10146cztM0_level2_quad_clean.evt |
| Size (bytes) | 501,891,840 | 114,039,360 |
| Size | 478.6 MB | 108.8 MB |
| Events in quadrant A | 3,609,608 | 764,798 |
| Events in quadrant B | 3,601,133 | 774,532 |
| Events in quadrant C | 3,126,668 | 752,920 |
| Events in quadrant D | 4,427,328 | 714,247 |
| Mode M9 | |||
|---|---|---|---|
| Quadrant | BADHDUFLAG | Total packets | Discarded packets |
| A | 0 | 19 | 0 |
| B | 0 | 19 | 0 |
| C | 0 | 19 | 0 |
| D | 0 | 20 | 0 |
| Mode SS | |||
|---|---|---|---|
| Quadrant | BADHDUFLAG | Total packets | Discarded packets |
| A | 0 | 132 | 0 |
| B | 0 | 132 | 0 |
| C | 0 | 132 | 0 |
| D | 0 | 132 | 0 |
| Mode M0 | |||
|---|---|---|---|
| Quadrant | BADHDUFLAG | Total packets | Discarded packets |
| A | 0 | 14871 | 3 |
| B | 0 | 14966 | 2 |
| C | 0 | 13513 | 2 |
| D | 0 | 17698 | 2 |
| Quadrant | Total seconds | Saturated seconds | Saturation percentage |
|---|---|---|---|
| A | 6407 | 141 | 2.200718% |
| B | 6407 | 90 | 1.404714% |
| C | 6407 | 38 | 0.593101% |
| D | 6407 | 167 | 2.606524% |
Noise dominated data is calculated using 1-second bins in cleaned event files. If a bin has >2000 counts, and if more than 50% of those come from <1% of pixels, then it is considered to be noise-dominated and hence unusable.
| Quadrant | # 1 sec bins | Bins with >0 counts | Bins with >2000 counts | High rate bins dominated by noise | Noise dominated (total time) | Noise dominated (detector-on time) | Marked lightcurve |
|---|---|---|---|---|---|---|---|
| A | 7717 | 6407 | 67 | 67 | 0.87% | 1.05% |  |
| B | 7717 | 6408 | 18 | 18 | 0.23% | 0.28% | 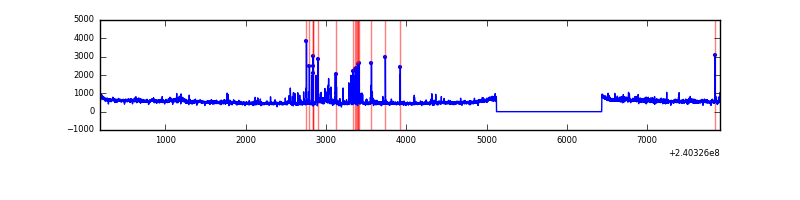 |
| C | 7717 | 6408 | 0 | 0 | 0.00% | 0.00% | 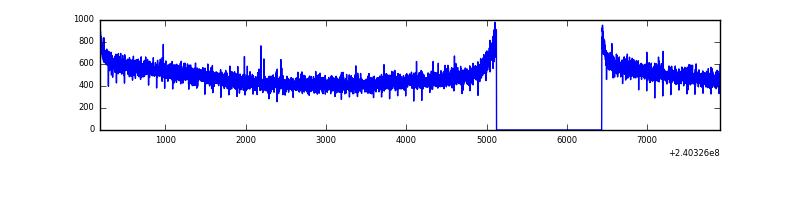 |
| D | 7717 | 6408 | 98 | 98 | 1.27% | 1.53% | 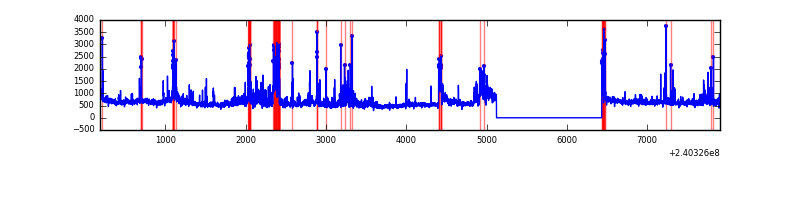 |
Top three noisy pixels from each quadrant. If the there are fewer than three noisy pixels in the level2.evt file, extra rows are filled as -1
| Pixel properties | Quadrant properties | ||||||
|---|---|---|---|---|---|---|---|
| Quadrant | DetID | PixID | Counts | Sigma | Mean | Median | Sigma |
| A | 15 | 223 | 180485 | 1077.16 | 839 | 825 | 166.8 |
| A | 15 | 174 | 93601 | 556.24 | 839 | 825 | 166.8 |
| A | 15 | 239 | 79723 | 473.04 | 839 | 825 | 166.8 |
| B | 4 | 81 | 122231 | 768.26 | 835 | 818 | 158.0 |
| B | 4 | 239 | 106673 | 669.81 | 835 | 818 | 158.0 |
| B | 0 | 214 | 59309 | 370.11 | 835 | 818 | 158.0 |
| C | 13 | 61 | 6075 | 28.72 | 801 | 807 | 183.4 |
| C | 14 | 67 | 4015 | 17.49 | 801 | 807 | 183.4 |
| C | 3 | 202 | 2013 | 6.57 | 801 | 807 | 183.4 |
| D | 1 | 52 | 450880 | 2354.77 | 803 | 783 | 191.1 |
| D | 8 | 195 | 398546 | 2080.98 | 803 | 783 | 191.1 |
| D | 2 | 136 | 212163 | 1105.88 | 803 | 783 | 191.1 |
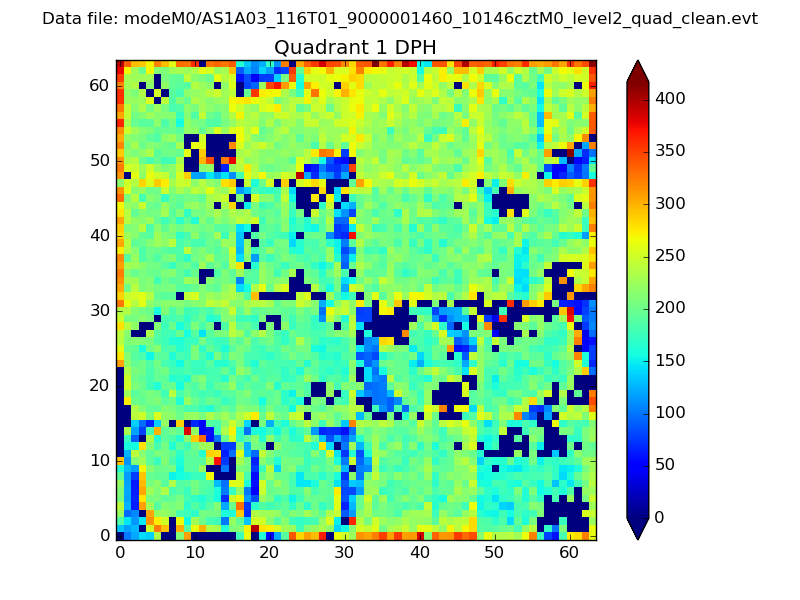
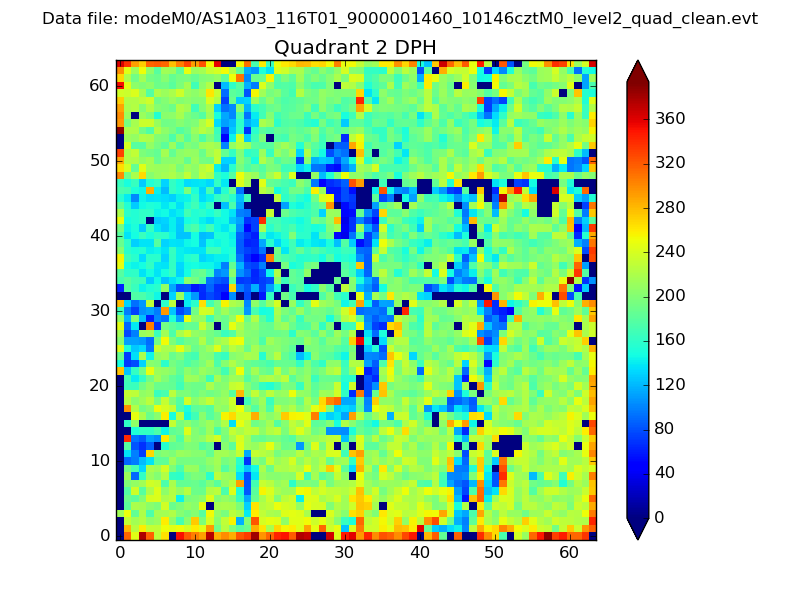
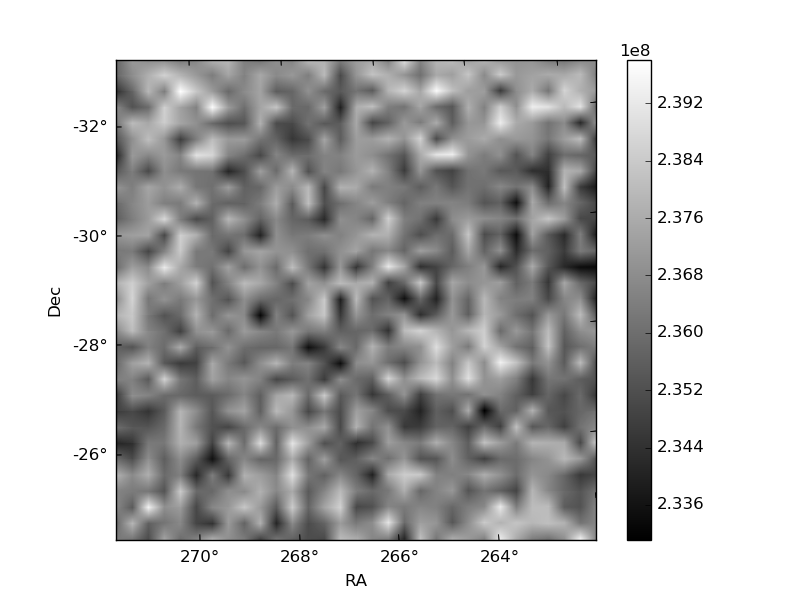
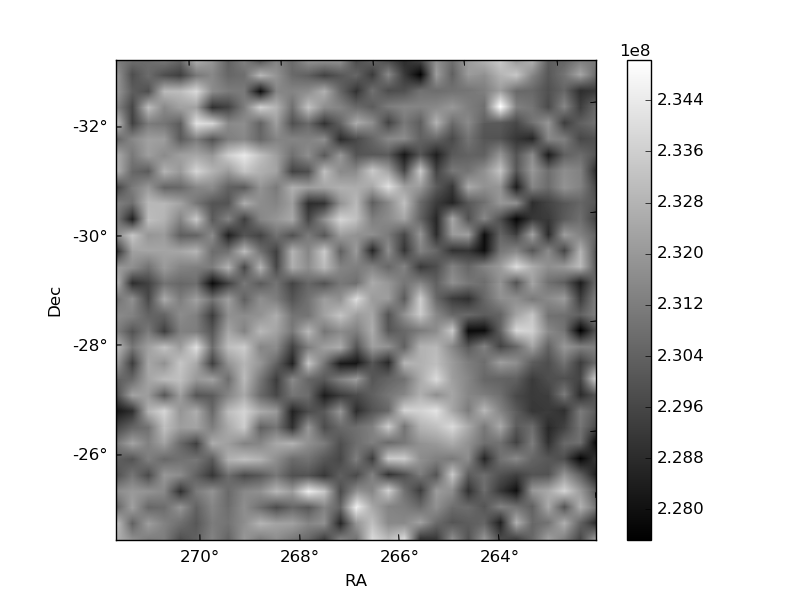
Histogram calculated using DETX and DETY for each event in the final _common_clean file
| Quadrant A |  |
 |
Quadrant B |
|---|---|---|---|
| Quadrant D | 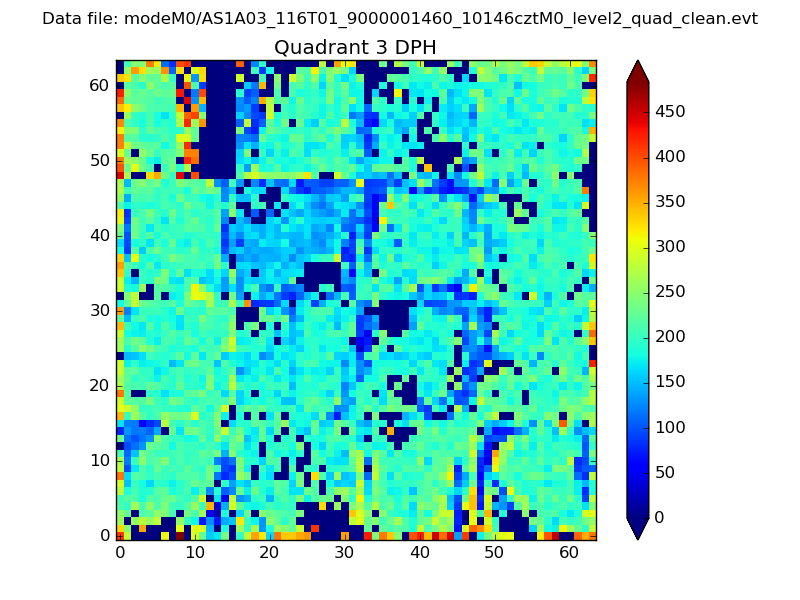 |
 |
Quadrant C |
| Plot type | Count rate plots | Images |
|---|---|---|
| Comparison with Poisson distribution Blue bars denote a histogram of data divided into 1 sec bins. Red curve is a Poisson curve with rate = median count rate of data. |
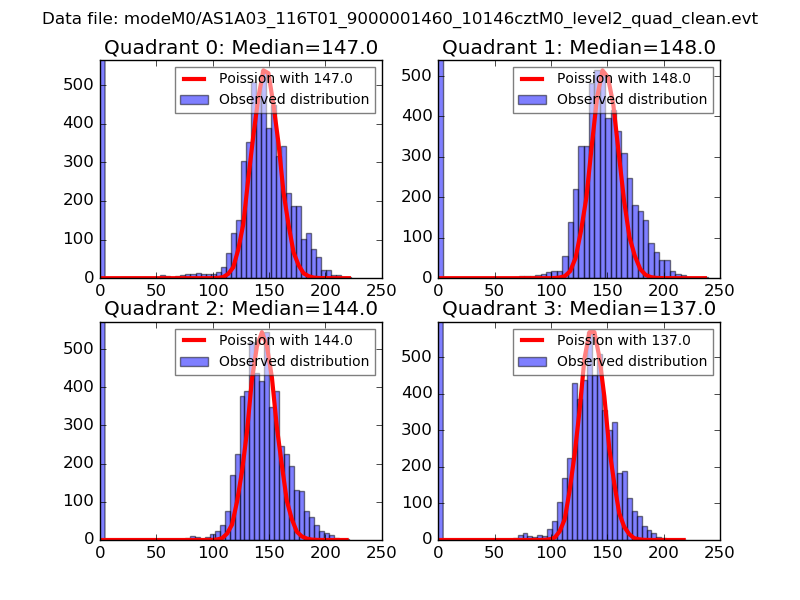 |
 |
| Quadrant-wise count rates Data is divided into 100 sec bins |
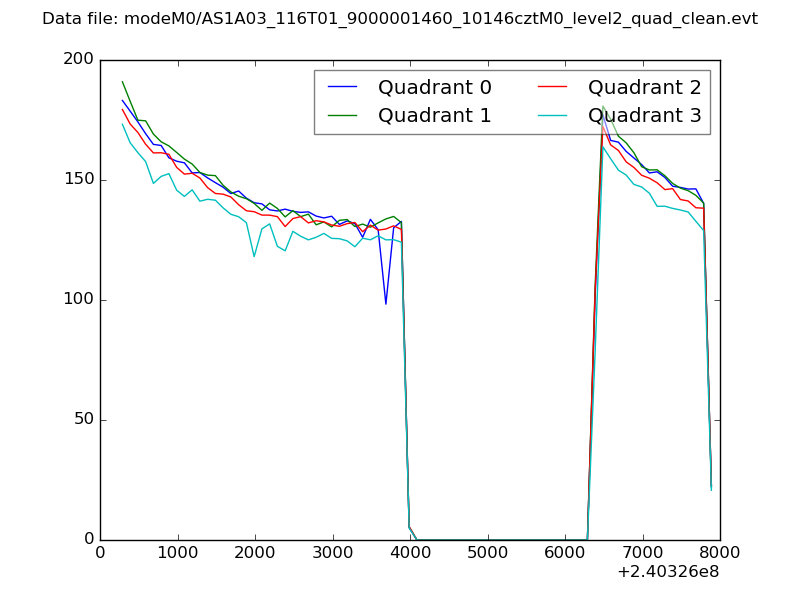 |
|
| Module-wise count rates for Quadrant A Data is divided into 100 sec bins |
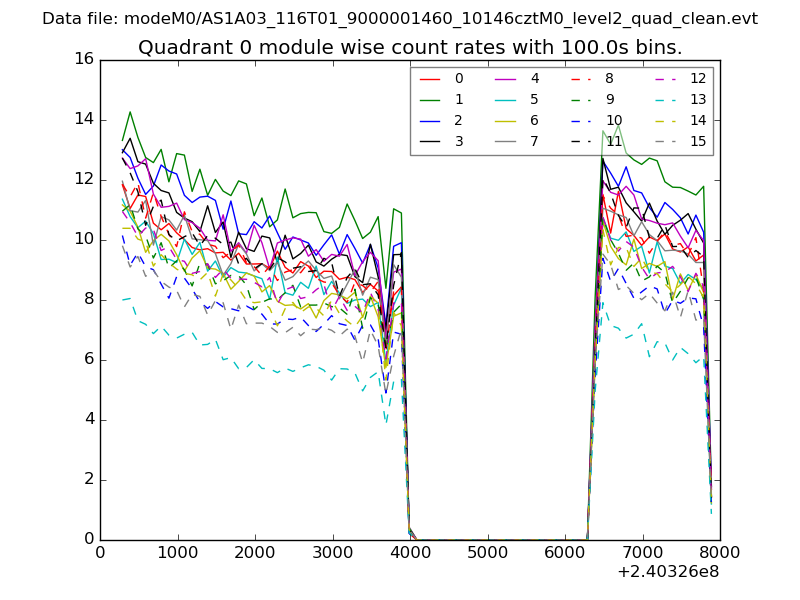 |
 |
| Module-wise count rates for Quadrant B Data is divided into 100 sec bins |
 |
 |
| Module-wise count rates for Quadrant C Data is divided into 100 sec bins |
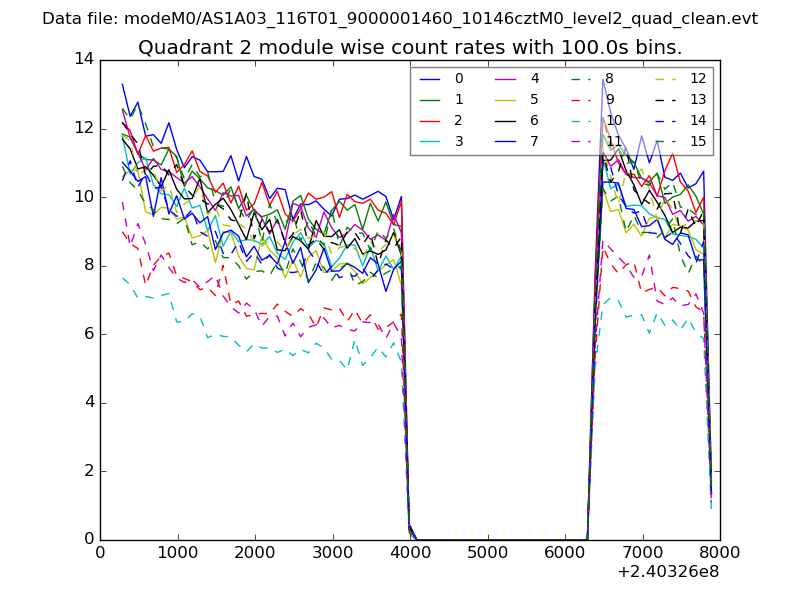 |
 |
| Module-wise count rates for Quadrant D Data is divided into 100 sec bins |
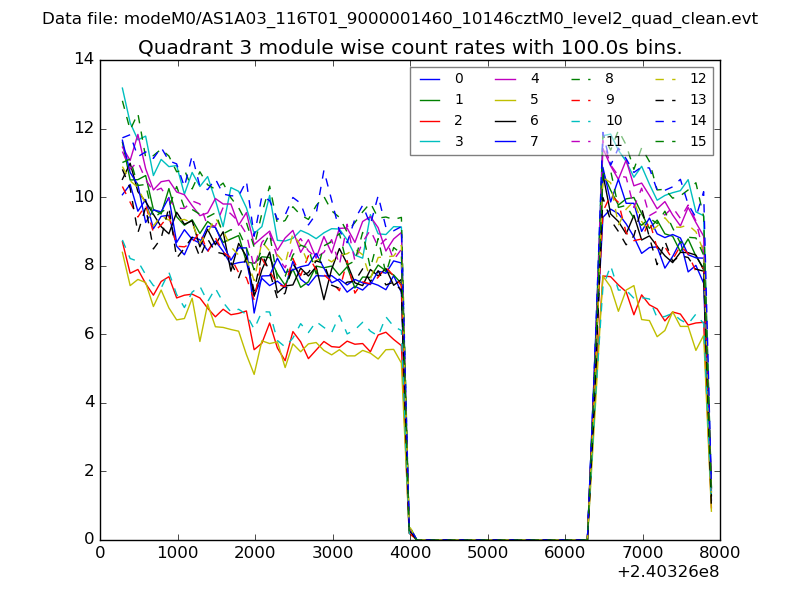 |
 |
| Parameter | Plot |
|---|---|
| CZT HV Monitor | 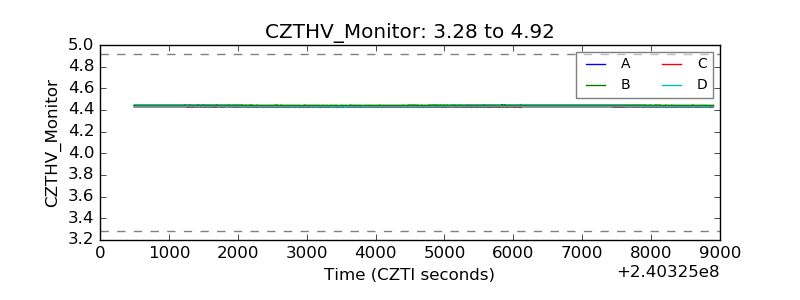 |
| D_VDD | 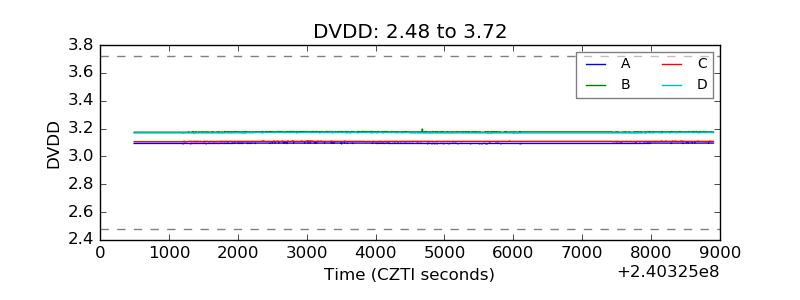 |
| Temperature 1 | 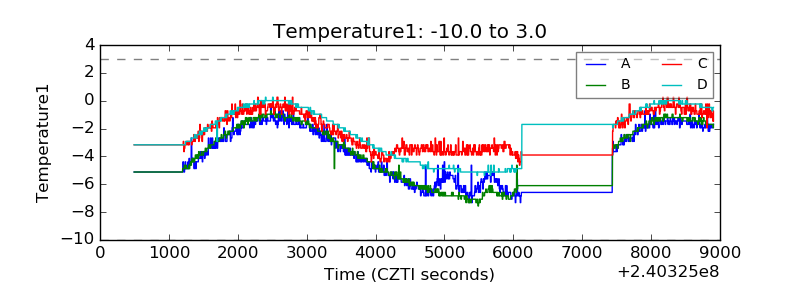 |
| Veto HV Monitor |  |
| Veto LLD | 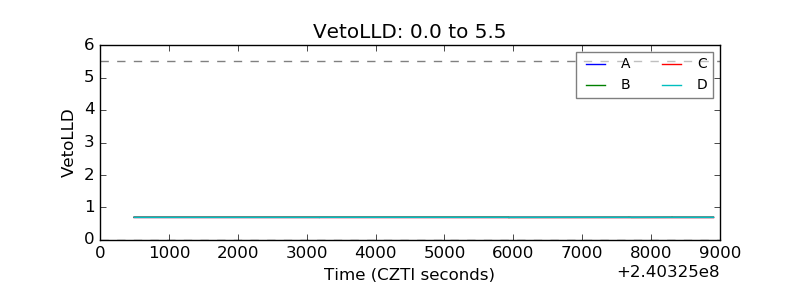 |
| Alpha Counter | 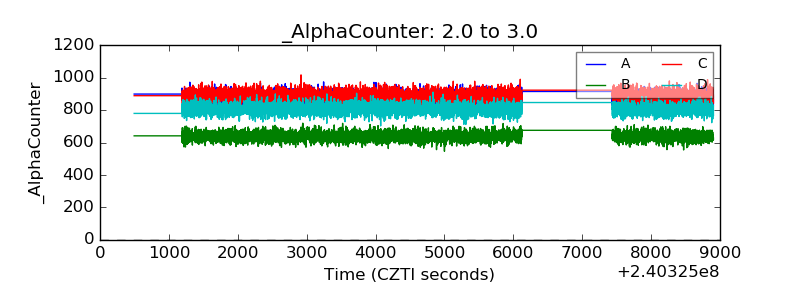 |
| _CPM_Rate | 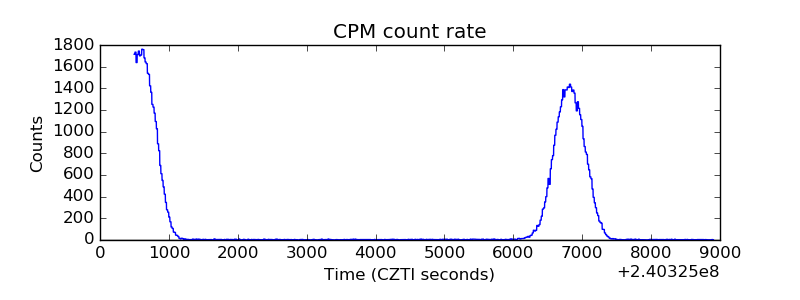 |
| CZT Counter |  |
| +2.5 Volts monitor |  |
| +5 Volts monitor |  |
| _ROLL_ROT | 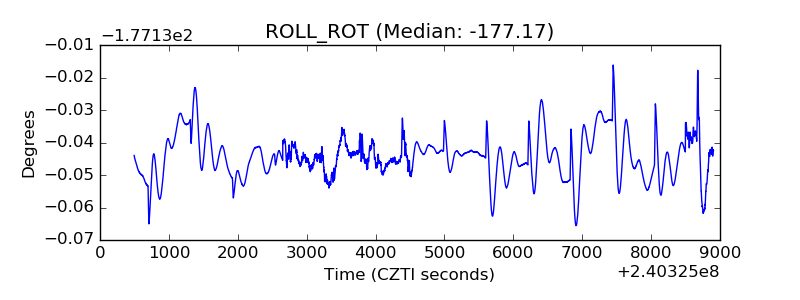 |
| _Roll_DEC | 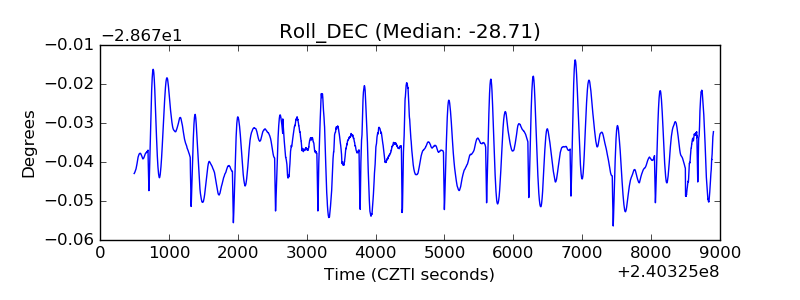 |
| _Roll_RA | 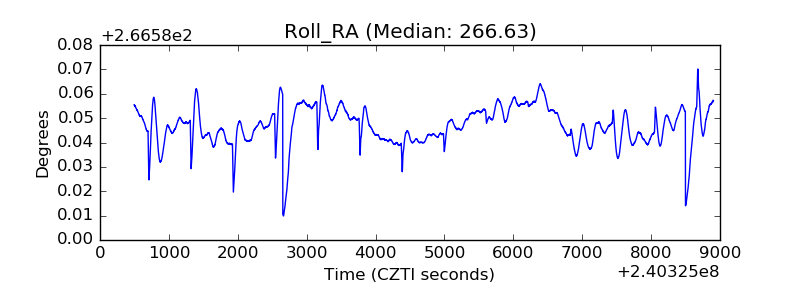 |
| Veto Counter | 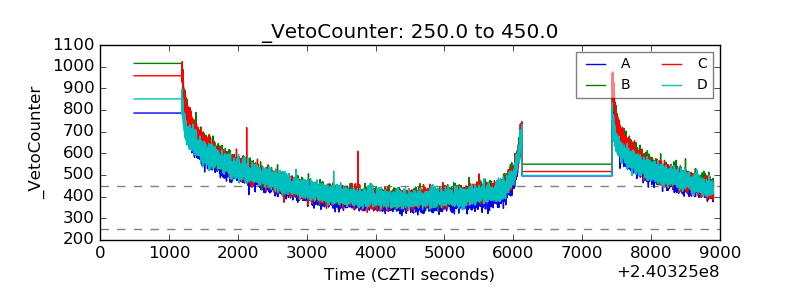 |