| Param | Original file | Final file |
|---|---|---|
| Filename | modeM0/AS1A03_116T01_9000001460_10148cztM0_level2.evt | modeM0/AS1A03_116T01_9000001460_10148cztM0_level2_quad_clean.evt |
| Size (bytes) | 573,465,600 | 91,615,680 |
| Size | 546.9 MB | 87.4 MB |
| Events in quadrant A | 3,488,043 | 594,006 |
| Events in quadrant B | 3,439,999 | 601,446 |
| Events in quadrant C | 3,057,646 | 590,658 |
| Events in quadrant D | 6,931,479 | 524,968 |
| Mode M9 | |||
|---|---|---|---|
| Quadrant | BADHDUFLAG | Total packets | Discarded packets |
| A | 0 | 10 | 0 |
| B | 0 | 10 | 0 |
| C | 0 | 10 | 0 |
| D | 0 | 10 | 0 |
| Mode SS | |||
|---|---|---|---|
| Quadrant | BADHDUFLAG | Total packets | Discarded packets |
| A | 0 | 136 | 0 |
| B | 0 | 136 | 0 |
| C | 0 | 136 | 0 |
| D | 0 | 136 | 0 |
| Mode M0 | |||
|---|---|---|---|
| Quadrant | BADHDUFLAG | Total packets | Discarded packets |
| A | 0 | 14727 | 2 |
| B | 0 | 14570 | 1 |
| C | 0 | 13746 | 1 |
| D | 0 | 25160 | 1 |
| Quadrant | Total seconds | Saturated seconds | Saturation percentage |
|---|---|---|---|
| A | 6638 | 132 | 1.988551% |
| B | 6638 | 89 | 1.340765% |
| C | 6638 | 46 | 0.692980% |
| D | 6638 | 1017 | 15.320880% |
Noise dominated data is calculated using 1-second bins in cleaned event files. If a bin has >2000 counts, and if more than 50% of those come from <1% of pixels, then it is considered to be noise-dominated and hence unusable.
| Quadrant | # 1 sec bins | Bins with >0 counts | Bins with >2000 counts | High rate bins dominated by noise | Noise dominated (total time) | Noise dominated (detector-on time) | Marked lightcurve |
|---|---|---|---|---|---|---|---|
| A | 7688 | 6639 | 49 | 49 | 0.64% | 0.74% |  |
| B | 7688 | 6639 | 22 | 22 | 0.29% | 0.33% | 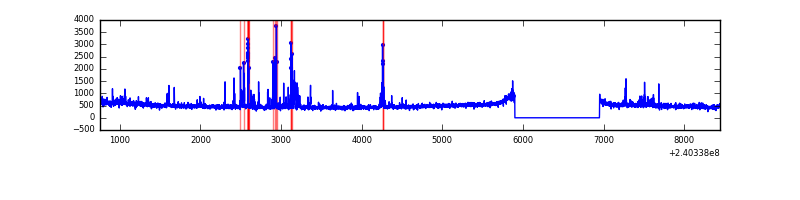 |
| C | 7688 | 6639 | 8 | 8 | 0.10% | 0.12% | 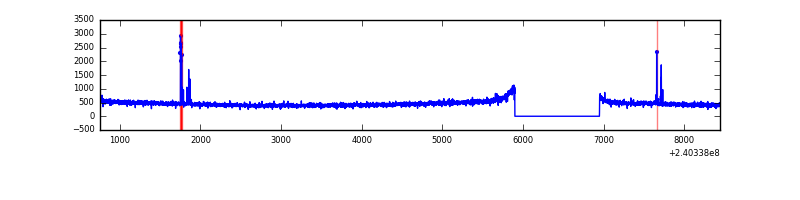 |
| D | 7688 | 6638 | 995 | 995 | 12.94% | 14.99% | 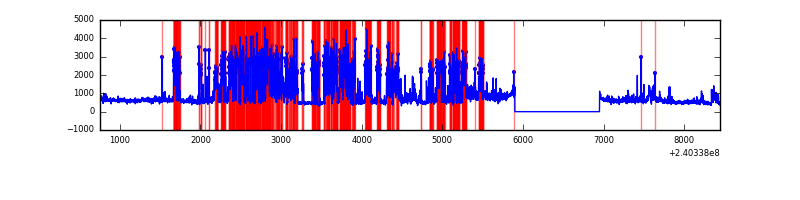 |
Top three noisy pixels from each quadrant. If the there are fewer than three noisy pixels in the level2.evt file, extra rows are filled as -1
| Pixel properties | Quadrant properties | ||||||
|---|---|---|---|---|---|---|---|
| Quadrant | DetID | PixID | Counts | Sigma | Mean | Median | Sigma |
| A | 15 | 223 | 172263 | 1047.25 | 803 | 788 | 163.7 |
| A | 15 | 239 | 76232 | 460.76 | 803 | 788 | 163.7 |
| A | 3 | 1 | 72573 | 438.41 | 803 | 788 | 163.7 |
| B | 4 | 239 | 145217 | 938.69 | 806 | 791 | 153.9 |
| B | 4 | 81 | 34983 | 222.23 | 806 | 791 | 153.9 |
| B | 0 | 245 | 24857 | 156.42 | 806 | 791 | 153.9 |
| C | 14 | 234 | 44537 | 243.97 | 770 | 775 | 179.4 |
| C | 14 | 67 | 11930 | 62.19 | 770 | 775 | 179.4 |
| C | 13 | 61 | 5852 | 28.3 | 770 | 775 | 179.4 |
| D | 1 | 52 | 3052140 | 17207.9 | 732 | 710 | 177.3 |
| D | 8 | 195 | 462707 | 2605.33 | 732 | 710 | 177.3 |
| D | 2 | 16 | 262129 | 1474.22 | 732 | 710 | 177.3 |
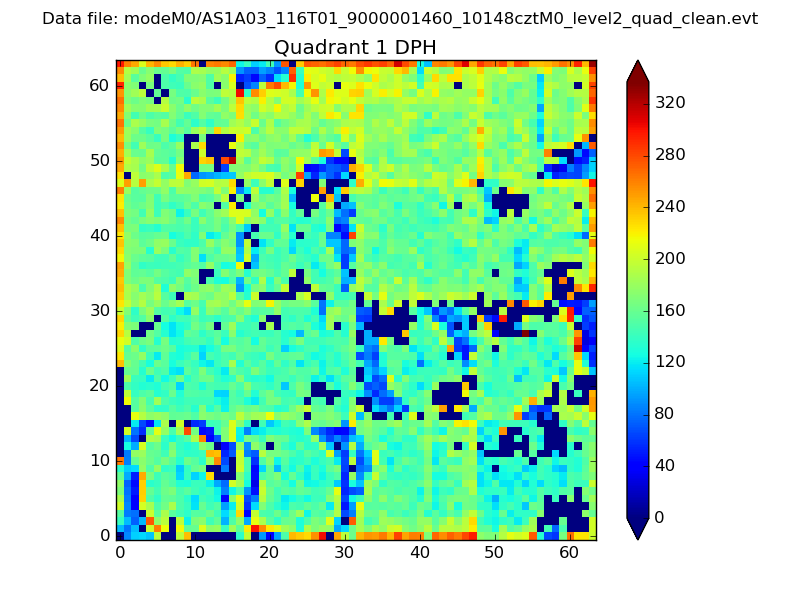
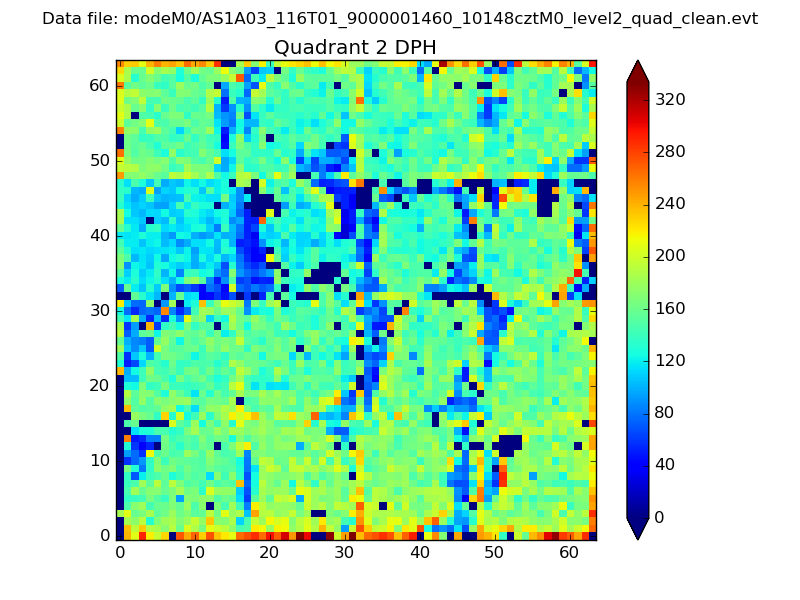
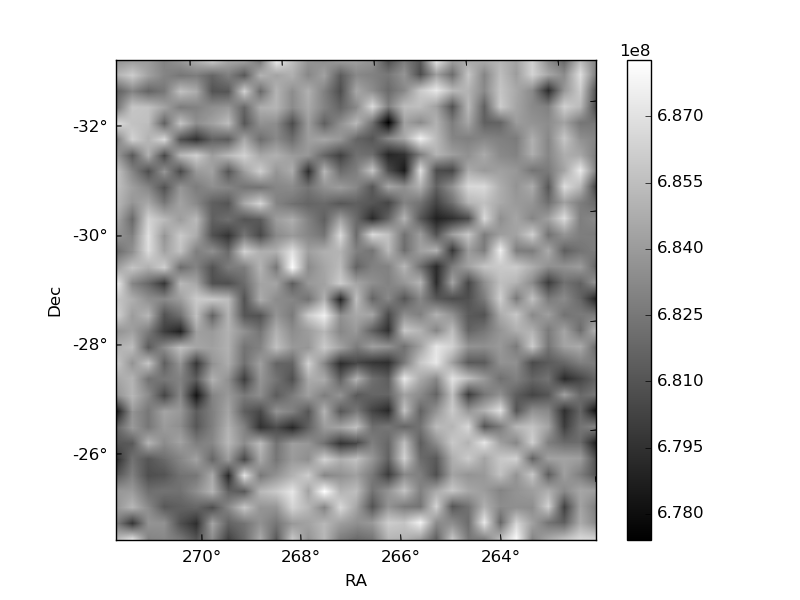
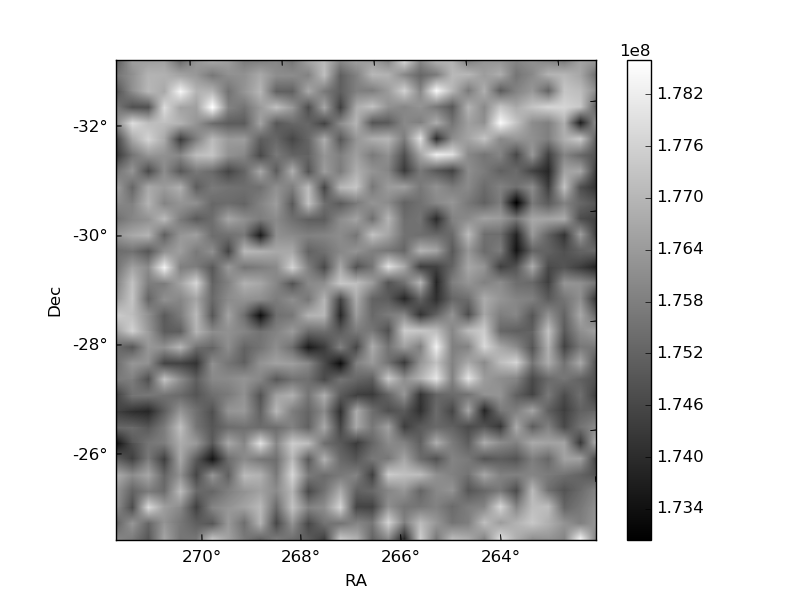
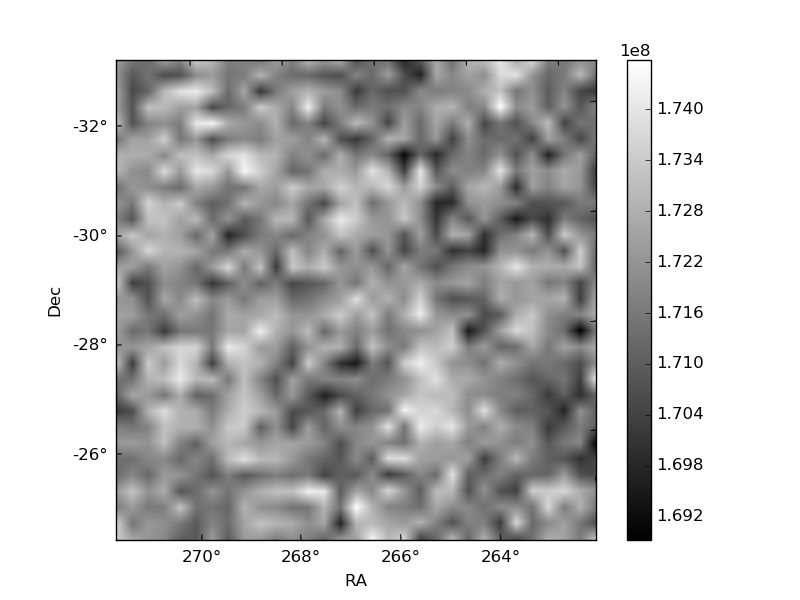
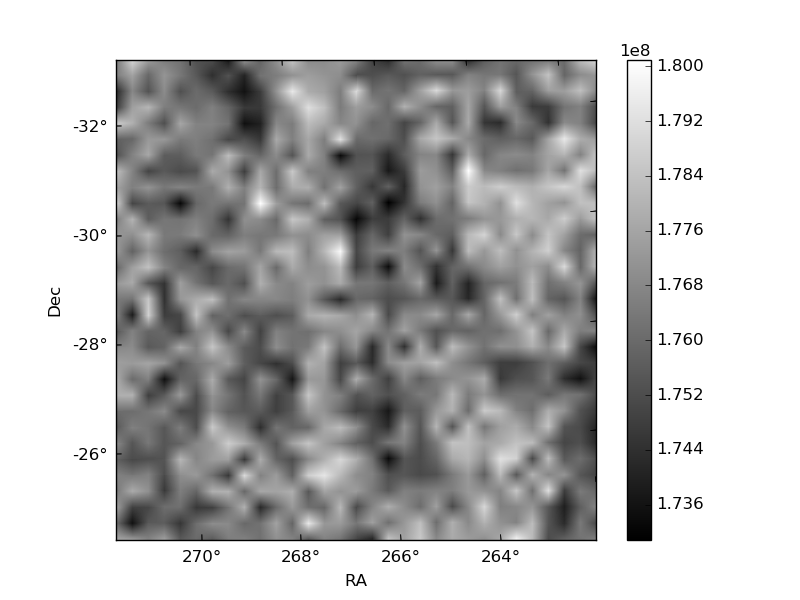
Histogram calculated using DETX and DETY for each event in the final _common_clean file
| Quadrant A | 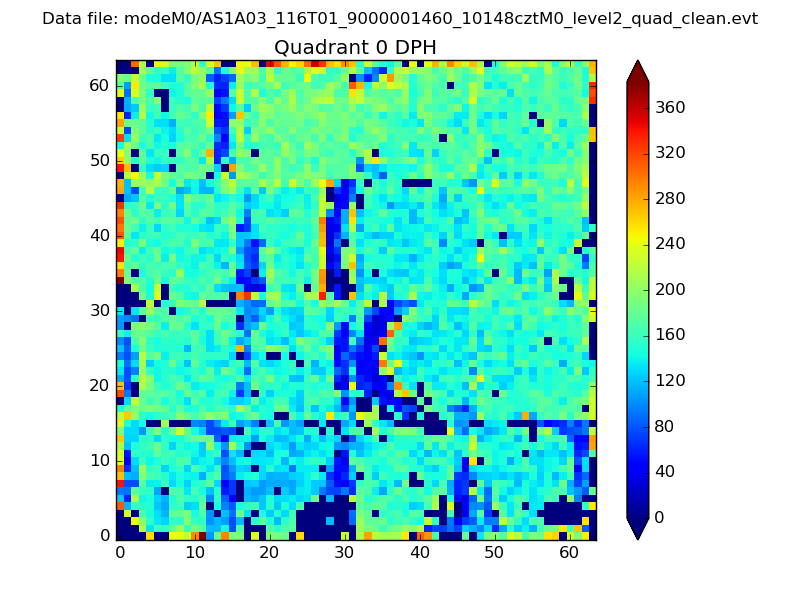 |
 |
Quadrant B |
|---|---|---|---|
| Quadrant D | 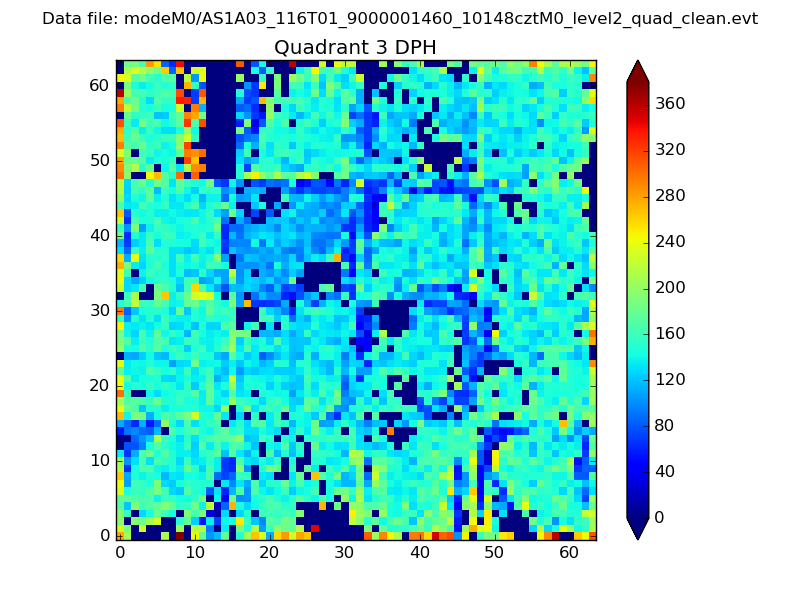 |
 |
Quadrant C |
| Plot type | Count rate plots | Images |
|---|---|---|
| Comparison with Poisson distribution Blue bars denote a histogram of data divided into 1 sec bins. Red curve is a Poisson curve with rate = median count rate of data. |
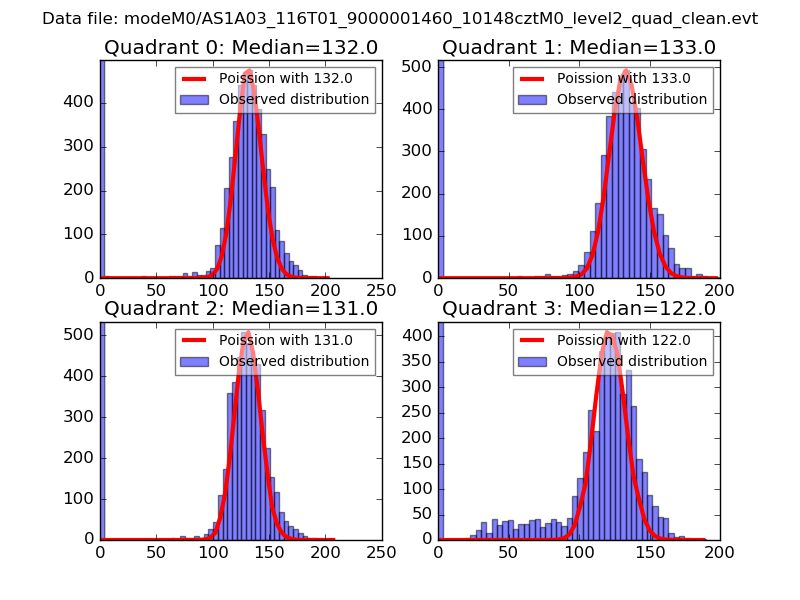 |
 |
| Quadrant-wise count rates Data is divided into 100 sec bins |
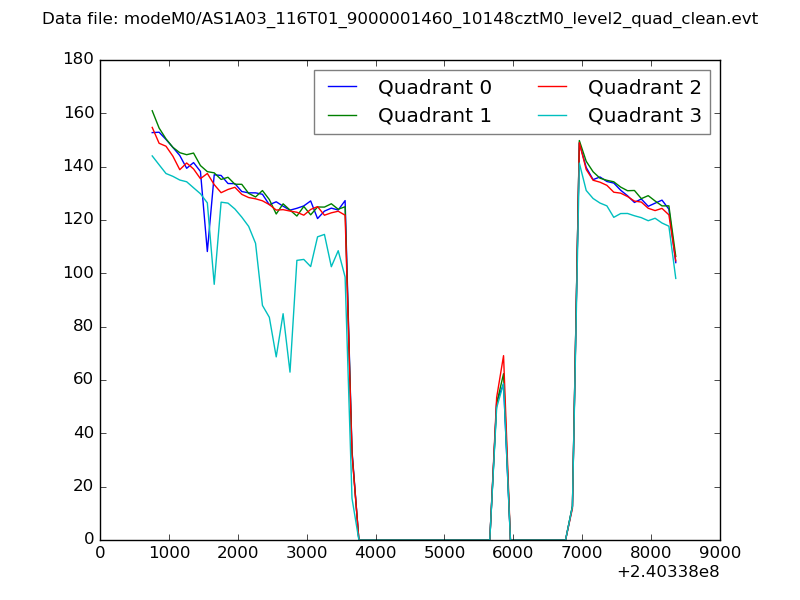 |
|
| Module-wise count rates for Quadrant A Data is divided into 100 sec bins |
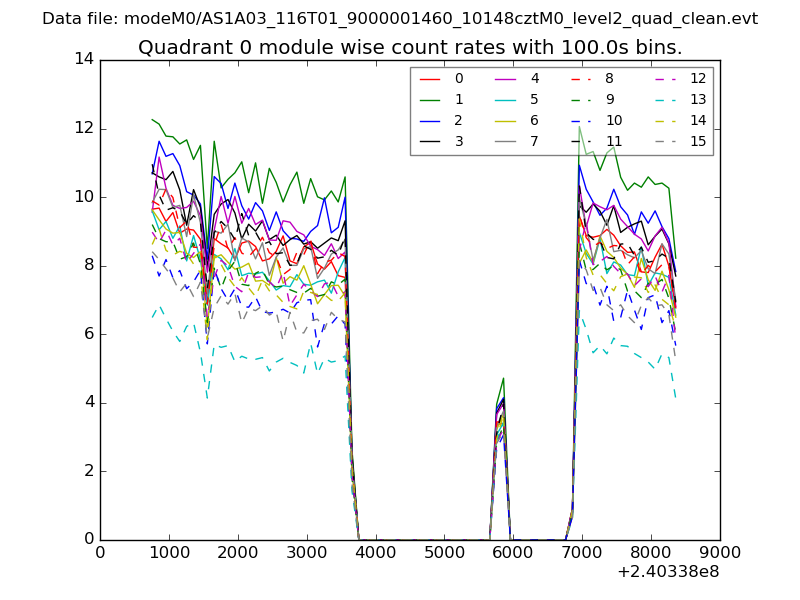 |
 |
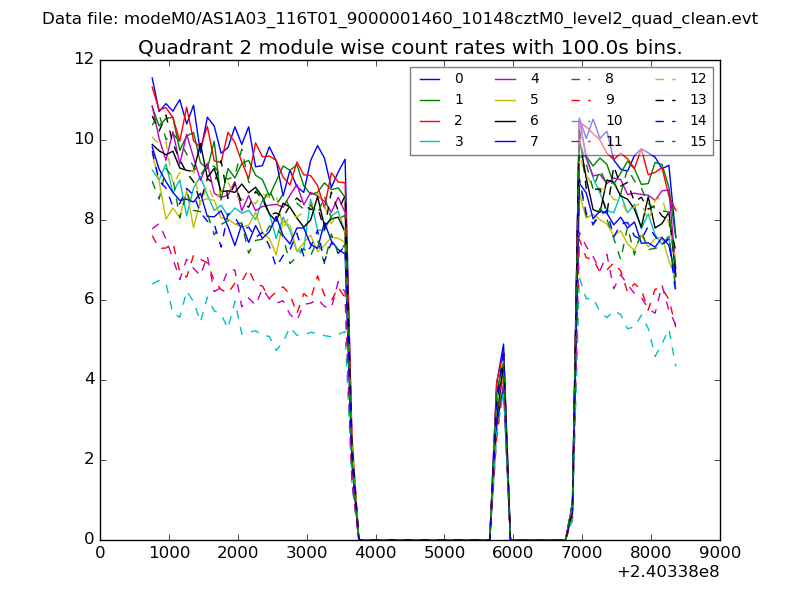
| Module-wise count rates for Quadrant B Data is divided into 100 sec bins |
 |
 |
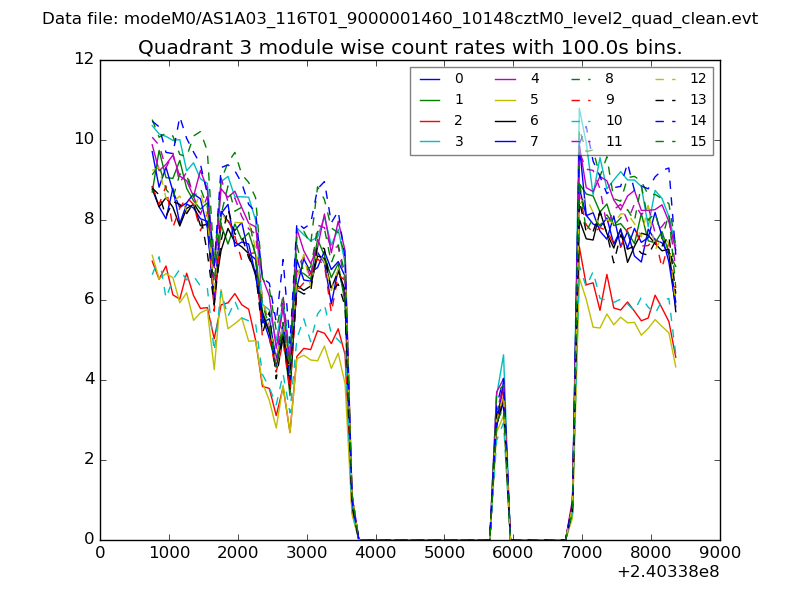
| Module-wise count rates for Quadrant C Data is divided into 100 sec bins |
 |
 |
| Module-wise count rates for Quadrant D Data is divided into 100 sec bins |
 |
 |
| Parameter | Plot |
|---|---|
| CZT HV Monitor | 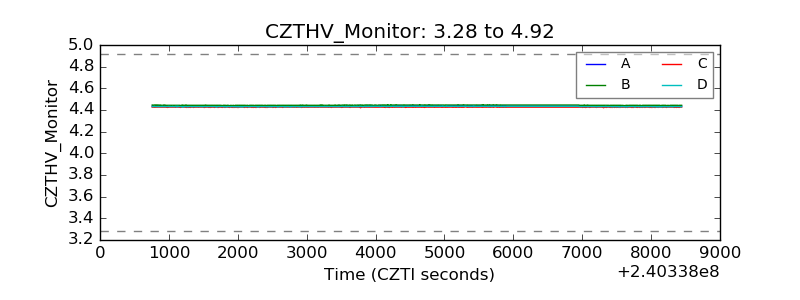 |
| D_VDD | 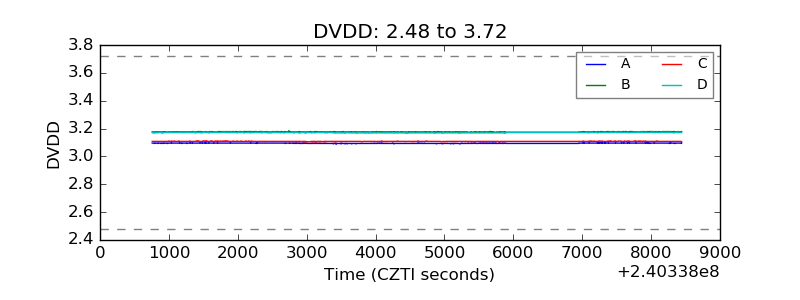 |
| Temperature 1 | 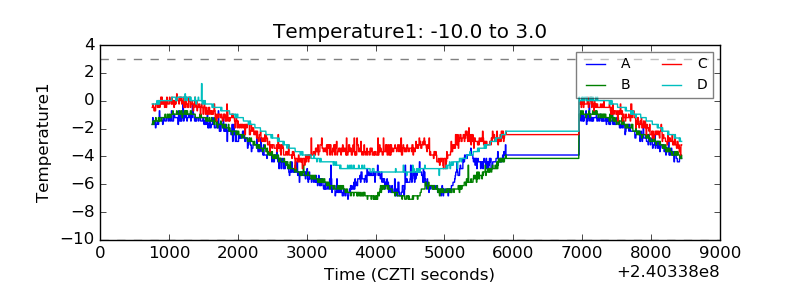 |
| Veto HV Monitor | 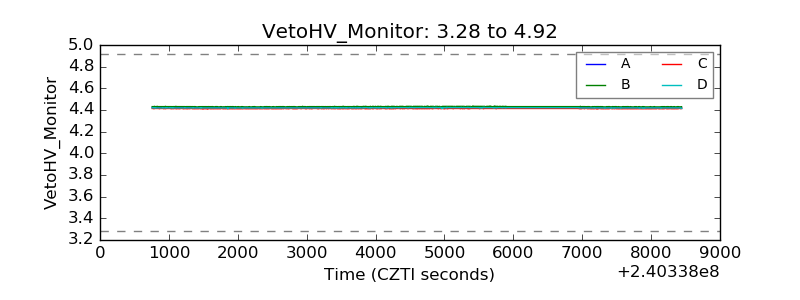 |
| Veto LLD | 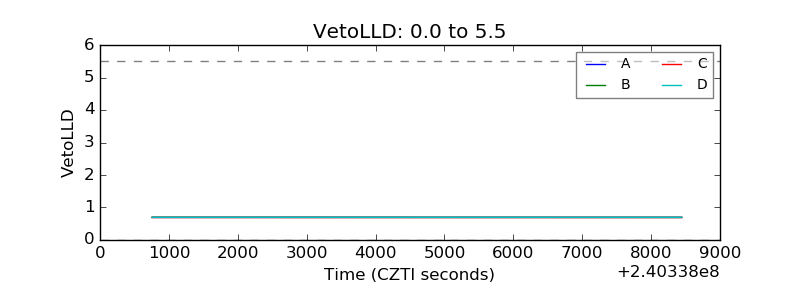 |
| Alpha Counter | 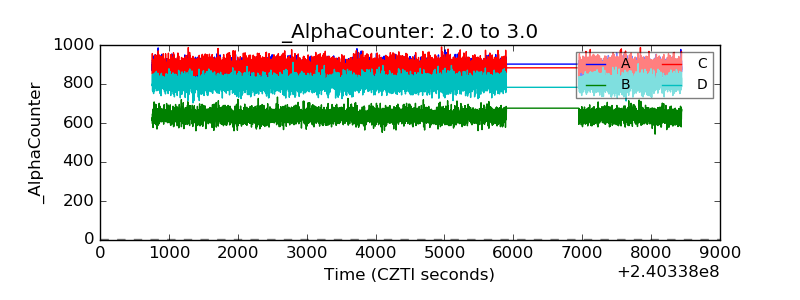 |
| _CPM_Rate | 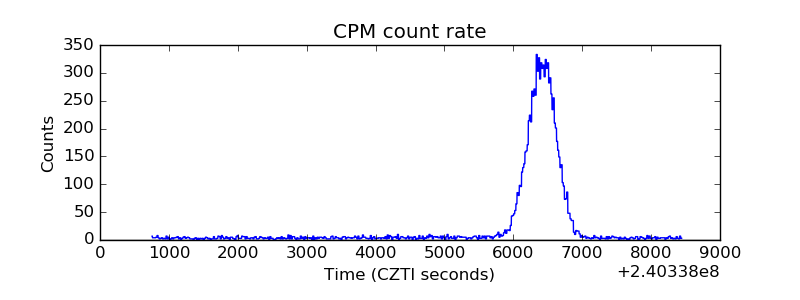 |
| CZT Counter |  |
| +2.5 Volts monitor |  |
| +5 Volts monitor |  |
| _ROLL_ROT | 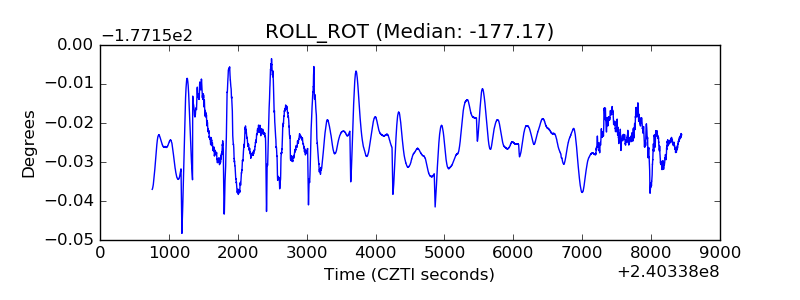 |
| _Roll_DEC | 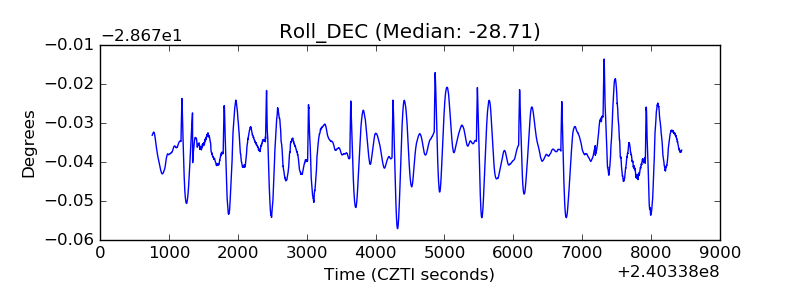 |
| _Roll_RA | 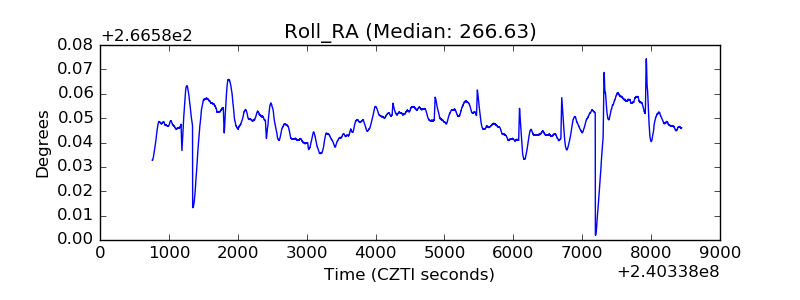 |
| Veto Counter | 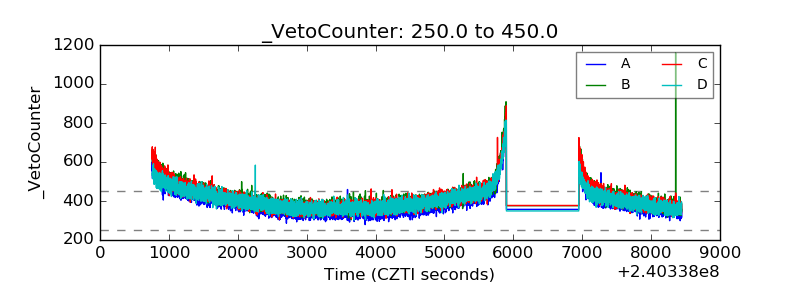 |