| Param | Original file | Final file |
|---|---|---|
| Filename | modeM0/AS1A03_116T01_9000001460_10150cztM0_level2.evt | modeM0/AS1A03_116T01_9000001460_10150cztM0_level2_quad_clean.evt |
| Size (bytes) | 212,129,280 | 34,272,000 |
| Size | 202.3 MB | 32.7 MB |
| Events in quadrant A | 942,927 | 243,285 |
| Events in quadrant B | 978,845 | 245,791 |
| Events in quadrant C | 843,024 | 240,945 |
| Events in quadrant D | 3,525,628 | 165,768 |
| Mode M9 | |||
|---|---|---|---|
| Quadrant | BADHDUFLAG | Total packets | Discarded packets |
| A | 0 | 3 | 0 |
| B | 0 | 3 | 0 |
| C | 0 | 3 | 0 |
| D | 0 | 4 | 0 |
| Mode SS | |||
|---|---|---|---|
| Quadrant | BADHDUFLAG | Total packets | Discarded packets |
| A | 0 | 38 | 0 |
| B | 0 | 38 | 0 |
| C | 0 | 38 | 0 |
| D | 0 | 38 | 0 |
| Mode M0 | |||
|---|---|---|---|
| Quadrant | BADHDUFLAG | Total packets | Discarded packets |
| A | 0 | 4079 | 7 |
| B | 0 | 4211 | 8 |
| C | 0 | 3976 | 5 |
| D | 0 | 11834 | 38 |
| Quadrant | Total seconds | Saturated seconds | Saturation percentage |
|---|---|---|---|
| A | 1943 | 9 | 0.463201% |
| B | 1943 | 21 | 1.080803% |
| C | 1943 | 5 | 0.257334% |
| D | 1939 | 980 | 50.541516% |
Noise dominated data is calculated using 1-second bins in cleaned event files. If a bin has >2000 counts, and if more than 50% of those come from <1% of pixels, then it is considered to be noise-dominated and hence unusable.
| Quadrant | # 1 sec bins | Bins with >0 counts | Bins with >2000 counts | High rate bins dominated by noise | Noise dominated (total time) | Noise dominated (detector-on time) | Marked lightcurve |
|---|---|---|---|---|---|---|---|
| A | 1945 | 1945 | 1 | 1 | 0.05% | 0.05% |  |
| B | 1945 | 1945 | 8 | 8 | 0.41% | 0.41% |  |
| C | 1945 | 1945 | 0 | 0 | 0.00% | 0.00% |  |
| D | 1944 | 1941 | 977 | 977 | 50.26% | 50.33% |  |
Top three noisy pixels from each quadrant. If the there are fewer than three noisy pixels in the level2.evt file, extra rows are filled as -1
| Pixel properties | Quadrant properties | ||||||
|---|---|---|---|---|---|---|---|
| Quadrant | DetID | PixID | Counts | Sigma | Mean | Median | Sigma |
| A | 8 | 15 | 66333 | 1370.88 | 224 | 219 | 48.2 |
| A | 15 | 174 | 5616 | 111.91 | 224 | 219 | 48.2 |
| A | 15 | 223 | 4618 | 91.21 | 224 | 219 | 48.2 |
| B | 4 | 239 | 60603 | 1322.34 | 225 | 220 | 45.7 |
| B | 0 | 219 | 15606 | 336.94 | 225 | 220 | 45.7 |
| B | 0 | 198 | 10463 | 224.31 | 225 | 220 | 45.7 |
| C | 14 | 234 | 4258 | 78.02 | 212 | 214 | 51.8 |
| C | 8 | 128 | 3593 | 65.19 | 212 | 214 | 51.8 |
| C | 8 | 112 | 2227 | 38.84 | 212 | 214 | 51.8 |
| D | 1 | 52 | 2651625 | 63114.12 | 165 | 160 | 42.0 |
| D | 8 | 195 | 120066 | 2854.18 | 165 | 160 | 42.0 |
| D | 2 | 16 | 45742 | 1085.01 | 165 | 160 | 42.0 |
Histogram calculated using DETX and DETY for each event in the final _common_clean file
| Quadrant A |  |
 |
Quadrant B |
|---|---|---|---|
| Quadrant D |  |
 |
Quadrant C |
| Plot type | Count rate plots | Images |
|---|---|---|
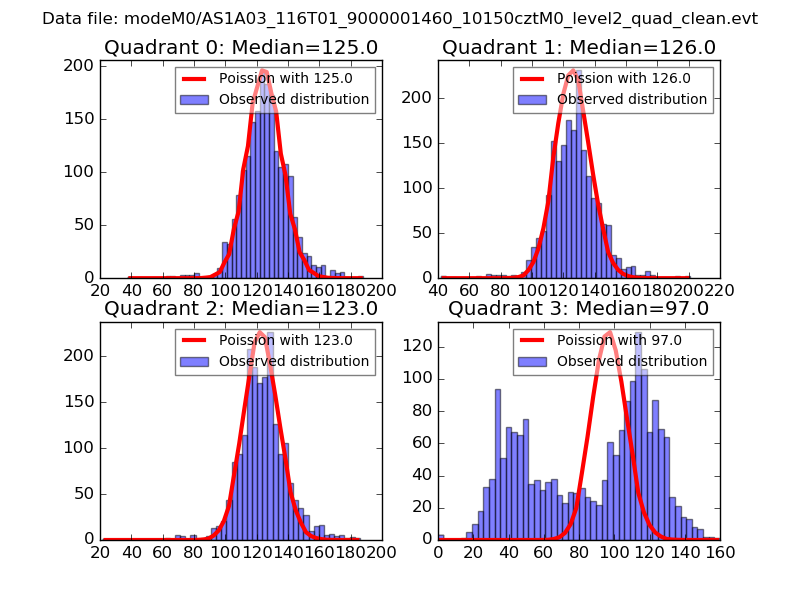
| Comparison with Poisson distribution Blue bars denote a histogram of data divided into 1 sec bins. Red curve is a Poisson curve with rate = median count rate of data. |
 |
 |
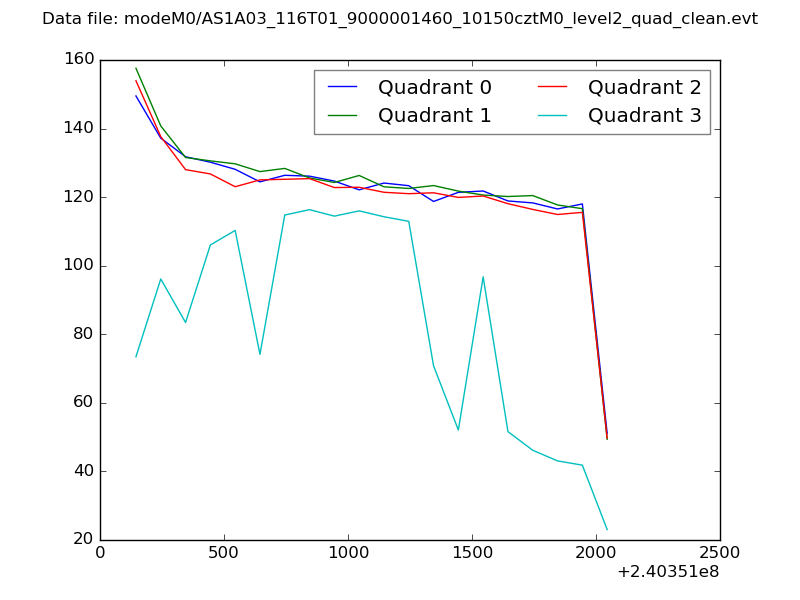
| Quadrant-wise count rates Data is divided into 100 sec bins |
 |
|
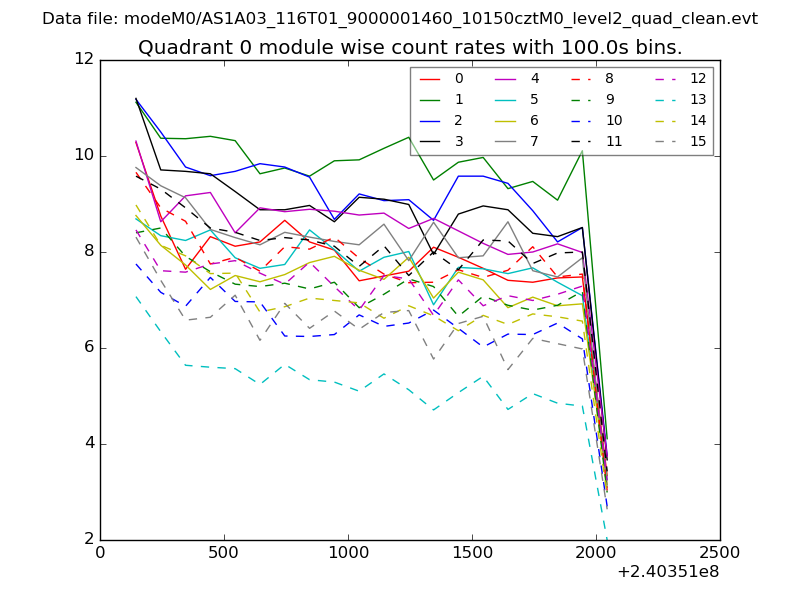
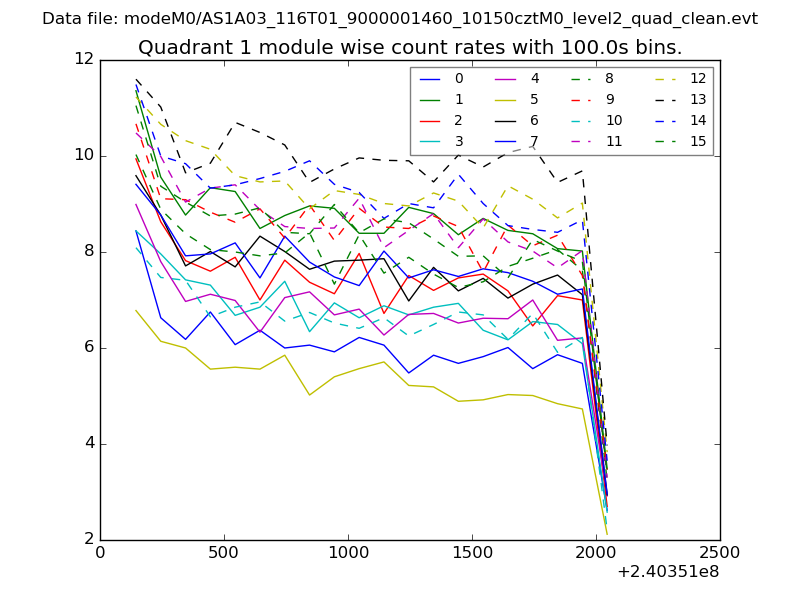
| Module-wise count rates for Quadrant A Data is divided into 100 sec bins |
 |
 |
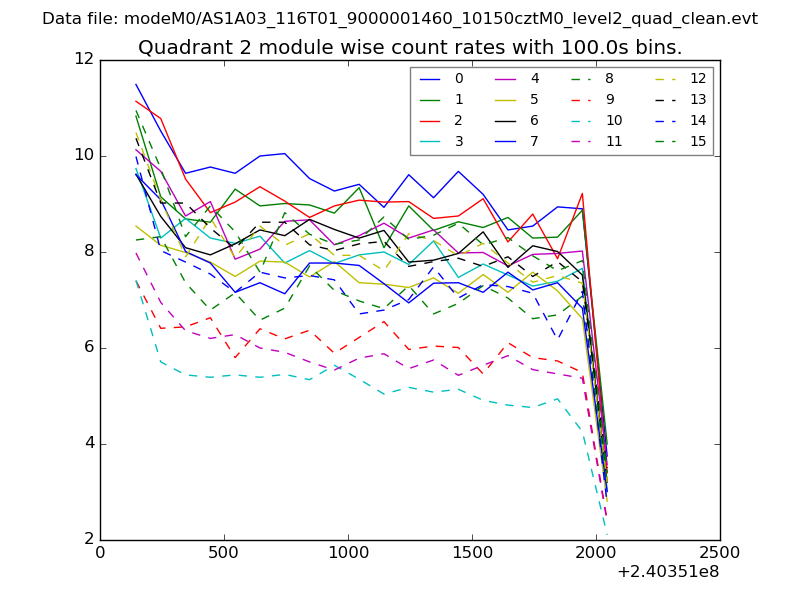
| Module-wise count rates for Quadrant B Data is divided into 100 sec bins |
 |
 |
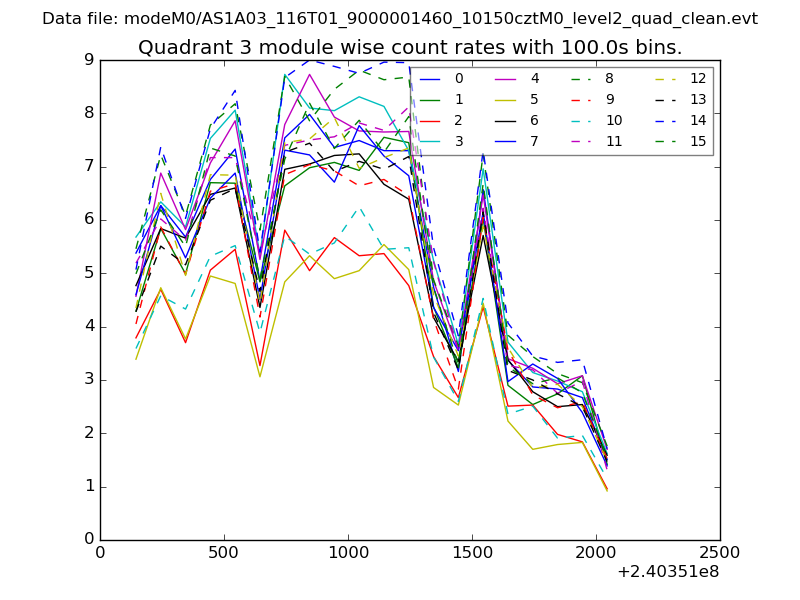
| Module-wise count rates for Quadrant C Data is divided into 100 sec bins |
 |
 |
| Module-wise count rates for Quadrant D Data is divided into 100 sec bins |
 |
 |
| Parameter | Plot |
|---|---|
| CZT HV Monitor | 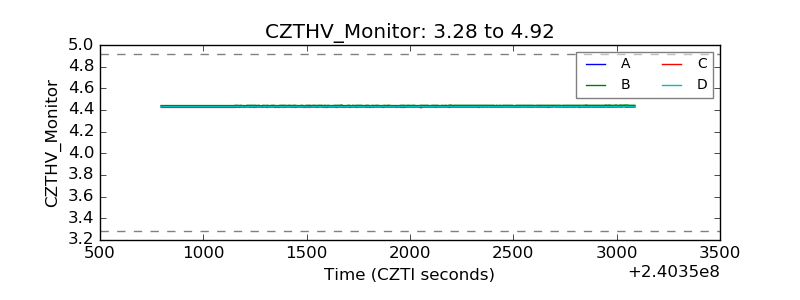 |
| D_VDD | 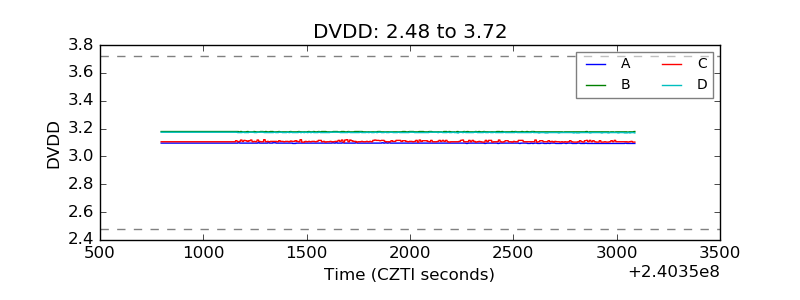 |
| Temperature 1 | 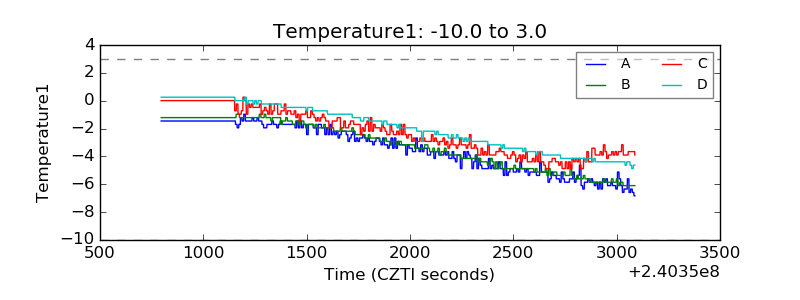 |
| Veto HV Monitor | 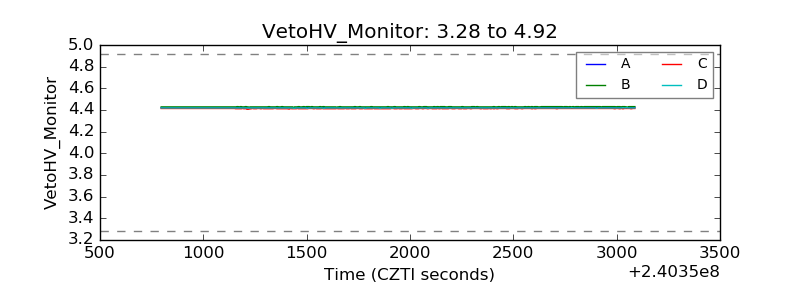 |
| Veto LLD | 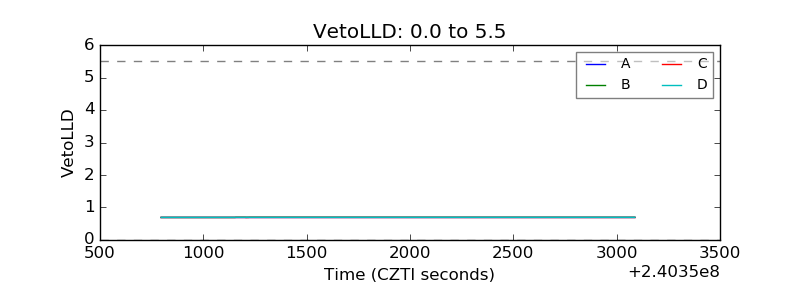 |
| Alpha Counter | 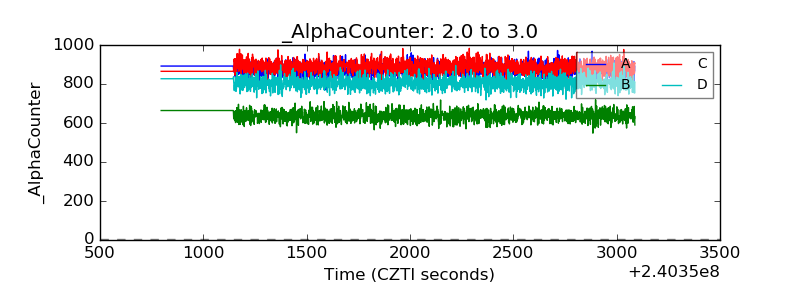 |
| _CPM_Rate | 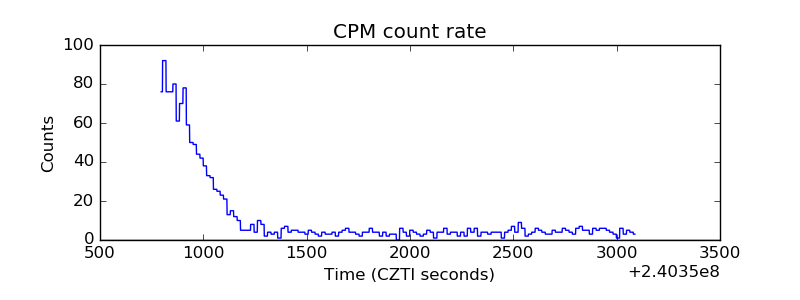 |
| CZT Counter |  |
| +2.5 Volts monitor |  |
| +5 Volts monitor |  |
| _ROLL_ROT |  |
| _Roll_DEC | 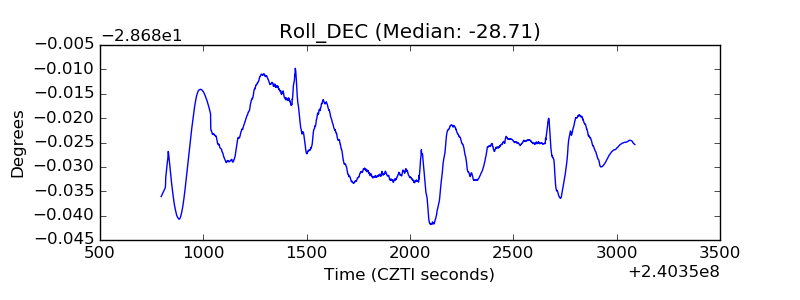 |
| _Roll_RA |  |
| Veto Counter | 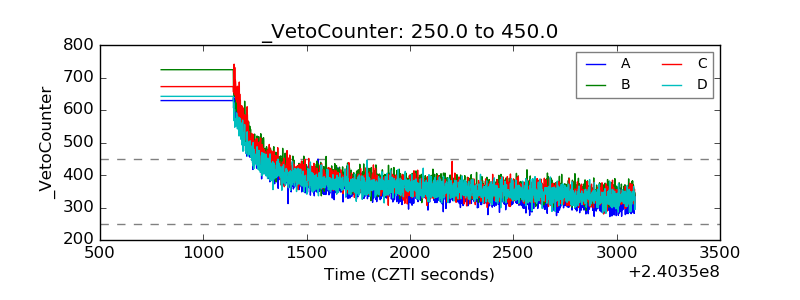 |