| Param | Original file | Final file |
|---|---|---|
| Filename | modeM0/AS1A03_039T01_9000001462cztM0_level2.fits | modeM0/AS1A03_039T01_9000001462cztM0_level2_quad_clean.evt |
| Size (bytes) | 632,724,480 | 657,987,840 |
| Size | 603.4 MB | 627.5 MB |
| Events in quadrant A | 3,963,738 | 4,223,153 |
| Events in quadrant B | 3,826,182 | 4,249,873 |
| Events in quadrant C | 3,904,942 | 4,156,891 |
| Events in quadrant D | 2,661,262 | 2,504,359 |
| Mode SS | |||
|---|---|---|---|
| Quadrant | BADHDUFLAG | Total packets | Discarded packets |
| A | 0 | 1418 | 0 |
| B | 0 | 1418 | 0 |
| C | 0 | 1420 | 0 |
| D | 0 | 1420 | 0 |
| Mode M0 | |||
|---|---|---|---|
| Quadrant | BADHDUFLAG | Total packets | Discarded packets |
| A | 0 | 152098 | 0 |
| B | 0 | 154540 | 0 |
| C | 0 | 143424 | 0 |
| D | 0 | 334723 | 0 |
| Mode M9 | |||
|---|---|---|---|
| Quadrant | BADHDUFLAG | Total packets | Discarded packets |
| A | 0 | 117 | 0 |
| B | 0 | 117 | 0 |
| C | 0 | 117 | 0 |
| D | 0 | 117 | 0 |
| Quadrant | Total seconds | Saturated seconds | Saturation percentage |
|---|---|---|---|
| A | 69931 | 1355 | 1.937624% |
| B | 69938 | 1037 | 1.482742% |
| C | 69938 | 483 | 0.690612% |
| D | 69844 | 26376 | 37.764160% |
Noise dominated data is calculated using 1-second bins in cleaned event files. If a bin has >2000 counts, and if more than 50% of those come from <1% of pixels, then it is considered to be noise-dominated and hence unusable.
| Quadrant | # 1 sec bins | Bins with >0 counts | Bins with >2000 counts | High rate bins dominated by noise | Noise dominated (total time) | Noise dominated (detector-on time) | Marked lightcurve |
|---|---|---|---|---|---|---|---|
| A | 81393 | 69979 | 0 | 0 | 0.00% | 0.00% |  |
| B | 81393 | 69982 | 0 | 0 | 0.00% | 0.00% |  |
| C | 81393 | 69981 | 0 | 0 | 0.00% | 0.00% |  |
| D | 81392 | 69811 | 0 | 0 | 0.00% | 0.00% |  |
Top three noisy pixels from each quadrant. If the there are fewer than three noisy pixels in the level2.evt file, extra rows are filled as -1
| Pixel properties | Quadrant properties | ||||||
|---|---|---|---|---|---|---|---|
| Quadrant | DetID | PixID | Counts | Sigma | Mean | Median | Sigma |
| A | 0 | 29 | 3900 | 11.41 | 1030 | 965 | 257.1 |
| A | 7 | 110 | 3233 | 8.82 | 1030 | 965 | 257.1 |
| A | 0 | 30 | 3050 | 8.11 | 1030 | 965 | 257.1 |
| B | 2 | 9 | 3309 | 11.89 | 1009 | 964 | 197.3 |
| B | 14 | 254 | 2610 | 8.34 | 1009 | 964 | 197.3 |
| B | 5 | 128 | 2602 | 8.3 | 1009 | 964 | 197.3 |
| C | 1 | 80 | 2982 | 7.49 | 1032 | 958 | 270.1 |
| C | 1 | 81 | 2858 | 7.03 | 1032 | 958 | 270.1 |
| C | 12 | 241 | 2759 | 6.67 | 1032 | 958 | 270.1 |
| D | 6 | 231 | 1975 | 6.29 | 760 | 691 | 204.0 |
| D | 3 | 14 | 1956 | 6.2 | 760 | 691 | 204.0 |
| D | 6 | 67 | 1882 | 5.83 | 760 | 691 | 204.0 |
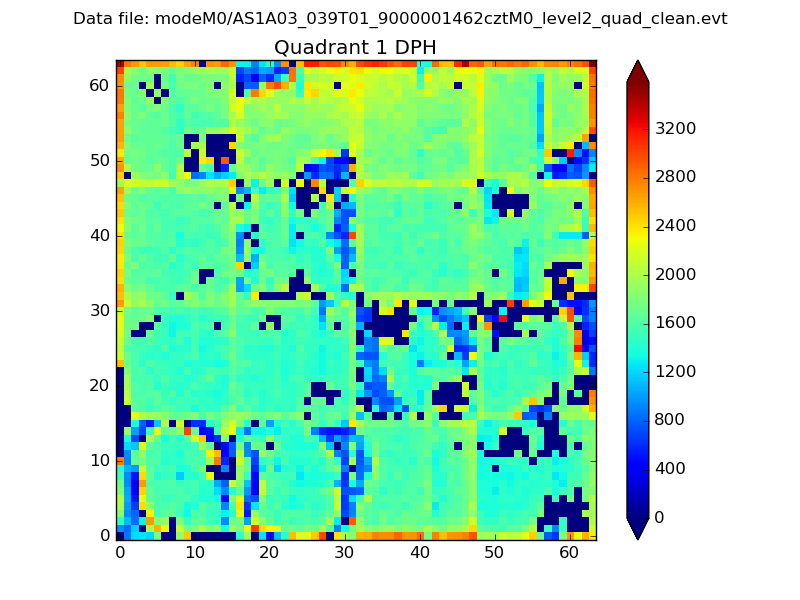
Histogram calculated using DETX and DETY for each event in the final _common_clean file
| Quadrant A |  |
 |
Quadrant B |
|---|---|---|---|
| Quadrant D |  |
 |
Quadrant C |
| Plot type | Count rate plots | Images |
|---|---|---|
| Comparison with Poisson distribution Blue bars denote a histogram of data divided into 1 sec bins. Red curve is a Poisson curve with rate = median count rate of data. |
 |
 |
| Quadrant-wise count rates Data is divided into 100 sec bins |
 |
|
| Module-wise count rates for Quadrant A Data is divided into 100 sec bins |
 |
 |
| Module-wise count rates for Quadrant B Data is divided into 100 sec bins |
 |
 |
| Module-wise count rates for Quadrant C Data is divided into 100 sec bins |
 |
 |
| Module-wise count rates for Quadrant D Data is divided into 100 sec bins |
 |
 |
| Parameter | Plot |
|---|---|
| CZT HV Monitor |  |
| D_VDD | 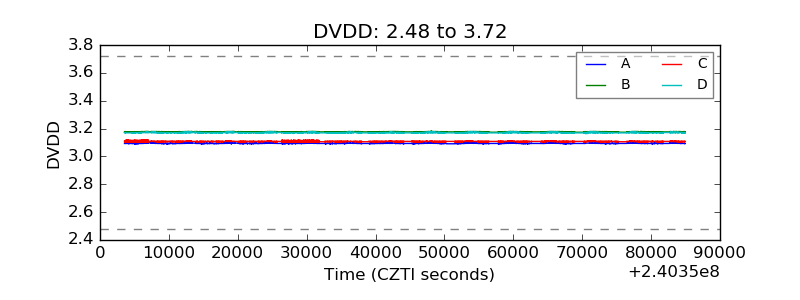 |
| Temperature 1 |  |
| Veto HV Monitor |  |
| Veto LLD |  |
| Alpha Counter |  |
| _CPM_Rate |  |
| CZT Counter |  |
| +2.5 Volts monitor |  |
| +5 Volts monitor |  |
| _ROLL_ROT |  |
| _Roll_DEC |  |
| _Roll_RA |  |
| Veto Counter |  |