| Param | Original file | Final file |
|---|---|---|
| Filename | modeM0/AS1A03_039T01_9000001462_10150cztM0_level2.evt | modeM0/AS1A03_039T01_9000001462_10150cztM0_level2_quad_clean.evt |
| Size (bytes) | 548,599,680 | 60,137,280 |
| Size | 523.2 MB | 57.4 MB |
| Events in quadrant A | 2,393,503 | 394,964 |
| Events in quadrant B | 2,491,693 | 399,608 |
| Events in quadrant C | 2,237,770 | 401,359 |
| Events in quadrant D | 9,152,390 | 274,016 |
| Mode SS | |||
|---|---|---|---|
| Quadrant | BADHDUFLAG | Total packets | Discarded packets |
| A | 0 | 102 | 2 |
| B | 0 | 102 | 0 |
| C | 0 | 102 | 0 |
| D | 0 | 102 | 0 |
| Mode M0 | |||
|---|---|---|---|
| Quadrant | BADHDUFLAG | Total packets | Discarded packets |
| A | 0 | 10433 | 14 |
| B | 0 | 10708 | 3 |
| C | 0 | 10180 | 3 |
| D | 0 | 30609 | 45 |
| Mode M9 | |||
|---|---|---|---|
| Quadrant | BADHDUFLAG | Total packets | Discarded packets |
| A | 0 | 3 | 0 |
| B | 0 | 3 | 0 |
| C | 0 | 3 | 0 |
| D | 0 | 3 | 0 |
| Quadrant | Total seconds | Saturated seconds | Saturation percentage |
|---|---|---|---|
| A | 4990 | 21 | 0.420842% |
| B | 4995 | 53 | 1.061061% |
| C | 4995 | 22 | 0.440440% |
| D | 4990 | 2830 | 56.713427% |
Noise dominated data is calculated using 1-second bins in cleaned event files. If a bin has >2000 counts, and if more than 50% of those come from <1% of pixels, then it is considered to be noise-dominated and hence unusable.
| Quadrant | # 1 sec bins | Bins with >0 counts | Bins with >2000 counts | High rate bins dominated by noise | Noise dominated (total time) | Noise dominated (detector-on time) | Marked lightcurve |
|---|---|---|---|---|---|---|---|
| A | 5326 | 4998 | 4 | 4 | 0.08% | 0.08% | 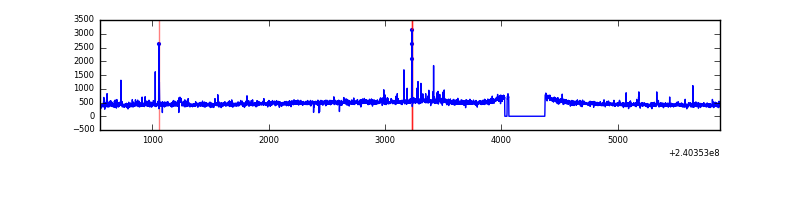 |
| B | 5326 | 4998 | 9 | 9 | 0.17% | 0.18% | 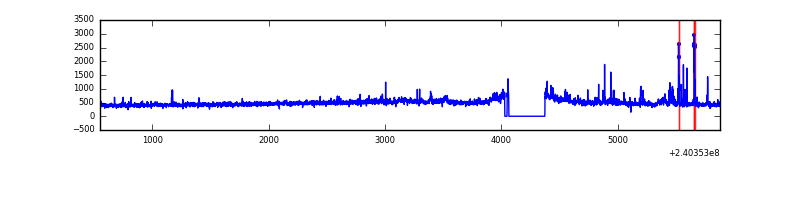 |
| C | 5326 | 4998 | 0 | 0 | 0.00% | 0.00% | 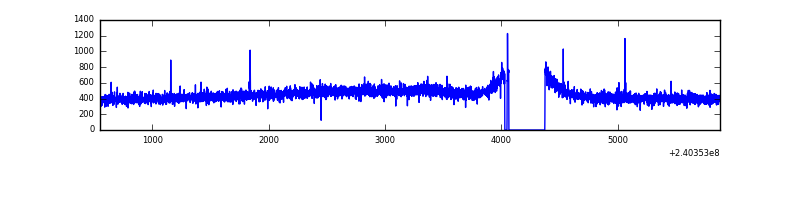 |
| D | 5325 | 4994 | 2654 | 2654 | 49.84% | 53.14% | 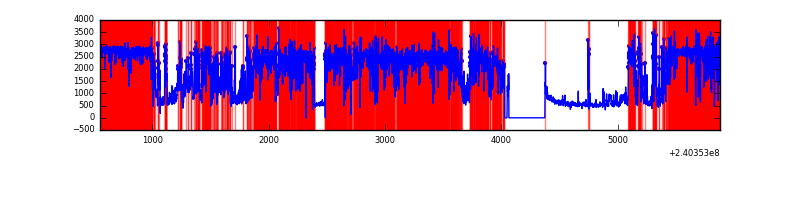 |
Top three noisy pixels from each quadrant. If the there are fewer than three noisy pixels in the level2.evt file, extra rows are filled as -1
| Pixel properties | Quadrant properties | ||||||
|---|---|---|---|---|---|---|---|
| Quadrant | DetID | PixID | Counts | Sigma | Mean | Median | Sigma |
| A | 8 | 15 | 86736 | 715.0 | 586 | 572 | 120.5 |
| A | 15 | 223 | 29843 | 242.89 | 586 | 572 | 120.5 |
| A | 15 | 239 | 7328 | 56.06 | 586 | 572 | 120.5 |
| B | 4 | 239 | 79371 | 699.95 | 587 | 569 | 112.6 |
| B | 0 | 219 | 70998 | 625.58 | 587 | 569 | 112.6 |
| B | 0 | 214 | 16849 | 144.61 | 587 | 569 | 112.6 |
| C | 8 | 128 | 6275 | 43.13 | 569 | 571 | 132.3 |
| C | 13 | 61 | 4359 | 28.64 | 569 | 571 | 132.3 |
| C | 8 | 112 | 3757 | 24.09 | 569 | 571 | 132.3 |
| D | 1 | 52 | 6931589 | 64095.86 | 441 | 426 | 108.1 |
| D | 8 | 195 | 331201 | 3058.84 | 441 | 426 | 108.1 |
| D | 2 | 136 | 69108 | 635.14 | 441 | 426 | 108.1 |
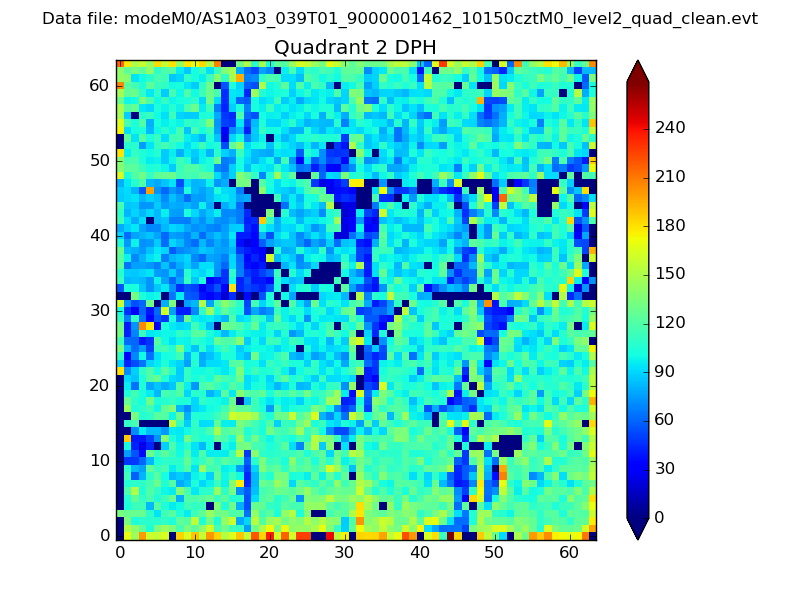
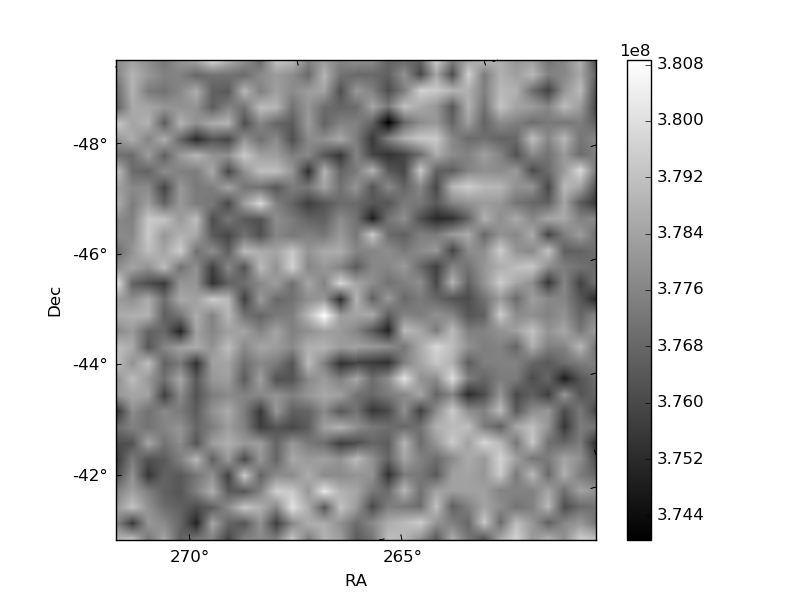
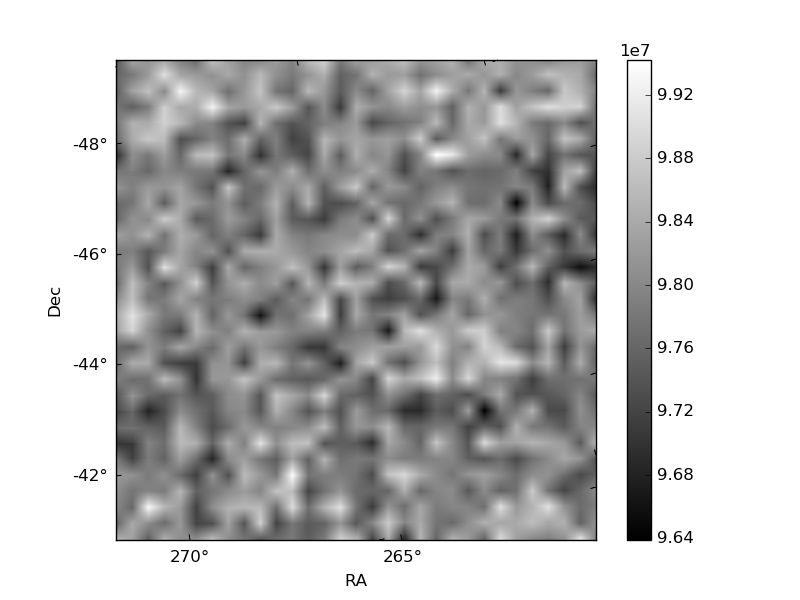
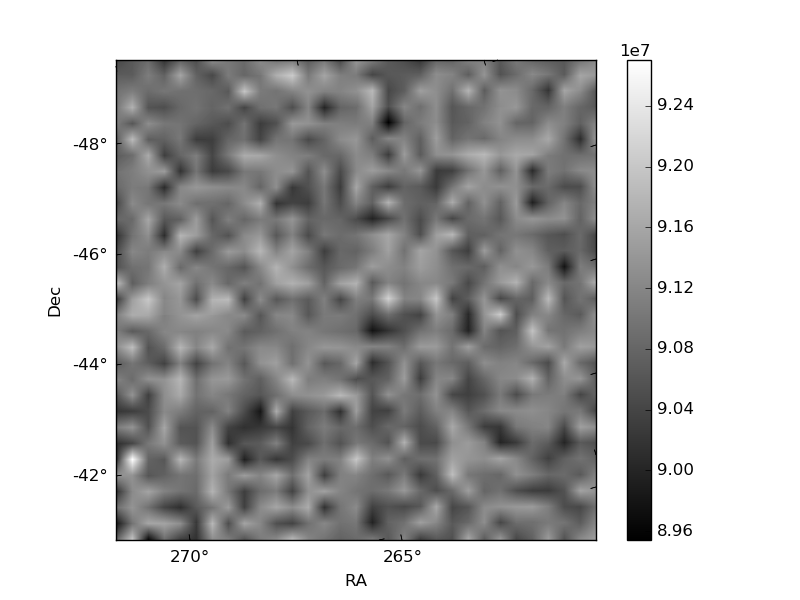
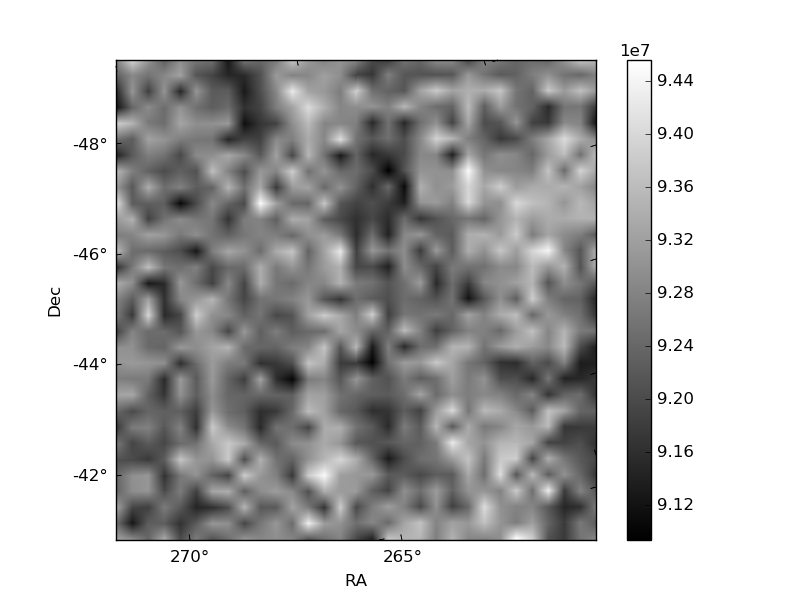
Histogram calculated using DETX and DETY for each event in the final _common_clean file
| Quadrant A | 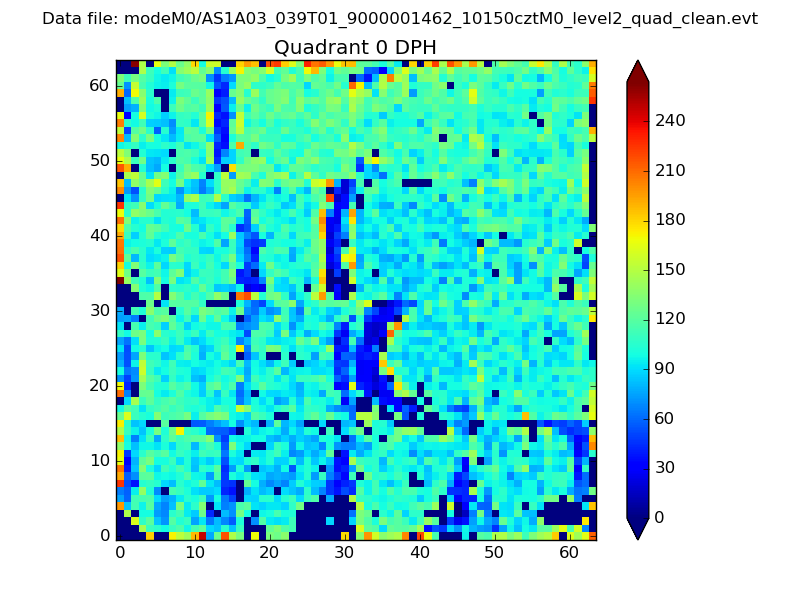 |
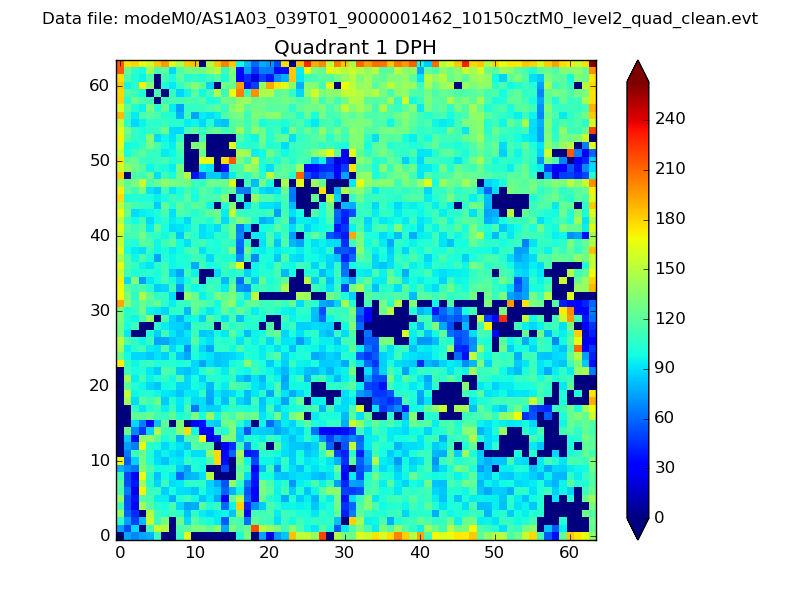 |
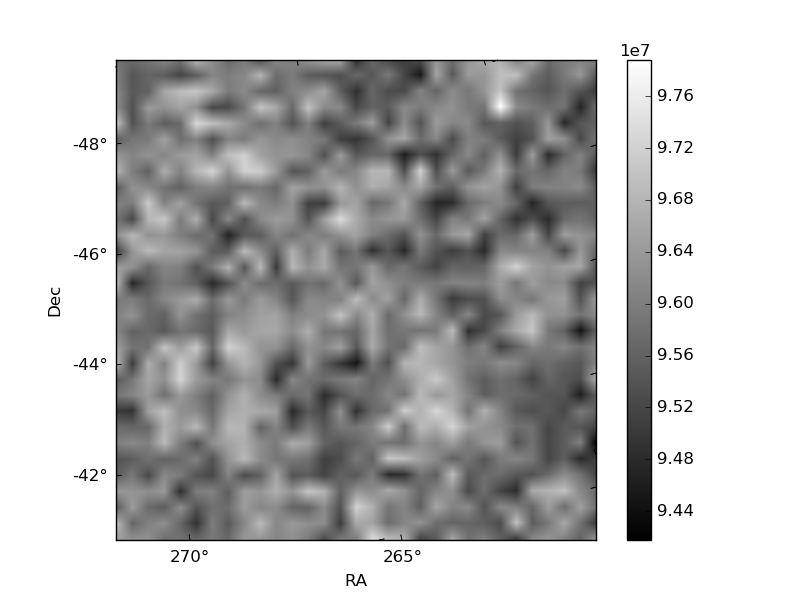
Quadrant B |
|---|---|---|---|
| Quadrant D | 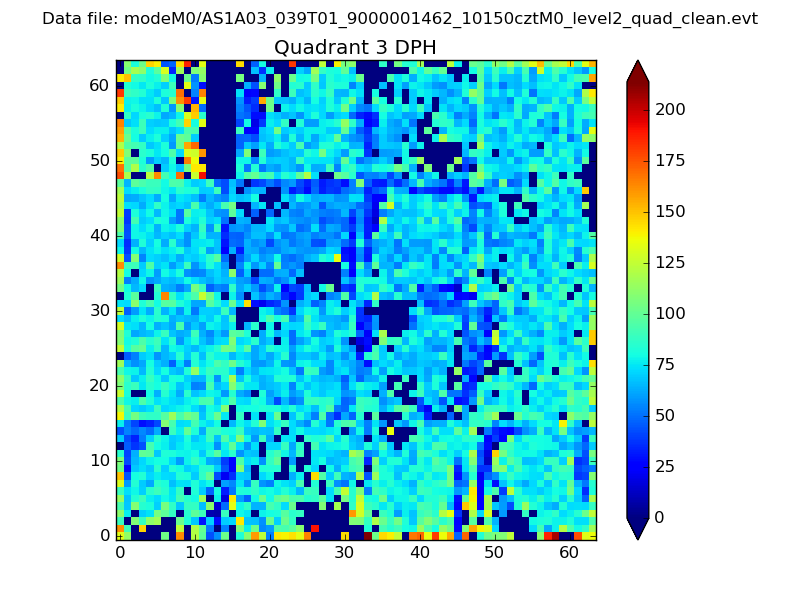 |
 |
Quadrant C |
| Plot type | Count rate plots | Images |
|---|---|---|
| Comparison with Poisson distribution Blue bars denote a histogram of data divided into 1 sec bins. Red curve is a Poisson curve with rate = median count rate of data. |
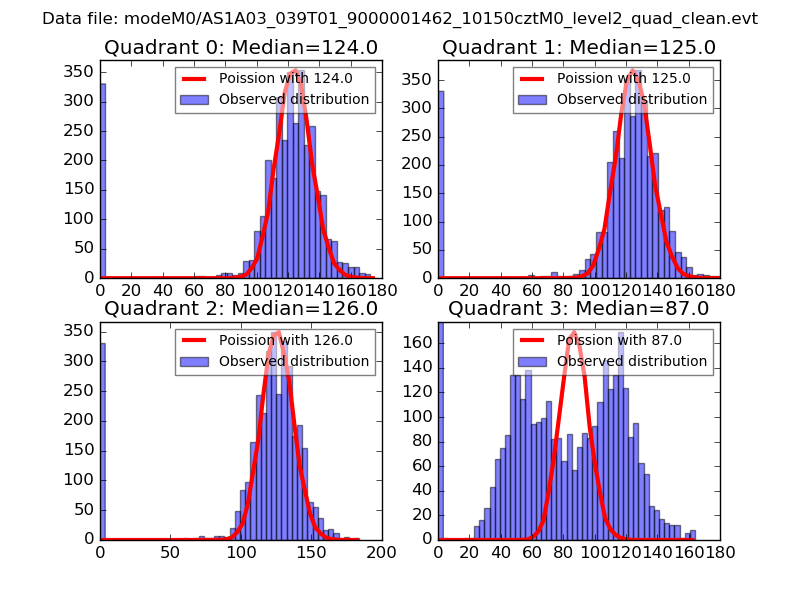 |
 |
| Quadrant-wise count rates Data is divided into 100 sec bins |
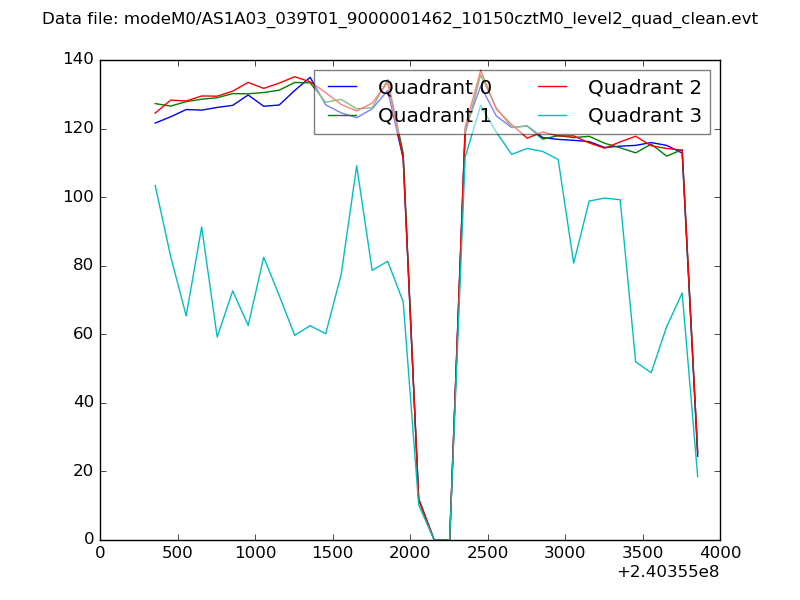 |
|
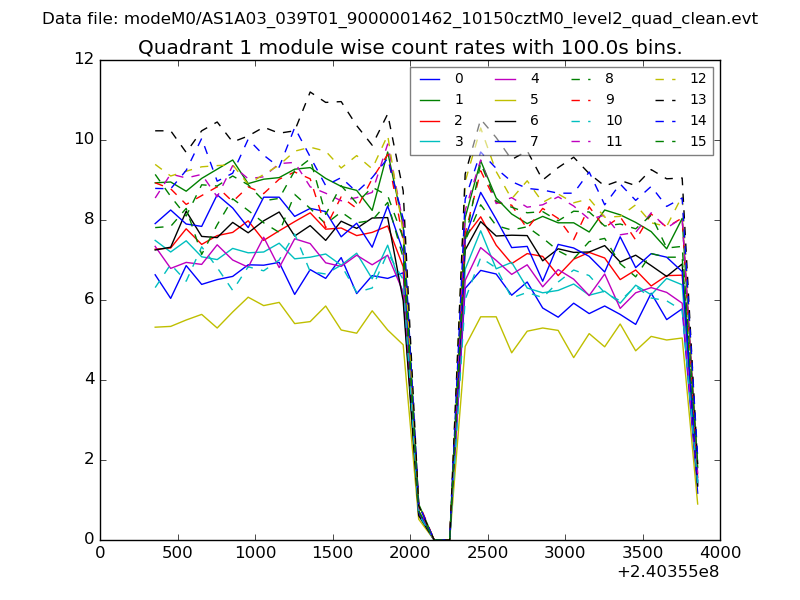
| Module-wise count rates for Quadrant A Data is divided into 100 sec bins |
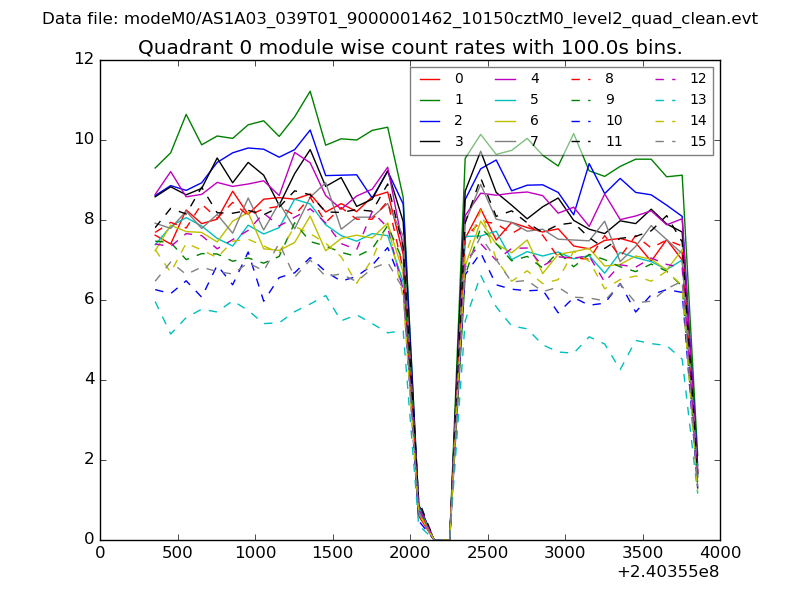 |
 |
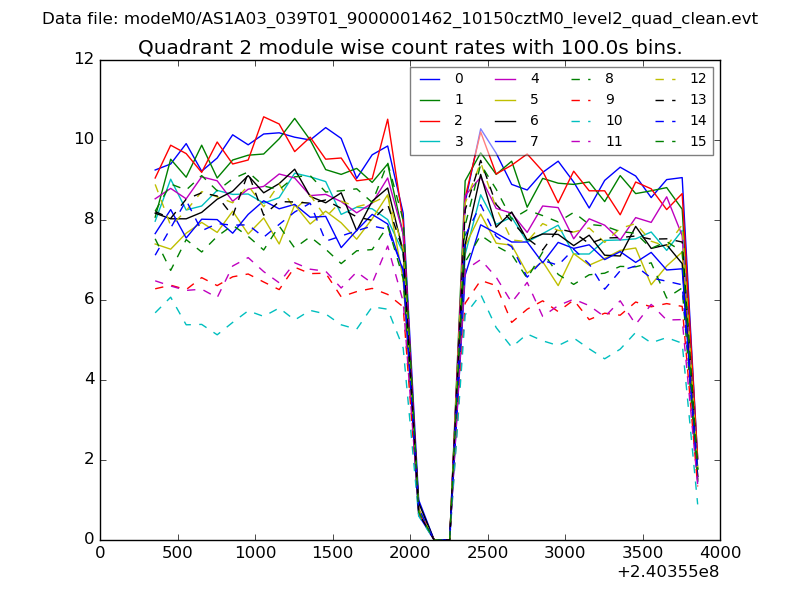
| Module-wise count rates for Quadrant B Data is divided into 100 sec bins |
 |
 |
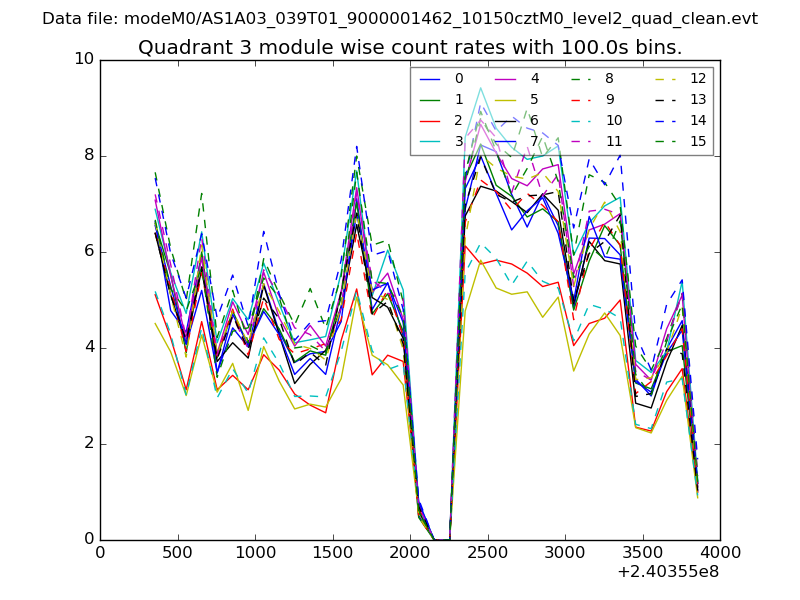
| Module-wise count rates for Quadrant C Data is divided into 100 sec bins |
 |
 |
| Module-wise count rates for Quadrant D Data is divided into 100 sec bins |
 |
 |
| Parameter | Plot |
|---|---|
| CZT HV Monitor | 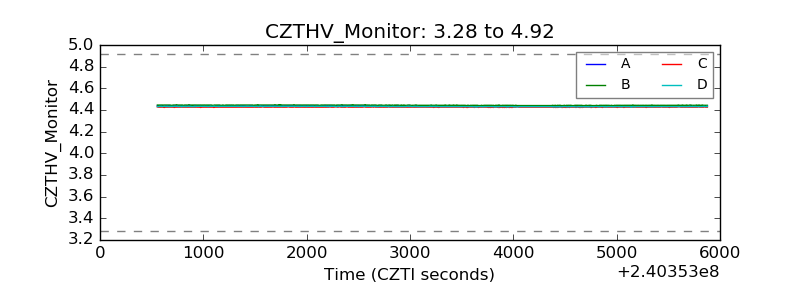 |
| D_VDD | 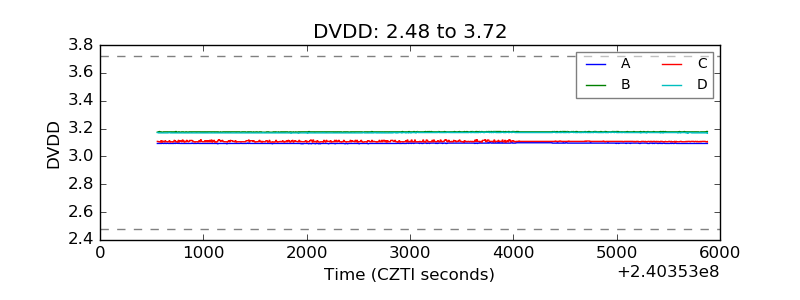 |
| Temperature 1 | 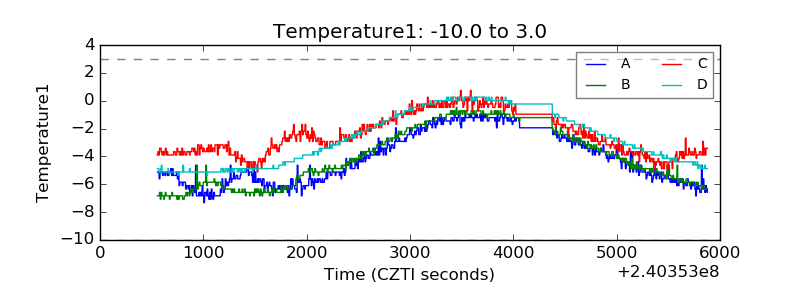 |
| Veto HV Monitor | 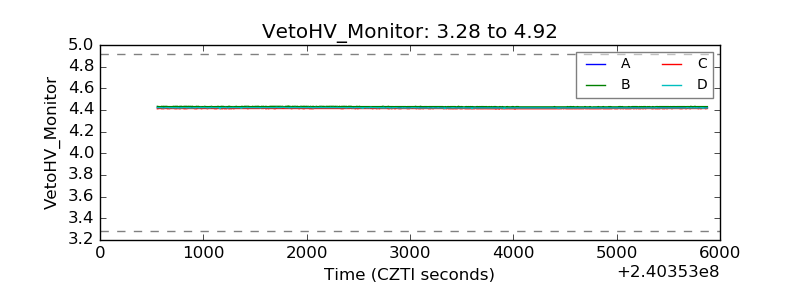 |
| Veto LLD | 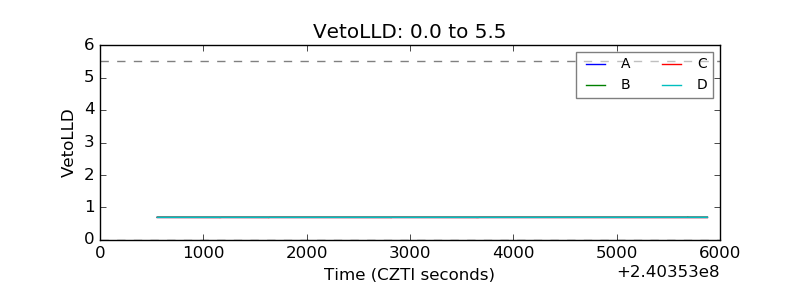 |
| Alpha Counter | 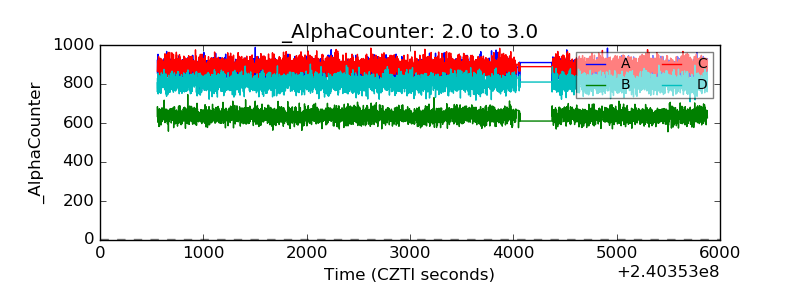 |
| _CPM_Rate | 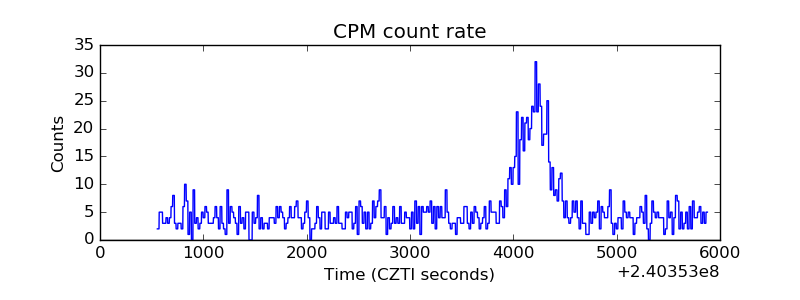 |
| CZT Counter | 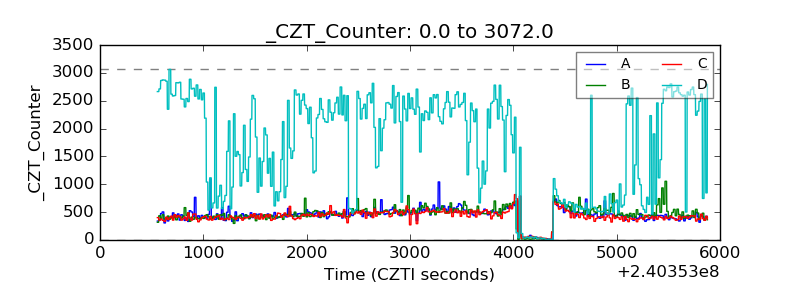 |
| +2.5 Volts monitor |  |
| +5 Volts monitor |  |
| _ROLL_ROT | 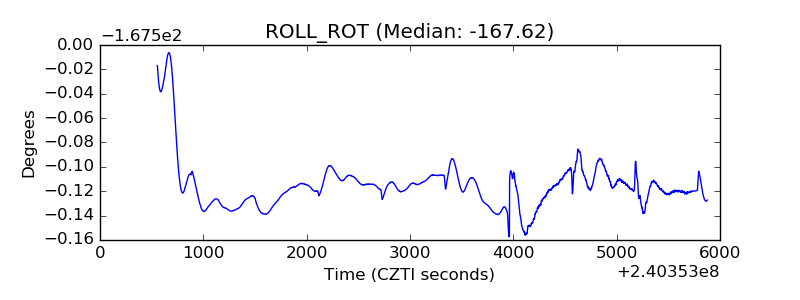 |
| _Roll_DEC | 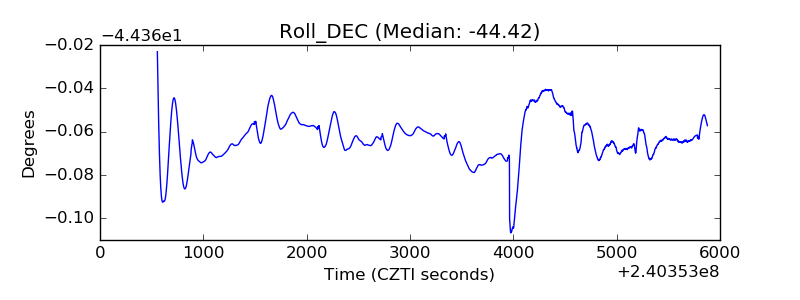 |
| _Roll_RA | 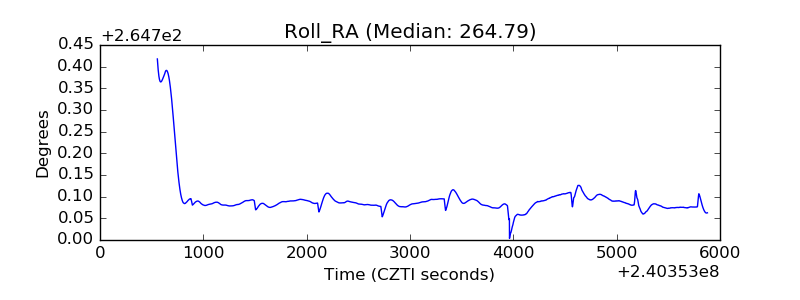 |
| Veto Counter | 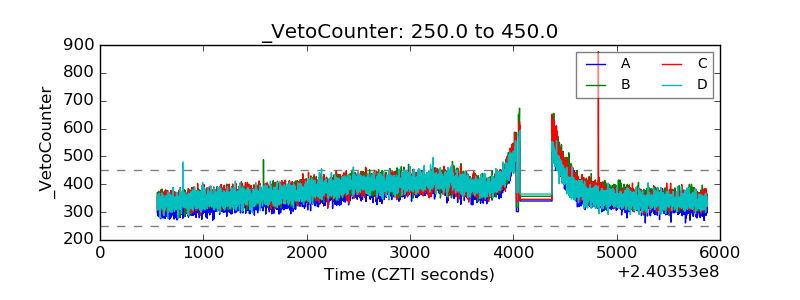 |