| Param | Original file | Final file |
|---|---|---|
| Filename | modeM0/AS1A03_039T01_9000001462_10151cztM0_level2.evt | modeM0/AS1A03_039T01_9000001462_10151cztM0_level2_quad_clean.evt |
| Size (bytes) | 799,882,560 | 99,768,960 |
| Size | 762.8 MB | 95.1 MB |
| Events in quadrant A | 3,463,859 | 670,146 |
| Events in quadrant B | 3,938,260 | 672,512 |
| Events in quadrant C | 3,243,582 | 676,079 |
| Events in quadrant D | 13,071,846 | 480,411 |
| Mode SS | |||
|---|---|---|---|
| Quadrant | BADHDUFLAG | Total packets | Discarded packets |
| A | 0 | 150 | 0 |
| B | 0 | 150 | 0 |
| C | 0 | 150 | 0 |
| D | 0 | 150 | 0 |
| Mode M0 | |||
|---|---|---|---|
| Quadrant | BADHDUFLAG | Total packets | Discarded packets |
| A | 0 | 15609 | 3 |
| B | 0 | 16890 | 2 |
| C | 0 | 15251 | 2 |
| D | 0 | 43959 | 35 |
| Mode M9 | |||
|---|---|---|---|
| Quadrant | BADHDUFLAG | Total packets | Discarded packets |
| A | 0 | 4 | 0 |
| B | 0 | 4 | 0 |
| C | 0 | 4 | 0 |
| D | 0 | 5 | 0 |
| Quadrant | Total seconds | Saturated seconds | Saturation percentage |
|---|---|---|---|
| A | 7497 | 39 | 0.520208% |
| B | 7497 | 122 | 1.627318% |
| C | 7497 | 21 | 0.280112% |
| D | 7492 | 3644 | 48.638548% |
Noise dominated data is calculated using 1-second bins in cleaned event files. If a bin has >2000 counts, and if more than 50% of those come from <1% of pixels, then it is considered to be noise-dominated and hence unusable.
| Quadrant | # 1 sec bins | Bins with >0 counts | Bins with >2000 counts | High rate bins dominated by noise | Noise dominated (total time) | Noise dominated (detector-on time) | Marked lightcurve |
|---|---|---|---|---|---|---|---|
| A | 7812 | 7498 | 2 | 2 | 0.03% | 0.03% | 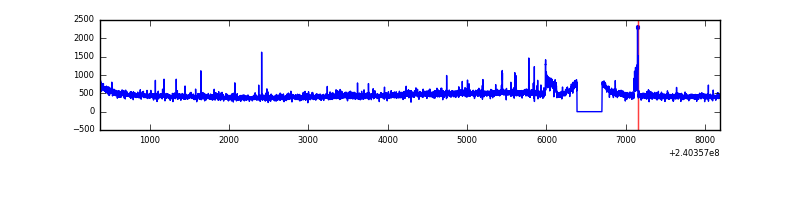 |
| B | 7812 | 7498 | 48 | 48 | 0.61% | 0.64% | 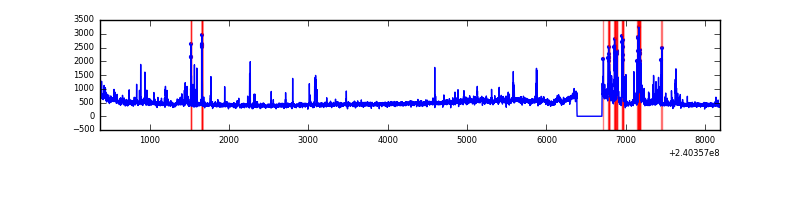 |
| C | 7812 | 7498 | 0 | 0 | 0.00% | 0.00% | 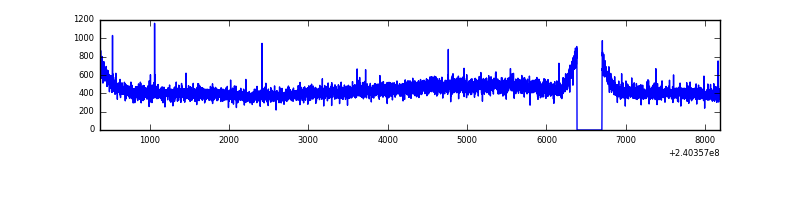 |
| D | 7811 | 7495 | 3538 | 3538 | 45.30% | 47.20% | 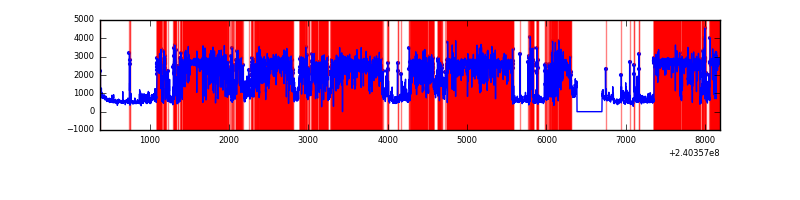 |
Top three noisy pixels from each quadrant. If the there are fewer than three noisy pixels in the level2.evt file, extra rows are filled as -1
| Pixel properties | Quadrant properties | ||||||
|---|---|---|---|---|---|---|---|
| Quadrant | DetID | PixID | Counts | Sigma | Mean | Median | Sigma |
| A | 15 | 174 | 90926 | 512.14 | 856 | 839 | 175.9 |
| A | 8 | 15 | 62231 | 349.01 | 856 | 839 | 175.9 |
| A | 0 | 226 | 7816 | 39.66 | 856 | 839 | 175.9 |
| B | 4 | 239 | 301664 | 1830.31 | 856 | 835 | 164.4 |
| B | 0 | 219 | 132731 | 802.48 | 856 | 835 | 164.4 |
| B | 4 | 81 | 68493 | 411.65 | 856 | 835 | 164.4 |
| C | 14 | 67 | 14844 | 72.66 | 827 | 830 | 192.9 |
| C | 13 | 61 | 6345 | 28.6 | 827 | 830 | 192.9 |
| C | 14 | 234 | 2712 | 9.76 | 827 | 830 | 192.9 |
| D | 1 | 52 | 9030594 | 56074.44 | 663 | 641 | 161.0 |
| D | 8 | 195 | 422005 | 2616.6 | 663 | 641 | 161.0 |
| D | 12 | 110 | 334601 | 2073.83 | 663 | 641 | 161.0 |
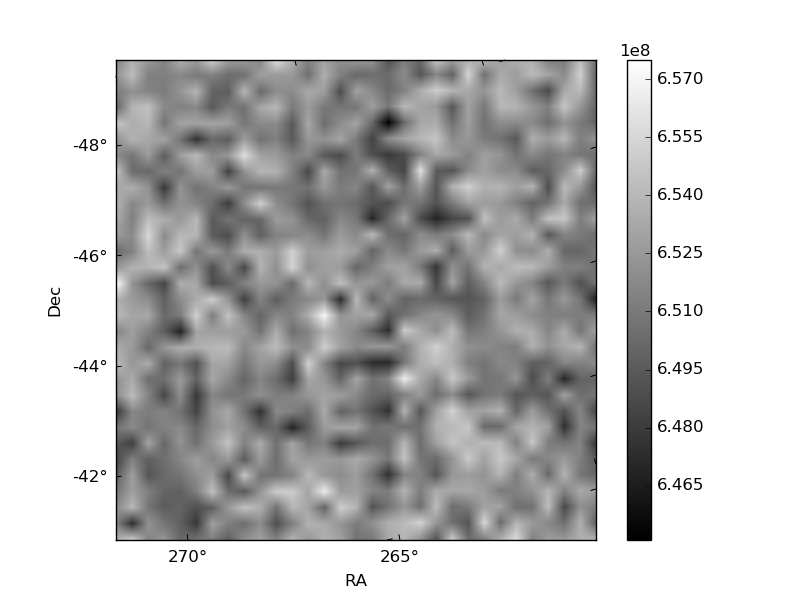
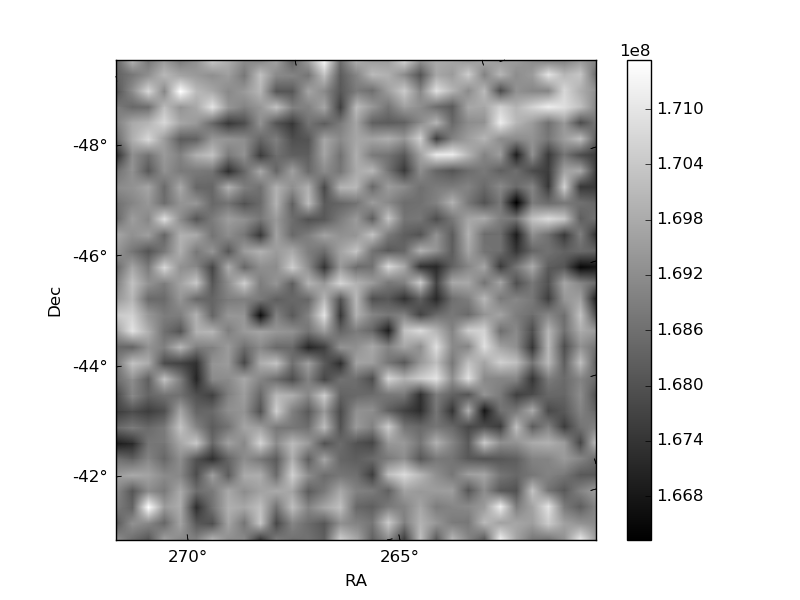
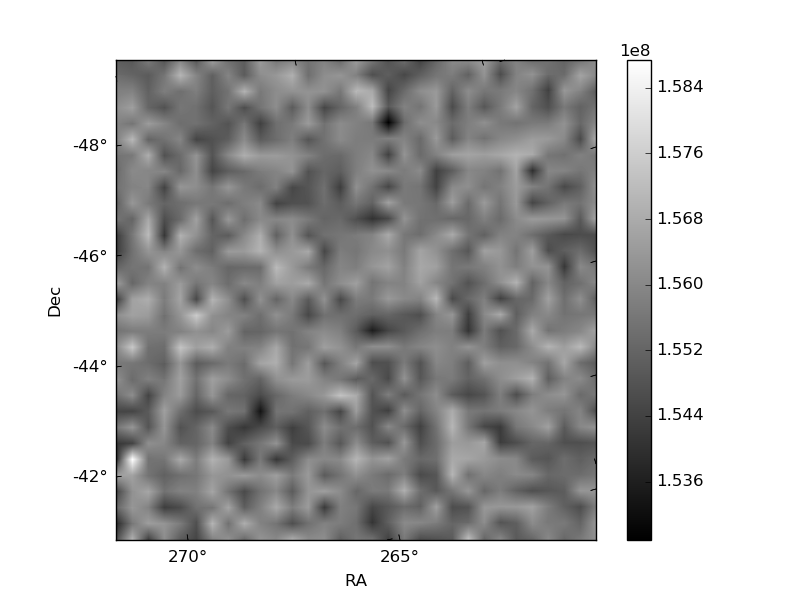
Histogram calculated using DETX and DETY for each event in the final _common_clean file
| Quadrant A | 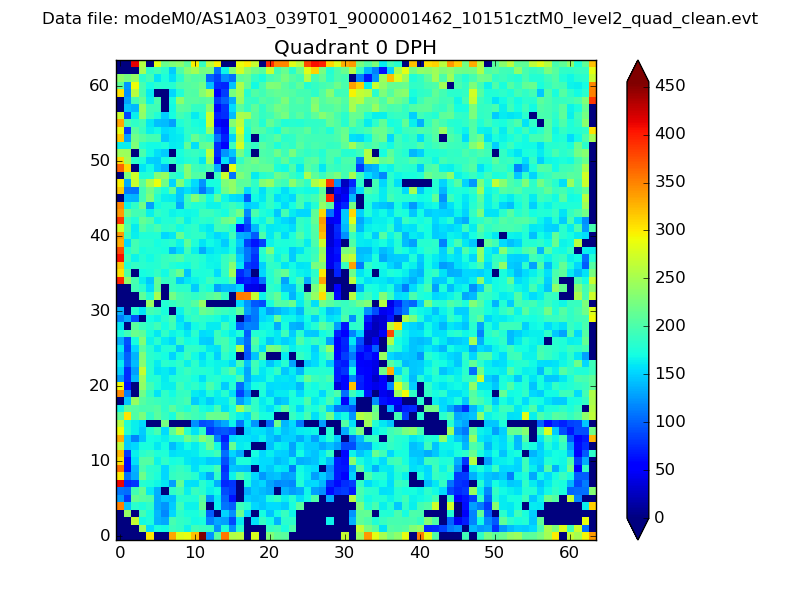 |
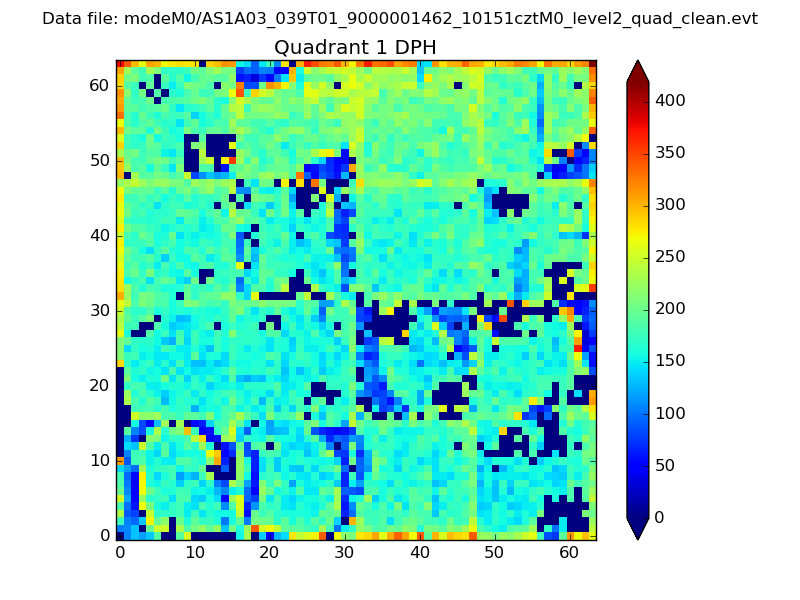 |
Quadrant B |
|---|---|---|---|
| Quadrant D |  |
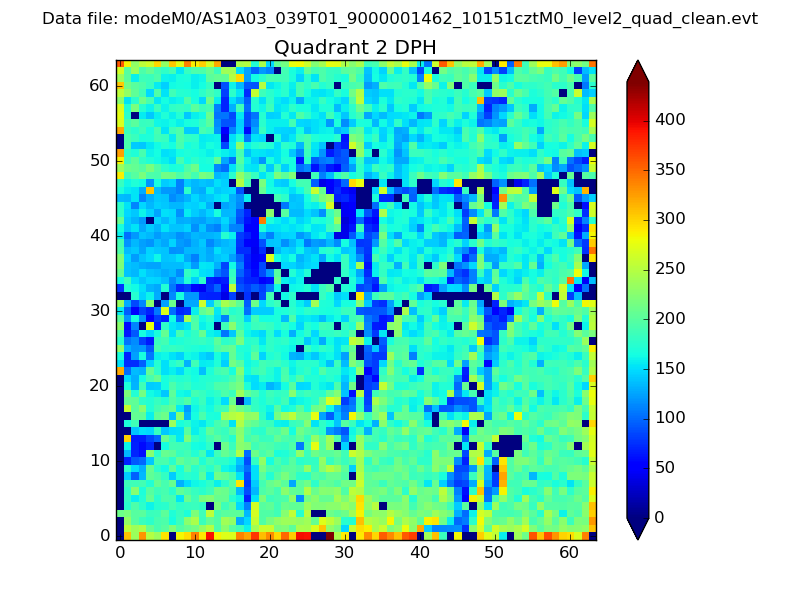 |
Quadrant C |
| Plot type | Count rate plots | Images |
|---|---|---|
| Comparison with Poisson distribution Blue bars denote a histogram of data divided into 1 sec bins. Red curve is a Poisson curve with rate = median count rate of data. |
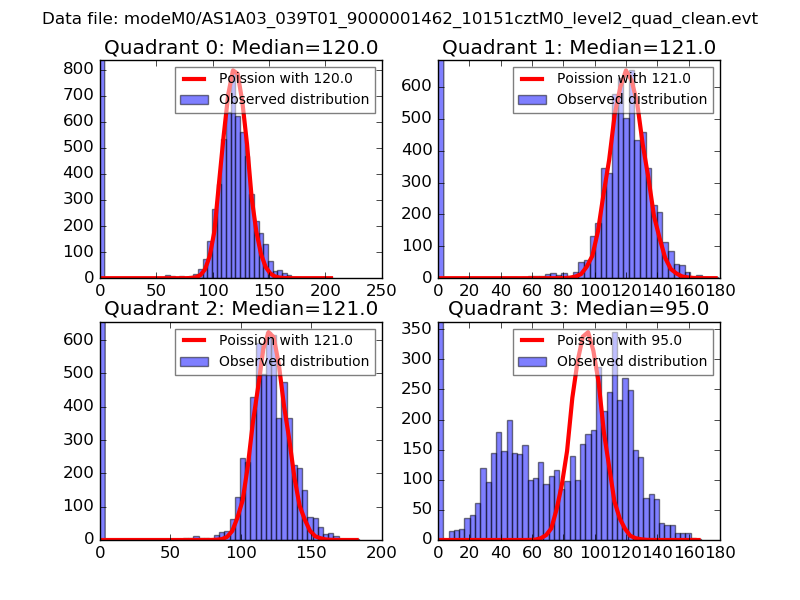 |
 |
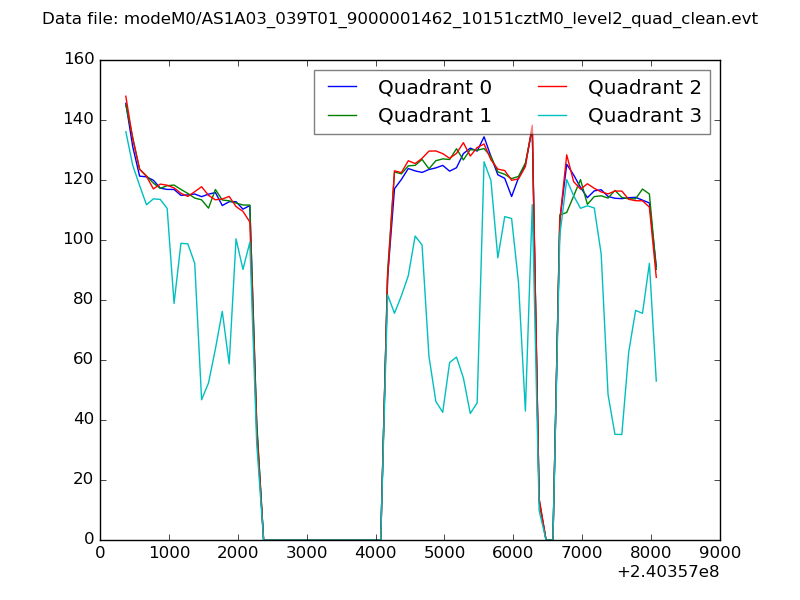
| Quadrant-wise count rates Data is divided into 100 sec bins |
 |
|
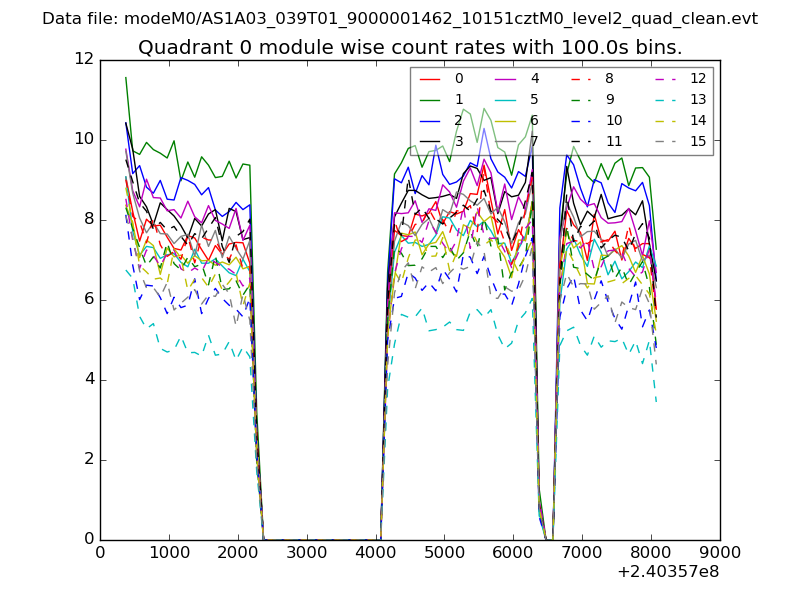
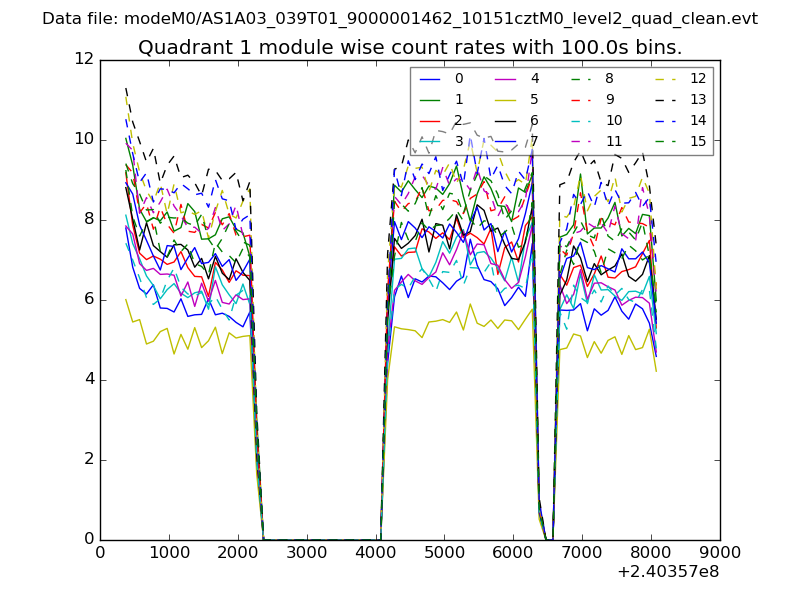
| Module-wise count rates for Quadrant A Data is divided into 100 sec bins |
 |
 |
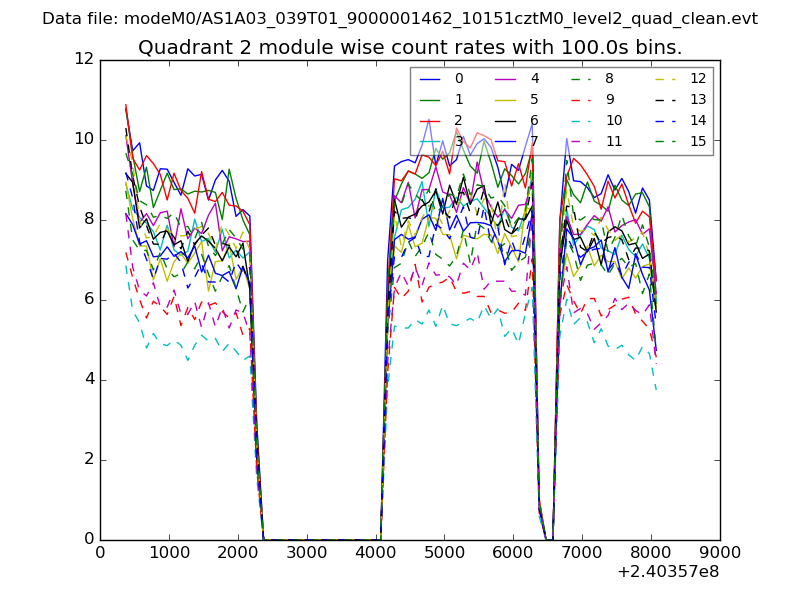
| Module-wise count rates for Quadrant B Data is divided into 100 sec bins |
 |
 |
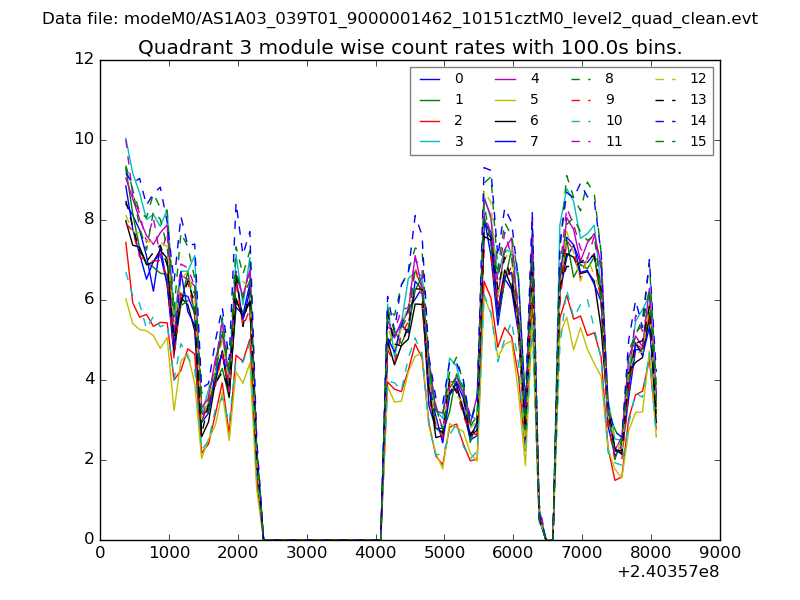
| Module-wise count rates for Quadrant C Data is divided into 100 sec bins |
 |
 |
| Module-wise count rates for Quadrant D Data is divided into 100 sec bins |
 |
 |
| Parameter | Plot |
|---|---|
| CZT HV Monitor | 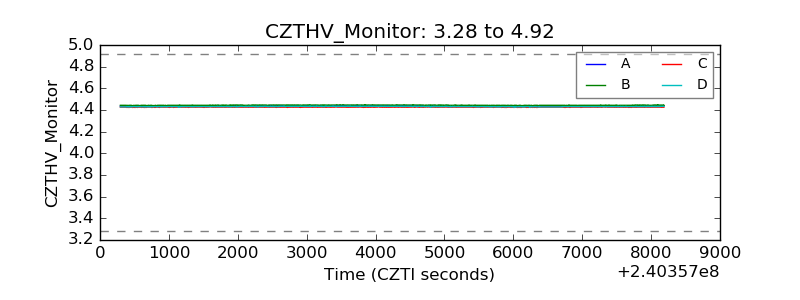 |
| D_VDD | 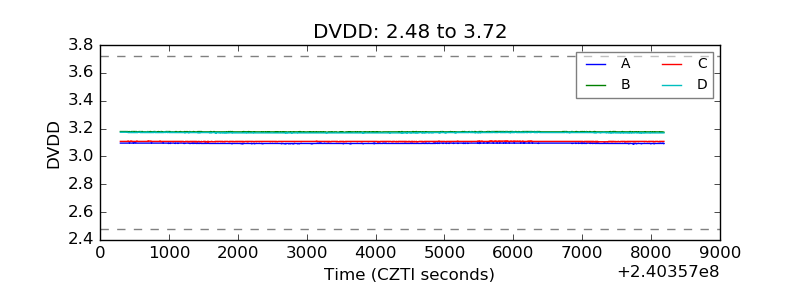 |
| Temperature 1 | 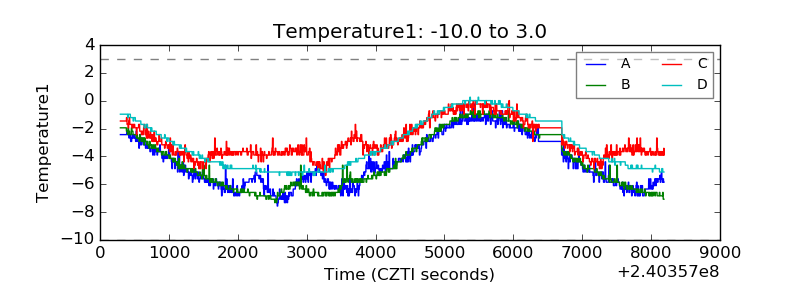 |
| Veto HV Monitor | 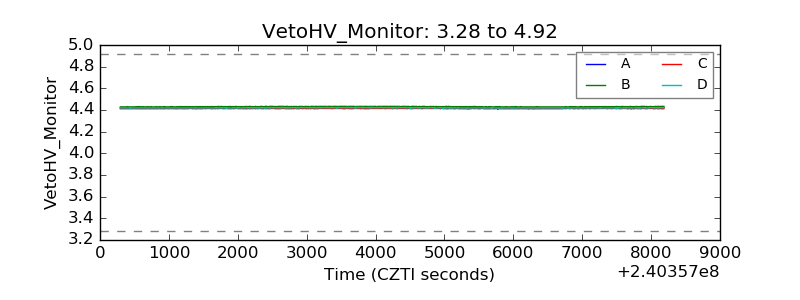 |
| Veto LLD | 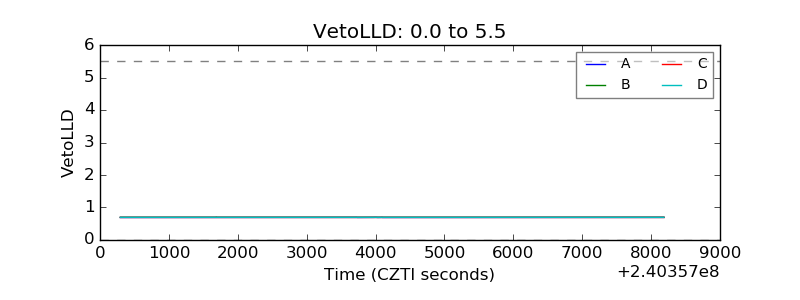 |
| Alpha Counter | 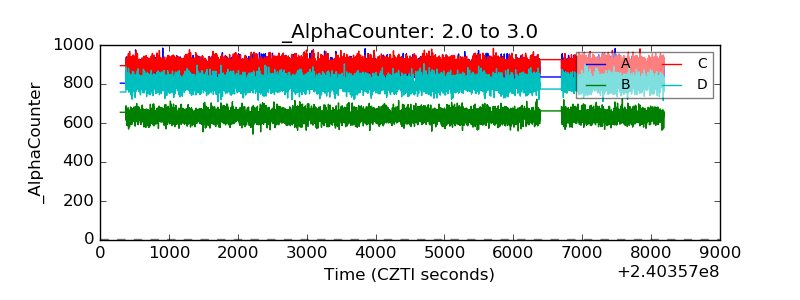 |
| _CPM_Rate | 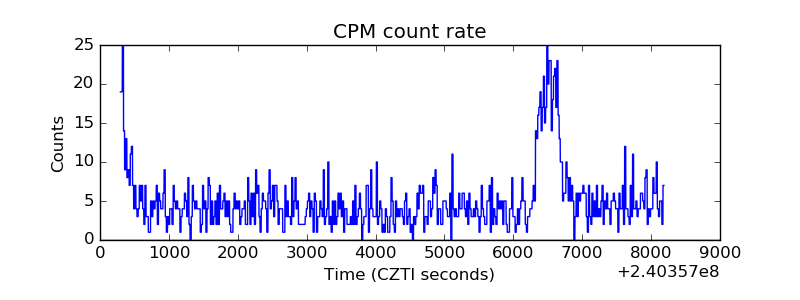 |
| CZT Counter | 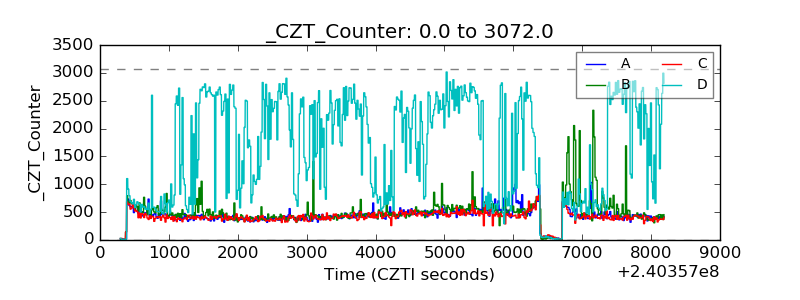 |
| +2.5 Volts monitor |  |
| +5 Volts monitor |  |
| _ROLL_ROT | 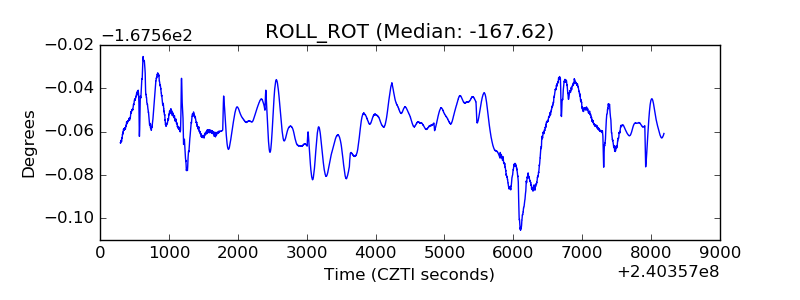 |
| _Roll_DEC | 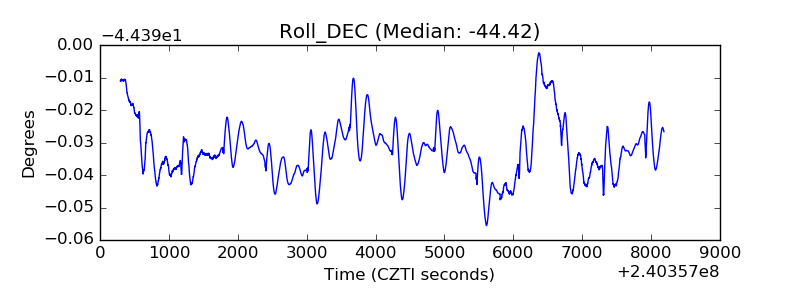 |
| _Roll_RA | 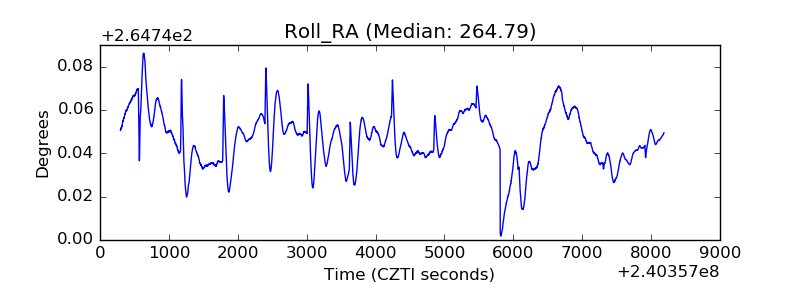 |
| Veto Counter | 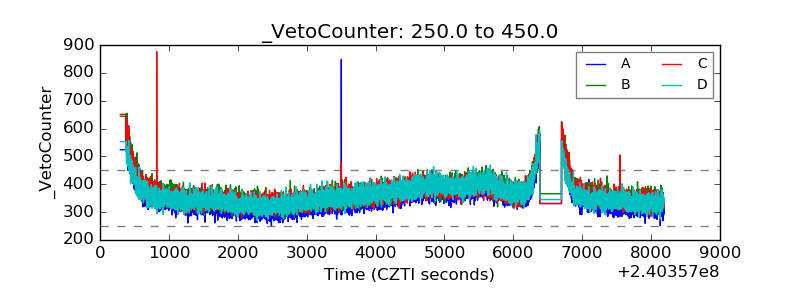 |