| Param | Original file | Final file |
|---|---|---|
| Filename | modeM0/AS1A03_039T01_9000001462_10152cztM0_level2.evt | modeM0/AS1A03_039T01_9000001462_10152cztM0_level2_quad_clean.evt |
| Size (bytes) | 967,481,280 | 85,956,480 |
| Size | 922.7 MB | 82.0 MB |
| Events in quadrant A | 4,388,675 | 578,030 |
| Events in quadrant B | 4,023,893 | 597,939 |
| Events in quadrant C | 3,223,970 | 600,832 |
| Events in quadrant D | 17,158,965 | 304,532 |
| Mode SS | |||
|---|---|---|---|
| Quadrant | BADHDUFLAG | Total packets | Discarded packets |
| A | 0 | 150 | 0 |
| B | 0 | 150 | 0 |
| C | 0 | 150 | 0 |
| D | 0 | 150 | 0 |
| Mode M0 | |||
|---|---|---|---|
| Quadrant | BADHDUFLAG | Total packets | Discarded packets |
| A | 0 | 18289 | 23 |
| B | 0 | 17219 | 16 |
| C | 0 | 15203 | 20 |
| D | 0 | 56203 | 102 |
| Mode M9 | |||
|---|---|---|---|
| Quadrant | BADHDUFLAG | Total packets | Discarded packets |
| A | 0 | 5 | 0 |
| B | 0 | 5 | 0 |
| C | 0 | 5 | 0 |
| D | 0 | 5 | 0 |
| Quadrant | Total seconds | Saturated seconds | Saturation percentage |
|---|---|---|---|
| A | 7473 | 371 | 4.964539% |
| B | 7473 | 153 | 2.047371% |
| C | 7470 | 33 | 0.441767% |
| D | 7466 | 6064 | 81.221538% |
Noise dominated data is calculated using 1-second bins in cleaned event files. If a bin has >2000 counts, and if more than 50% of those come from <1% of pixels, then it is considered to be noise-dominated and hence unusable.
| Quadrant | # 1 sec bins | Bins with >0 counts | Bins with >2000 counts | High rate bins dominated by noise | Noise dominated (total time) | Noise dominated (detector-on time) | Marked lightcurve |
|---|---|---|---|---|---|---|---|
| A | 7914 | 7480 | 260 | 260 | 3.29% | 3.48% | 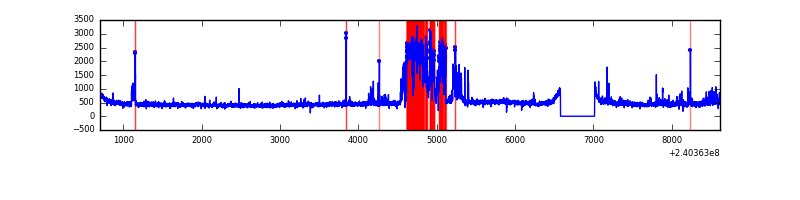 |
| B | 7914 | 7480 | 54 | 54 | 0.68% | 0.72% | 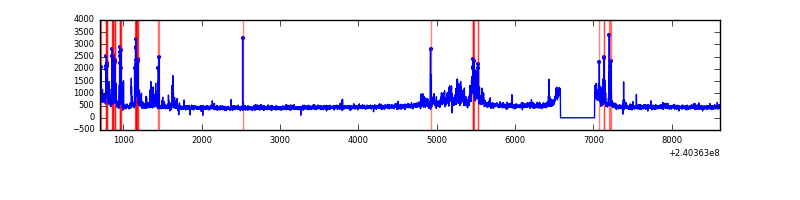 |
| C | 7914 | 7480 | 0 | 0 | 0.00% | 0.00% | 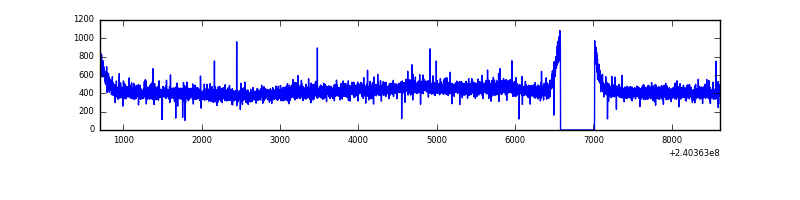 |
| D | 7913 | 7469 | 5926 | 5926 | 74.89% | 79.34% | 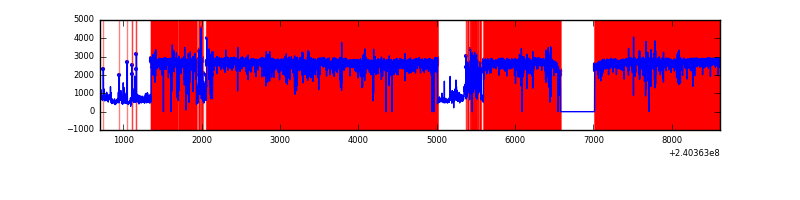 |
Top three noisy pixels from each quadrant. If the there are fewer than three noisy pixels in the level2.evt file, extra rows are filled as -1
| Pixel properties | Quadrant properties | ||||||
|---|---|---|---|---|---|---|---|
| Quadrant | DetID | PixID | Counts | Sigma | Mean | Median | Sigma |
| A | 15 | 223 | 668190 | 3915.94 | 832 | 817 | 170.4 |
| A | 15 | 239 | 337982 | 1978.38 | 832 | 817 | 170.4 |
| A | 8 | 15 | 104918 | 610.83 | 832 | 817 | 170.4 |
| B | 4 | 81 | 369032 | 2253.36 | 852 | 833 | 163.4 |
| B | 4 | 239 | 281435 | 1717.27 | 852 | 833 | 163.4 |
| B | 0 | 214 | 22171 | 130.59 | 852 | 833 | 163.4 |
| C | 14 | 67 | 11377 | 54.85 | 824 | 826 | 192.4 |
| C | 13 | 61 | 6285 | 28.38 | 824 | 826 | 192.4 |
| C | 3 | 202 | 1997 | 6.09 | 824 | 826 | 192.4 |
| D | 1 | 52 | 13550164 | 122376.96 | 460 | 446 | 110.7 |
| D | 4 | 95 | 458737 | 4139.15 | 460 | 446 | 110.7 |
| D | 12 | 33 | 367927 | 3318.98 | 460 | 446 | 110.7 |
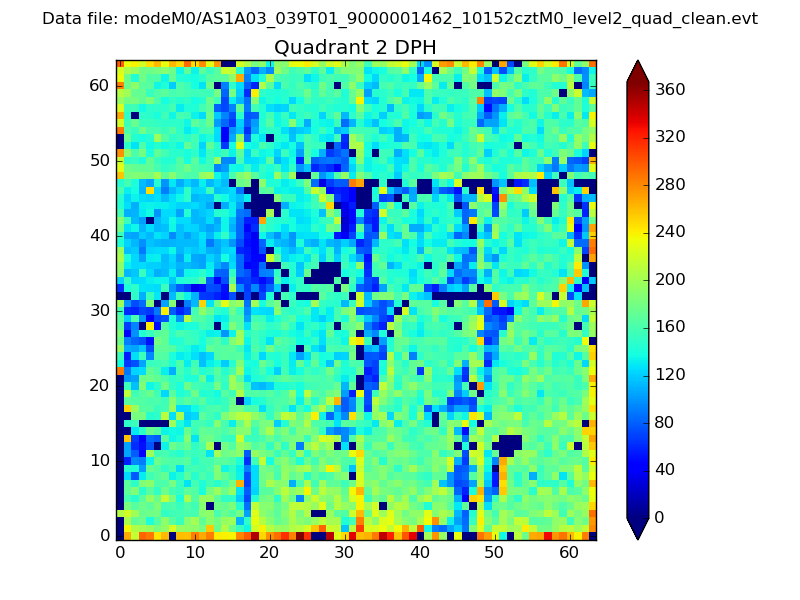
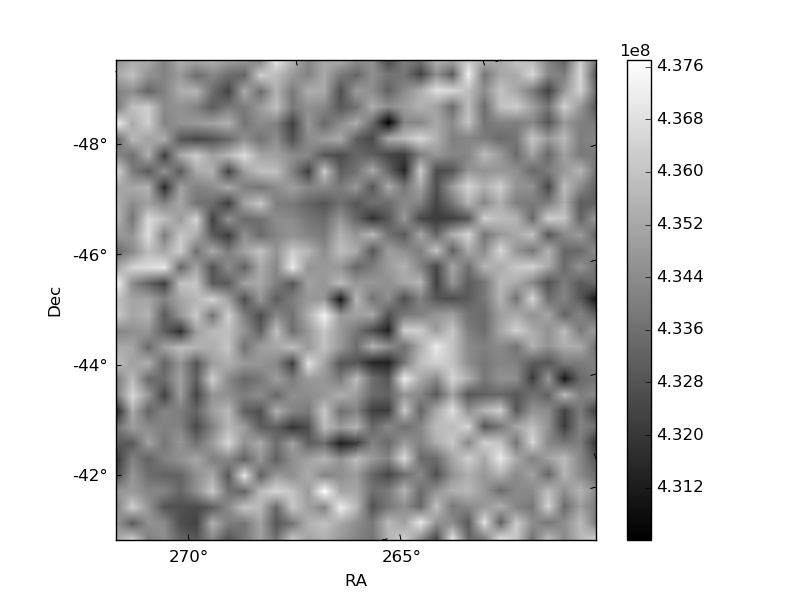
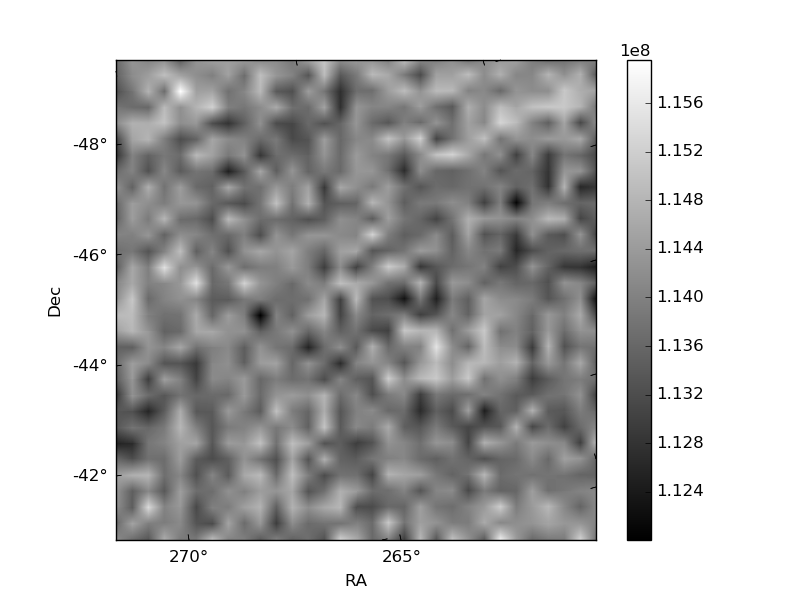
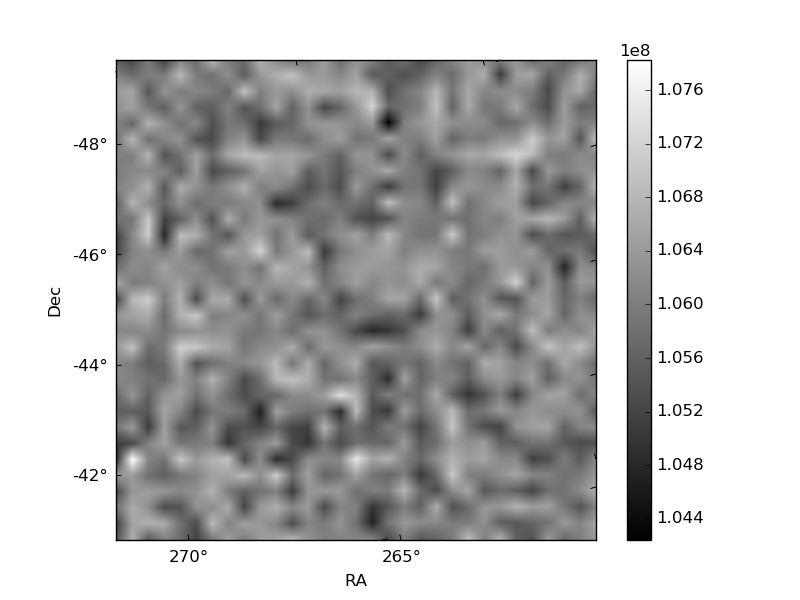
Histogram calculated using DETX and DETY for each event in the final _common_clean file
| Quadrant A | 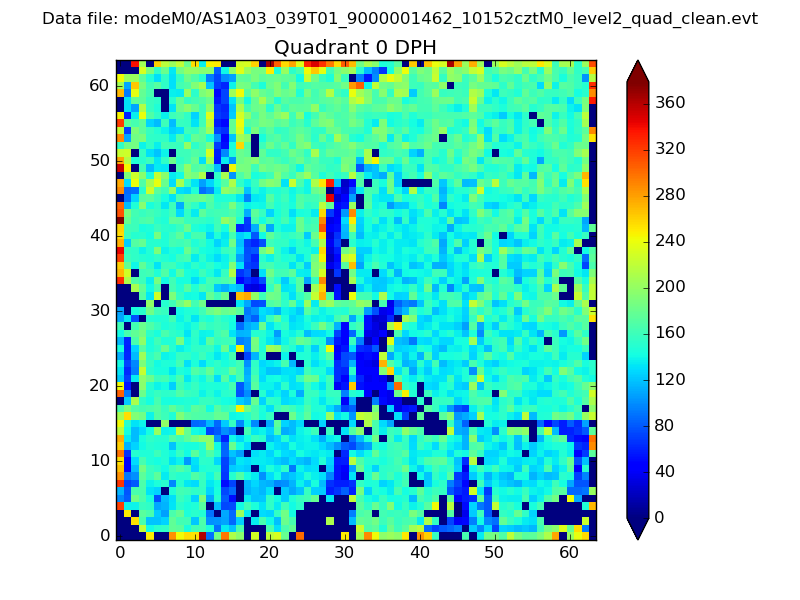 |
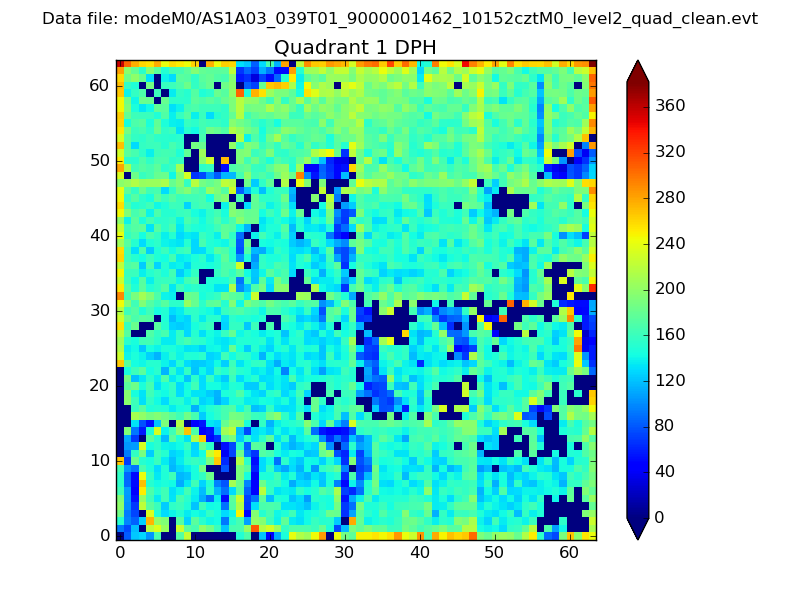 |
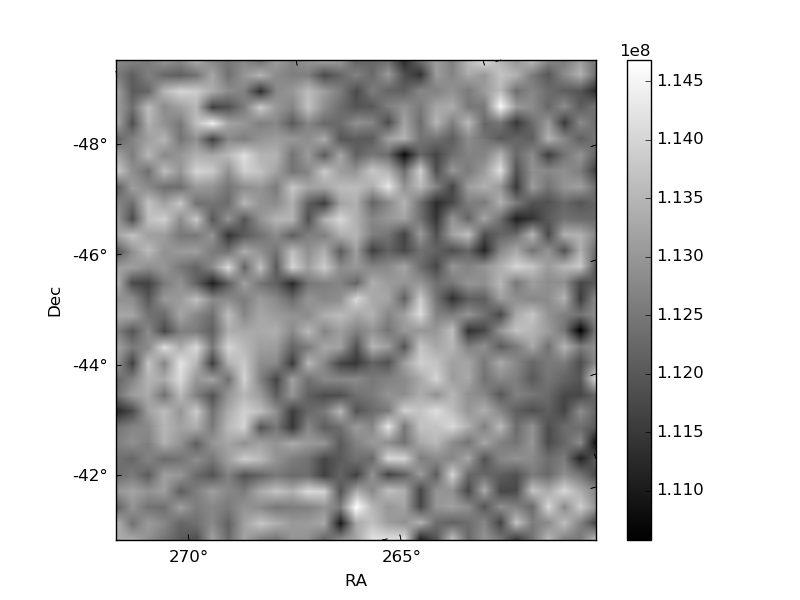
Quadrant B |
|---|---|---|---|
| Quadrant D | 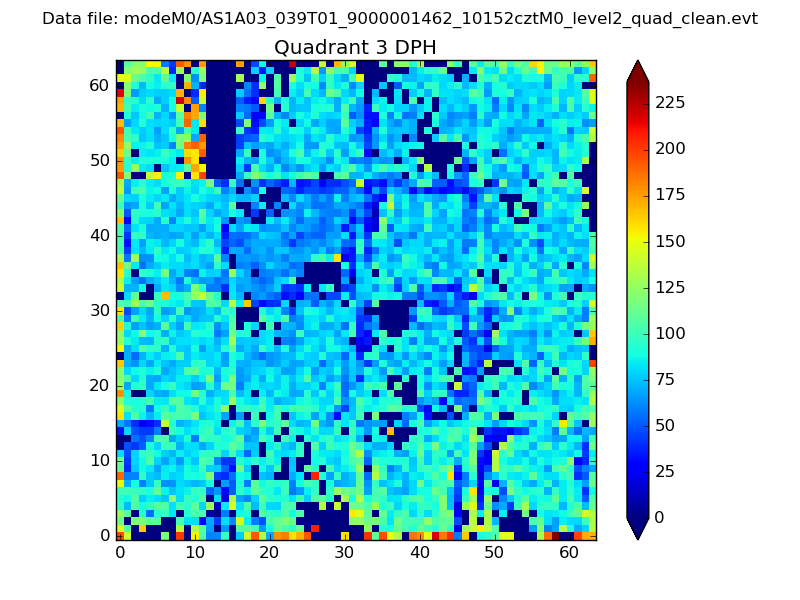 |
 |
Quadrant C |
| Plot type | Count rate plots | Images |
|---|---|---|
| Comparison with Poisson distribution Blue bars denote a histogram of data divided into 1 sec bins. Red curve is a Poisson curve with rate = median count rate of data. |
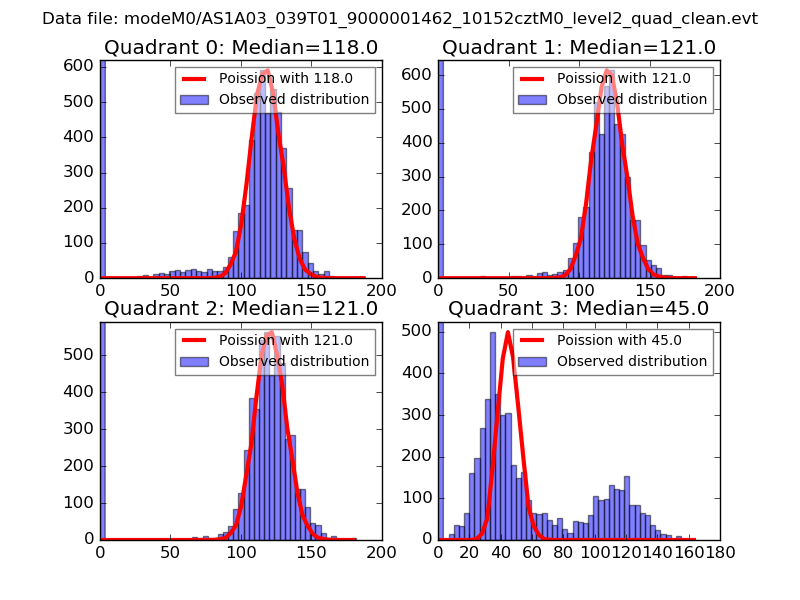 |
 |
| Quadrant-wise count rates Data is divided into 100 sec bins |
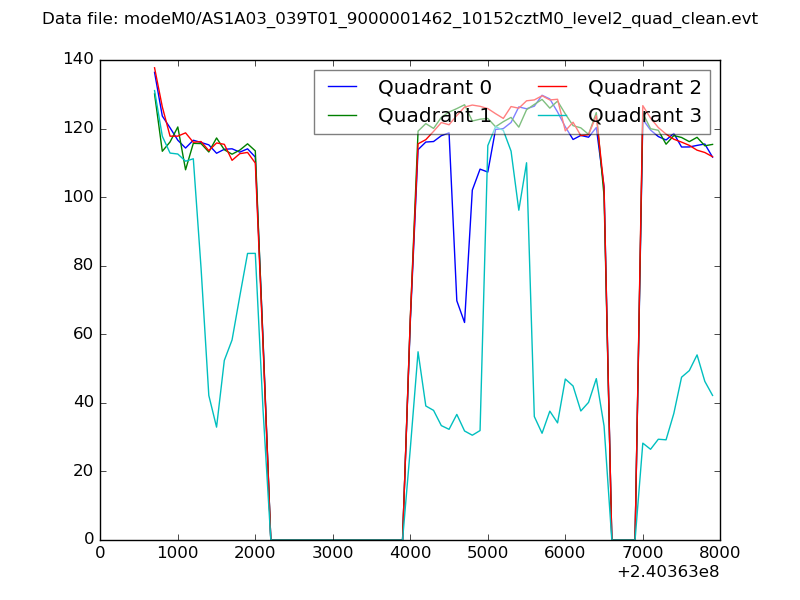 |
|
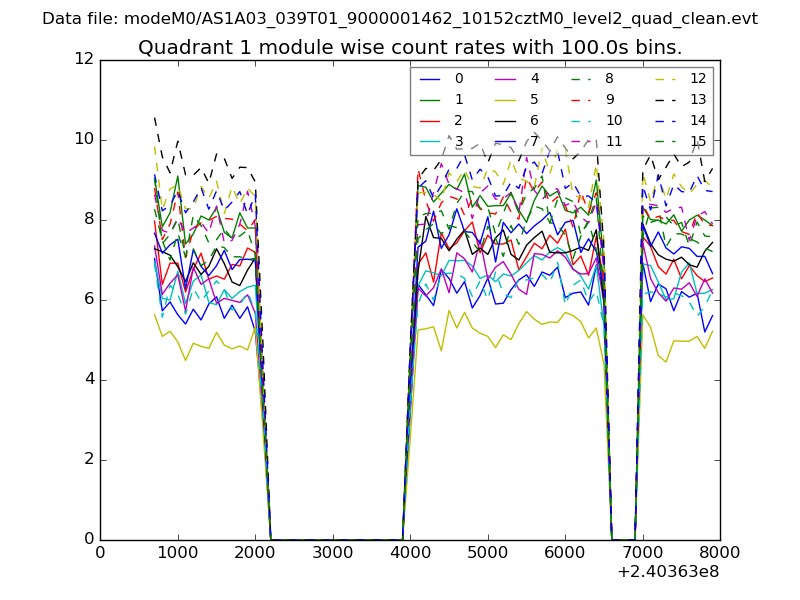
| Module-wise count rates for Quadrant A Data is divided into 100 sec bins |
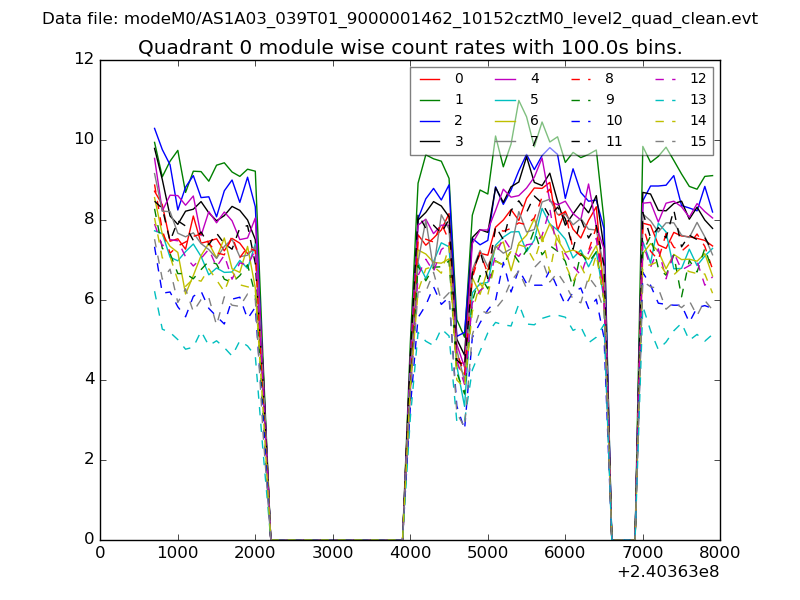 |
 |
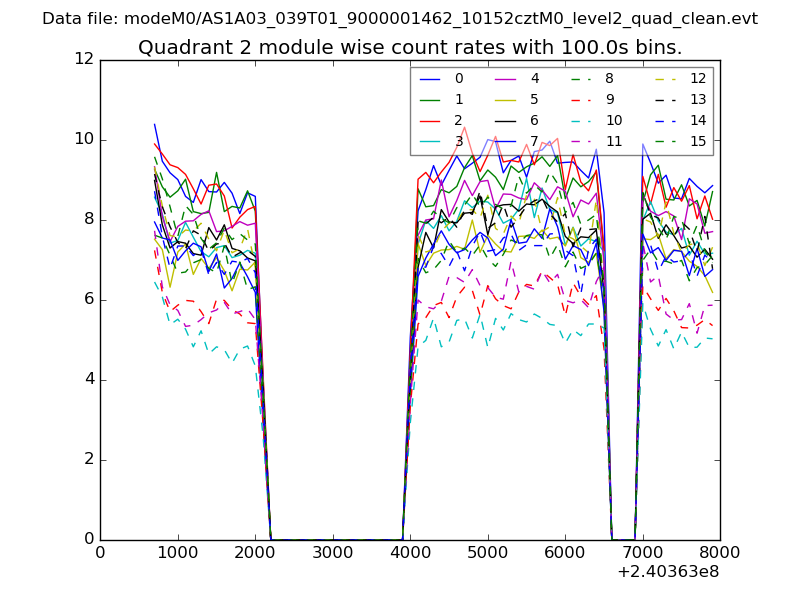
| Module-wise count rates for Quadrant B Data is divided into 100 sec bins |
 |
 |
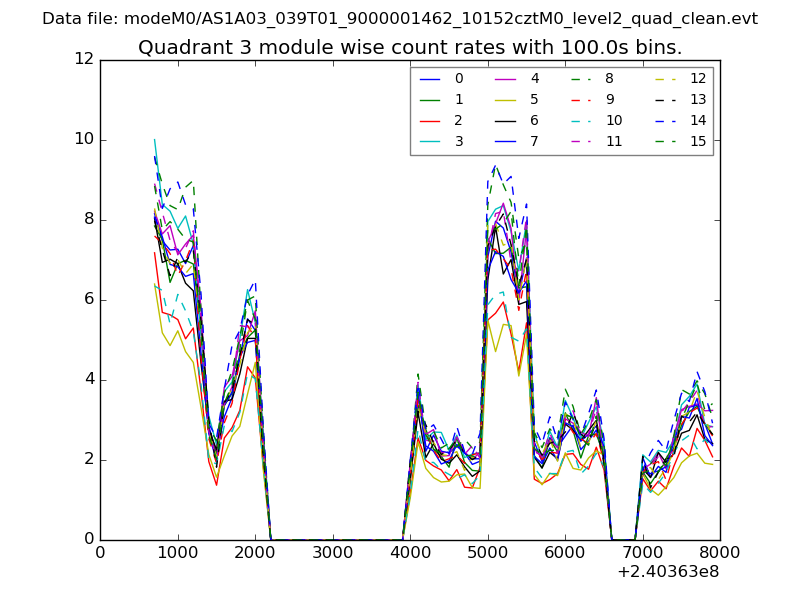
| Module-wise count rates for Quadrant C Data is divided into 100 sec bins |
 |
 |
| Module-wise count rates for Quadrant D Data is divided into 100 sec bins |
 |
 |
| Parameter | Plot |
|---|---|
| CZT HV Monitor | 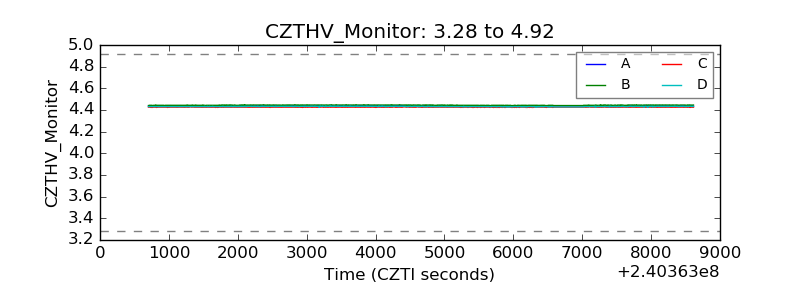 |
| D_VDD | 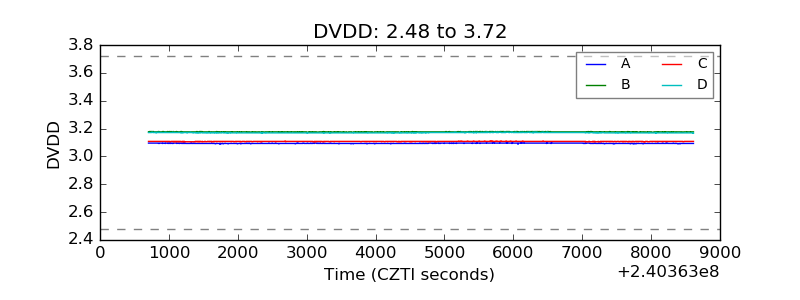 |
| Temperature 1 | 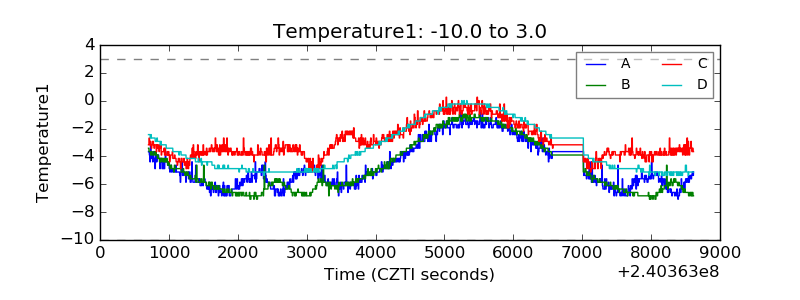 |
| Veto HV Monitor | 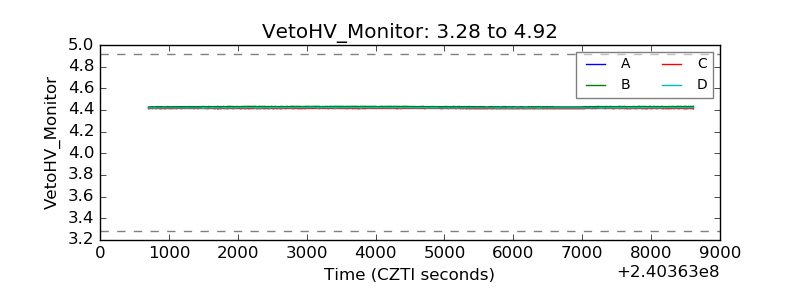 |
| Veto LLD | 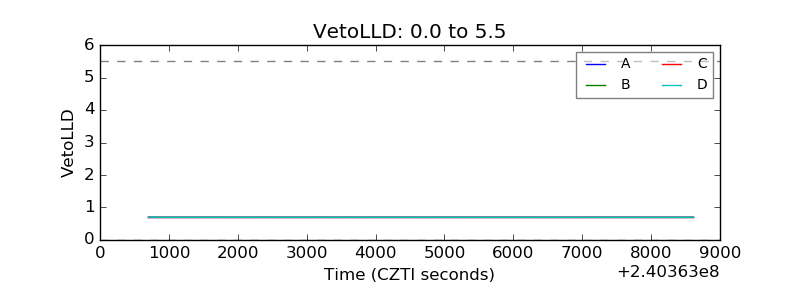 |
| Alpha Counter | 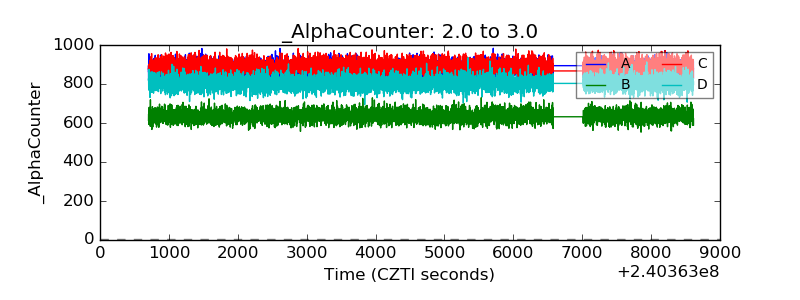 |
| _CPM_Rate | 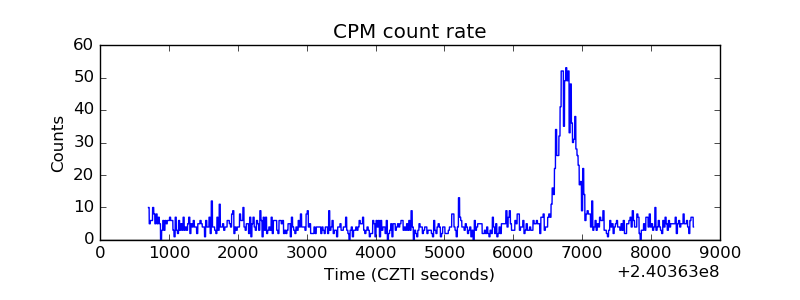 |
| CZT Counter | 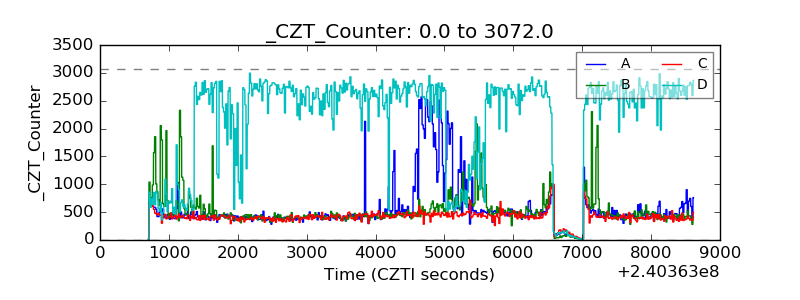 |
| +2.5 Volts monitor |  |
| +5 Volts monitor |  |
| _ROLL_ROT | 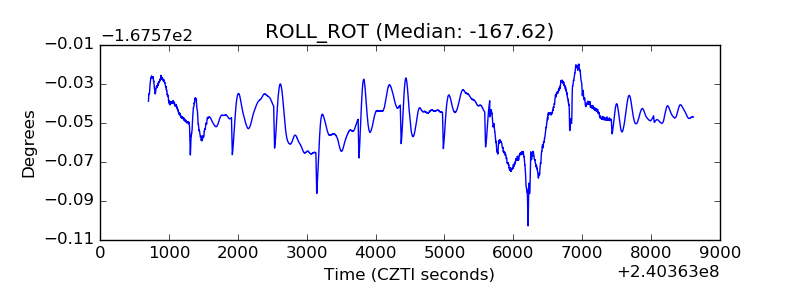 |
| _Roll_DEC | 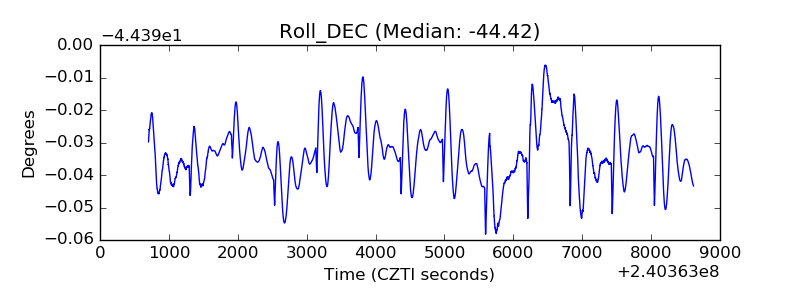 |
| _Roll_RA | 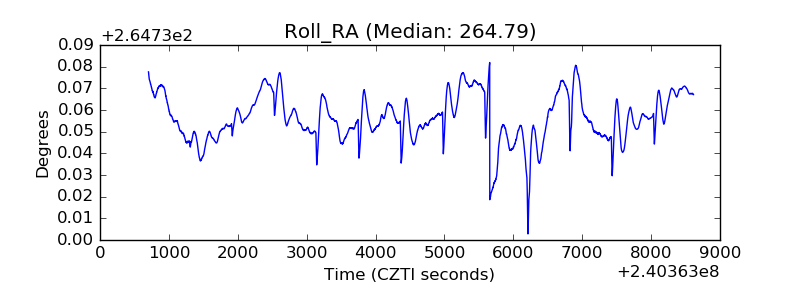 |
| Veto Counter | 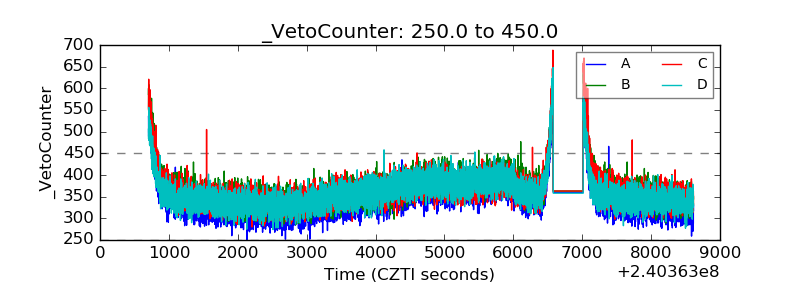 |