| Param | Original file | Final file |
|---|---|---|
| Filename | modeM0/AS1A03_039T01_9000001462_10154cztM0_level2.evt | modeM0/AS1A03_039T01_9000001462_10154cztM0_level2_quad_clean.evt |
| Size (bytes) | 1,703,813,760 | 133,617,600 |
| Size | 1.6 GB | 127.4 MB |
| Events in quadrant A | 7,282,447 | 895,927 |
| Events in quadrant B | 6,632,516 | 918,417 |
| Events in quadrant C | 5,676,401 | 926,483 |
| Events in quadrant D | 31,142,668 | 414,261 |
| Mode SS | |||
|---|---|---|---|
| Quadrant | BADHDUFLAG | Total packets | Discarded packets |
| A | 0 | 262 | 0 |
| B | 0 | 262 | 2 |
| C | 0 | 262 | 0 |
| D | 0 | 262 | 0 |
| Mode M0 | |||
|---|---|---|---|
| Quadrant | BADHDUFLAG | Total packets | Discarded packets |
| A | 0 | 30454 | 66 |
| B | 0 | 28508 | 61 |
| C | 0 | 26285 | 42 |
| D | 0 | 102049 | 768 |
| Mode M9 | |||
|---|---|---|---|
| Quadrant | BADHDUFLAG | Total packets | Discarded packets |
| A | 0 | 19 | 0 |
| B | 0 | 19 | 0 |
| C | 0 | 19 | 0 |
| D | 0 | 19 | 0 |
| Quadrant | Total seconds | Saturated seconds | Saturation percentage |
|---|---|---|---|
| A | 12870 | 498 | 3.869464% |
| B | 12868 | 216 | 1.678583% |
| C | 12876 | 109 | 0.846536% |
| D | 12804 | 11416 | 89.159638% |
Noise dominated data is calculated using 1-second bins in cleaned event files. If a bin has >2000 counts, and if more than 50% of those come from <1% of pixels, then it is considered to be noise-dominated and hence unusable.
| Quadrant | # 1 sec bins | Bins with >0 counts | Bins with >2000 counts | High rate bins dominated by noise | Noise dominated (total time) | Noise dominated (detector-on time) | Marked lightcurve |
|---|---|---|---|---|---|---|---|
| A | 14686 | 12897 | 321 | 321 | 2.19% | 2.49% | 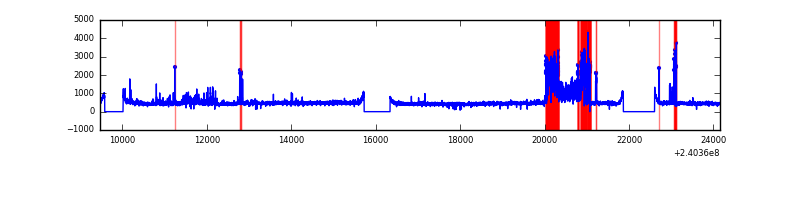 |
| B | 14686 | 12898 | 36 | 36 | 0.25% | 0.28% | 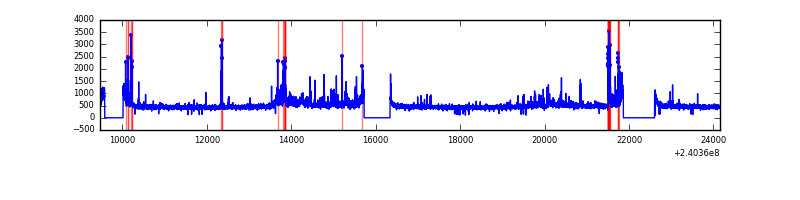 |
| C | 14686 | 12897 | 0 | 0 | 0.00% | 0.00% | 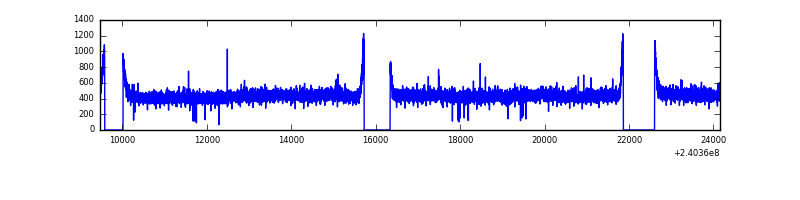 |
| D | 14685 | 12821 | 11181 | 11181 | 76.14% | 87.21% | 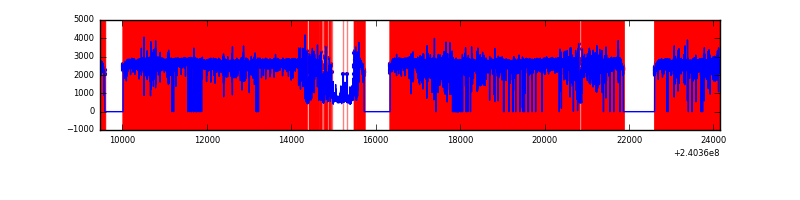 |
Top three noisy pixels from each quadrant. If the there are fewer than three noisy pixels in the level2.evt file, extra rows are filled as -1
| Pixel properties | Quadrant properties | ||||||
|---|---|---|---|---|---|---|---|
| Quadrant | DetID | PixID | Counts | Sigma | Mean | Median | Sigma |
| A | 15 | 223 | 801883 | 2700.21 | 1463 | 1431 | 296.4 |
| A | 15 | 239 | 492139 | 1655.34 | 1463 | 1431 | 296.4 |
| A | 8 | 15 | 169178 | 565.87 | 1463 | 1431 | 296.4 |
| B | 4 | 81 | 404431 | 1413.53 | 1489 | 1449 | 285.1 |
| B | 4 | 239 | 223468 | 778.77 | 1489 | 1449 | 285.1 |
| B | 0 | 219 | 81994 | 282.53 | 1489 | 1449 | 285.1 |
| C | 14 | 67 | 32807 | 94.11 | 1443 | 1449 | 333.2 |
| C | 8 | 128 | 11786 | 31.02 | 1443 | 1449 | 333.2 |
| C | 13 | 61 | 10863 | 28.25 | 1443 | 1449 | 333.2 |
| D | 1 | 52 | 26416701 | 142959.19 | 776 | 752 | 184.8 |
| D | 4 | 95 | 534786 | 2890.11 | 776 | 752 | 184.8 |
| D | 8 | 195 | 404200 | 2183.4 | 776 | 752 | 184.8 |
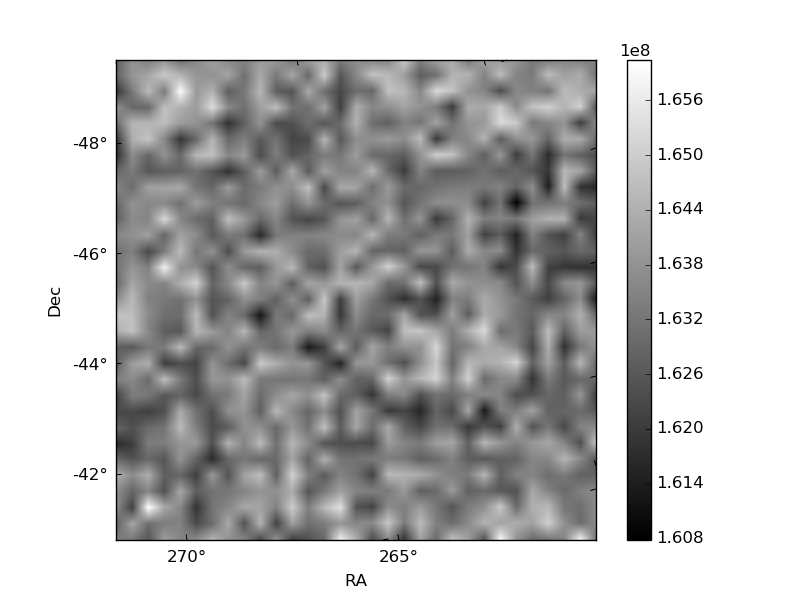
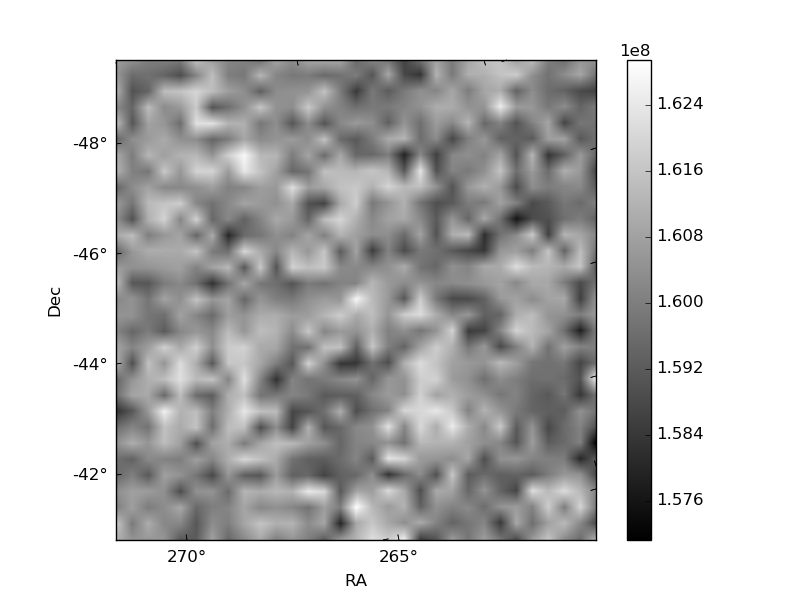
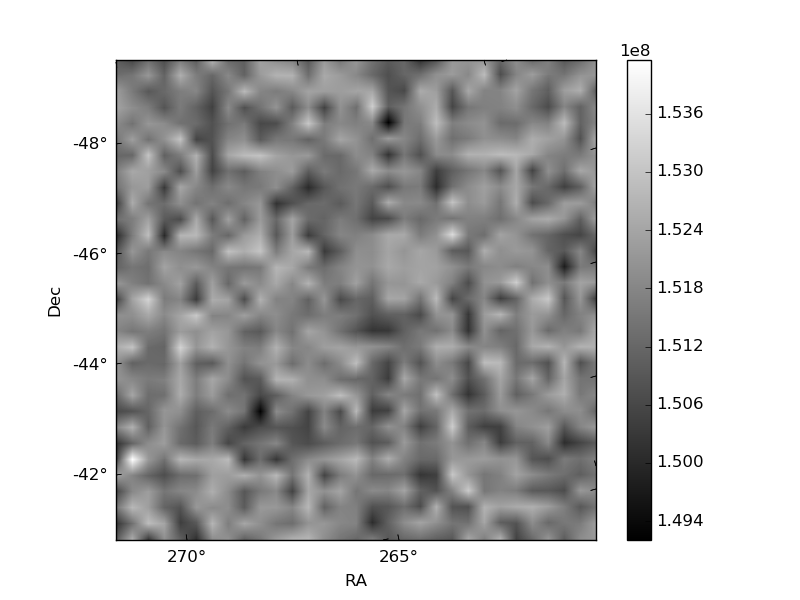
Histogram calculated using DETX and DETY for each event in the final _common_clean file
| Quadrant A |  |
 |
Quadrant B |
|---|---|---|---|
| Quadrant D |  |
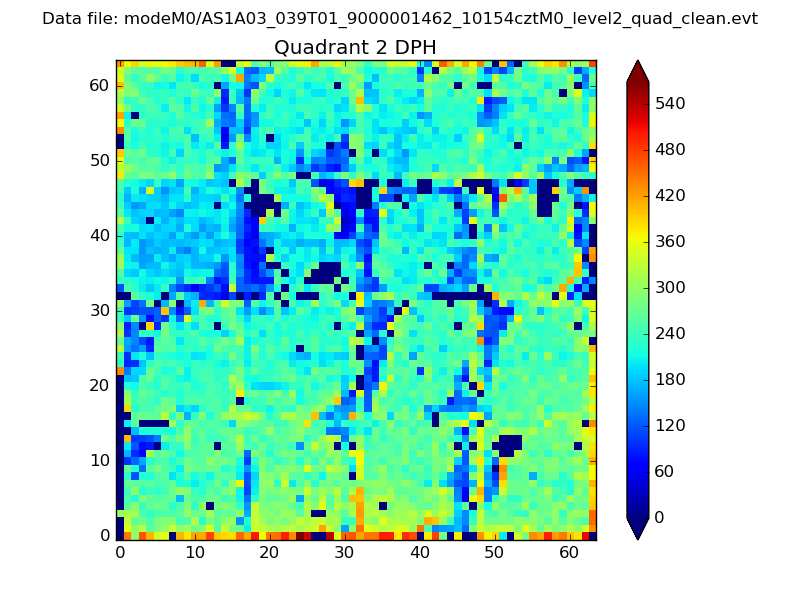 |
Quadrant C |
| Plot type | Count rate plots | Images |
|---|---|---|
| Comparison with Poisson distribution Blue bars denote a histogram of data divided into 1 sec bins. Red curve is a Poisson curve with rate = median count rate of data. |
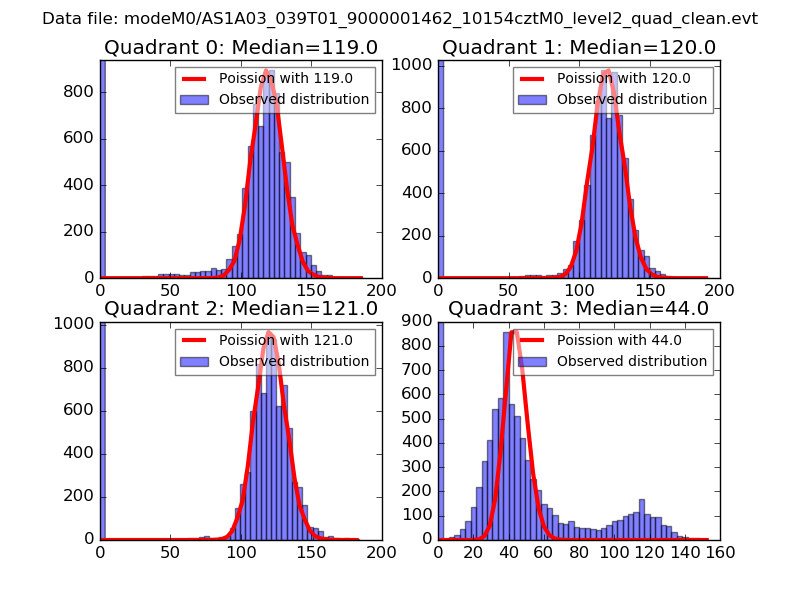 |
 |
| Quadrant-wise count rates Data is divided into 100 sec bins |
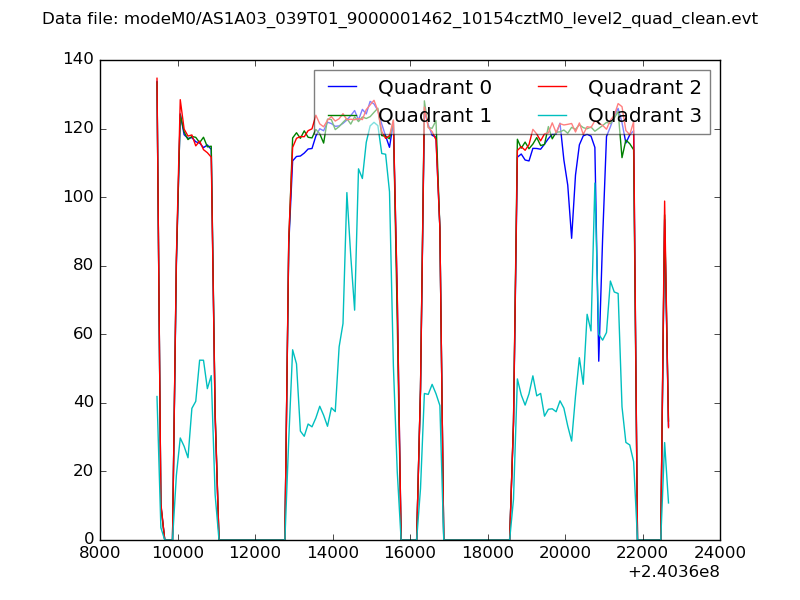 |
|
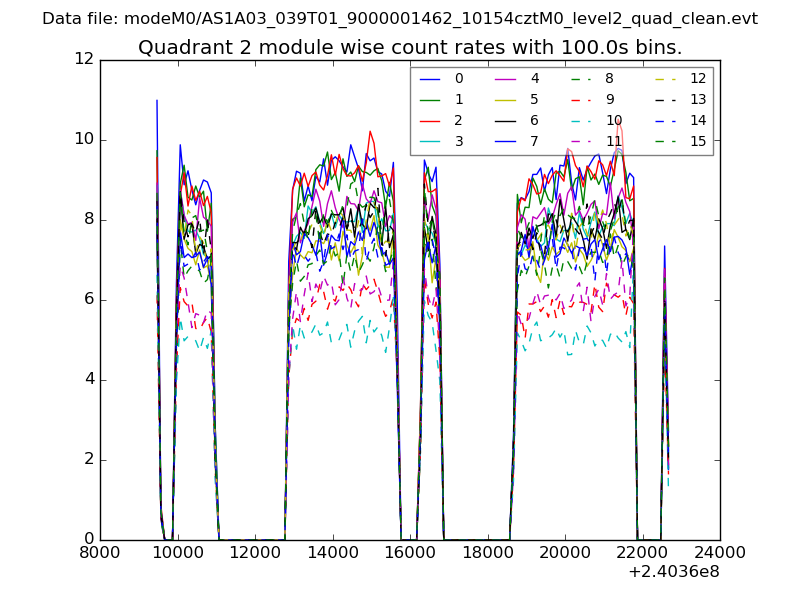
| Module-wise count rates for Quadrant A Data is divided into 100 sec bins |
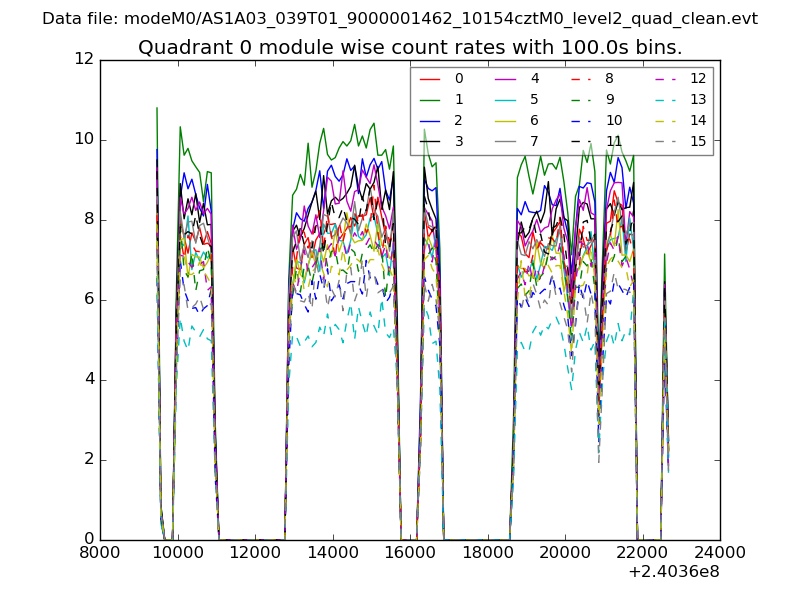 |
 |
| Module-wise count rates for Quadrant B Data is divided into 100 sec bins |
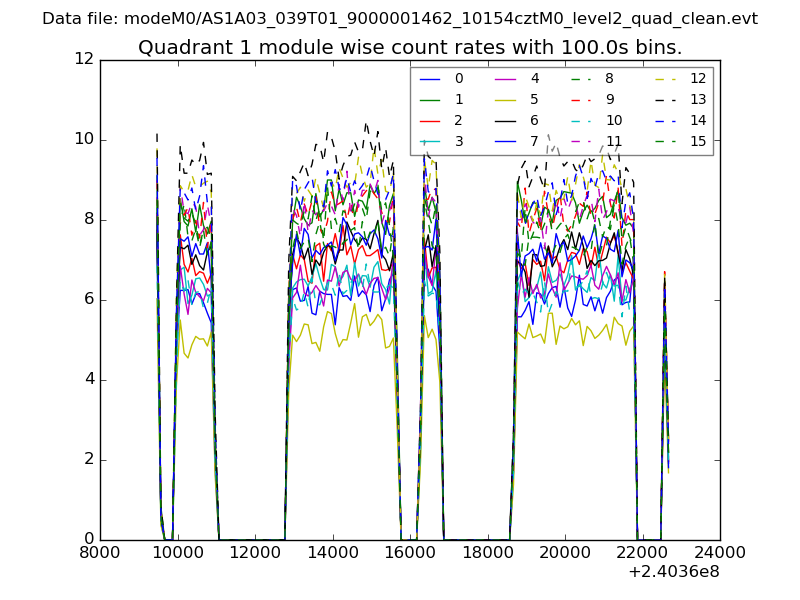 |
 |
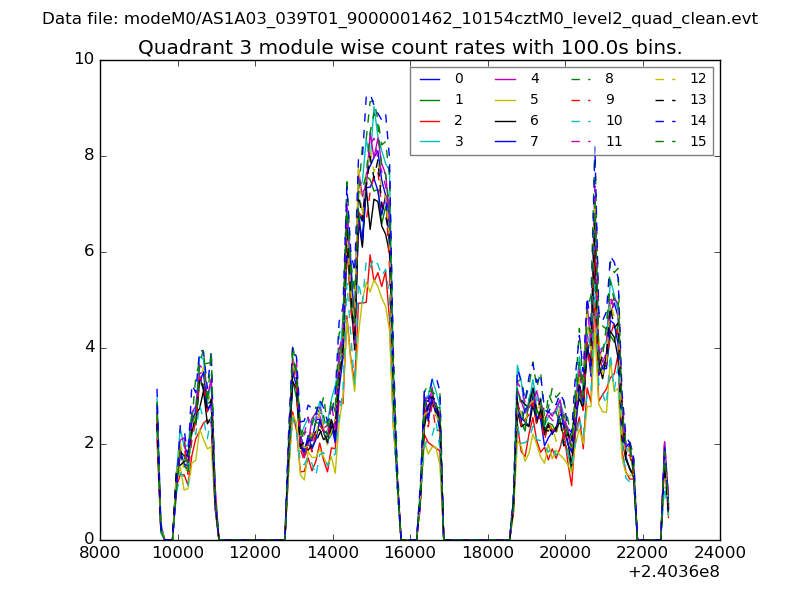
| Module-wise count rates for Quadrant C Data is divided into 100 sec bins |
 |
 |
| Module-wise count rates for Quadrant D Data is divided into 100 sec bins |
 |
 |
| Parameter | Plot |
|---|---|
| CZT HV Monitor | 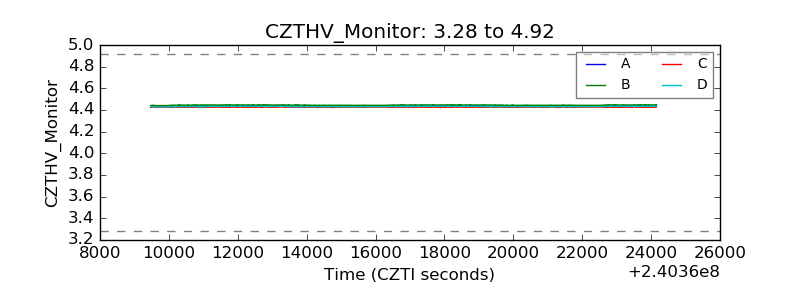 |
| D_VDD | 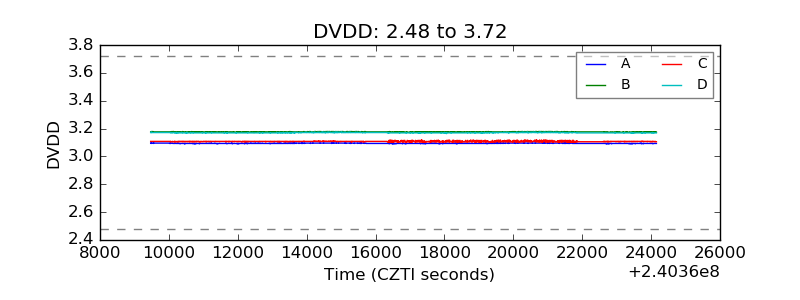 |
| Temperature 1 | 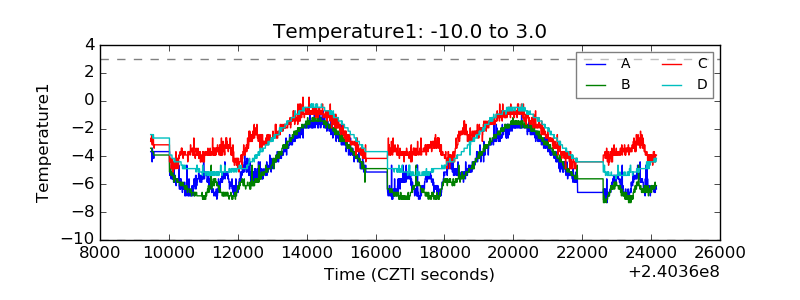 |
| Veto HV Monitor | 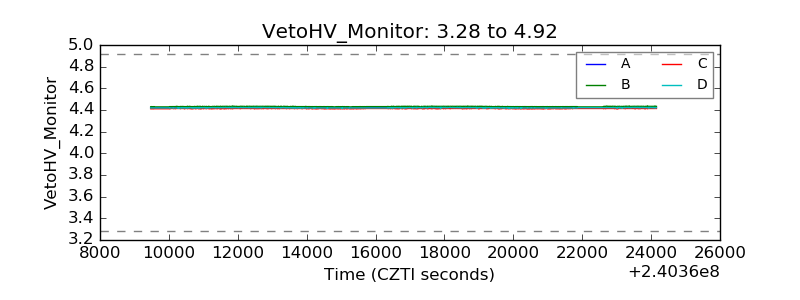 |
| Veto LLD | 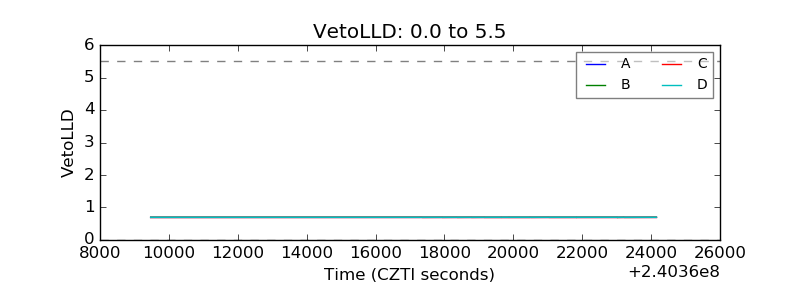 |
| Alpha Counter | 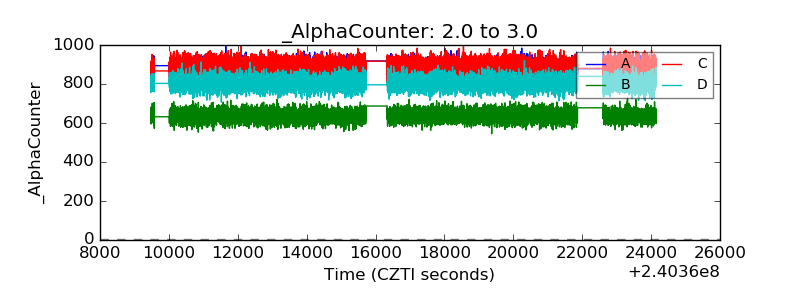 |
| _CPM_Rate | 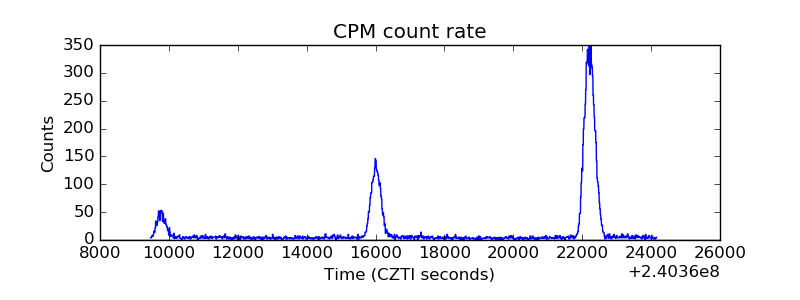 |
| CZT Counter | 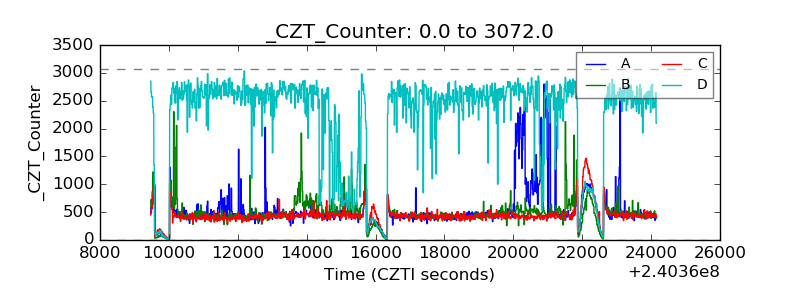 |
| +2.5 Volts monitor |  |
| +5 Volts monitor | 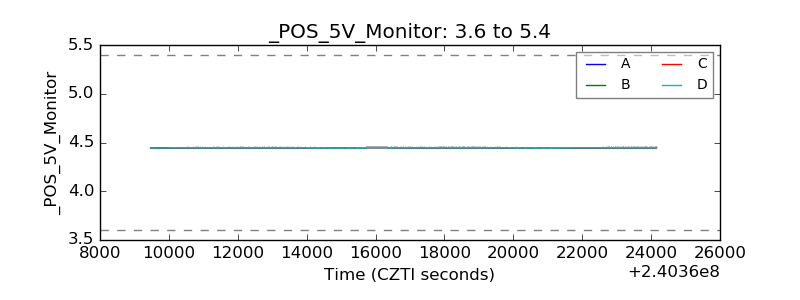 |
| _ROLL_ROT | 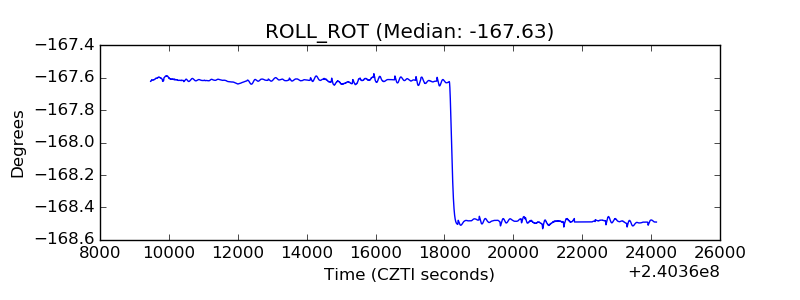 |
| _Roll_DEC | 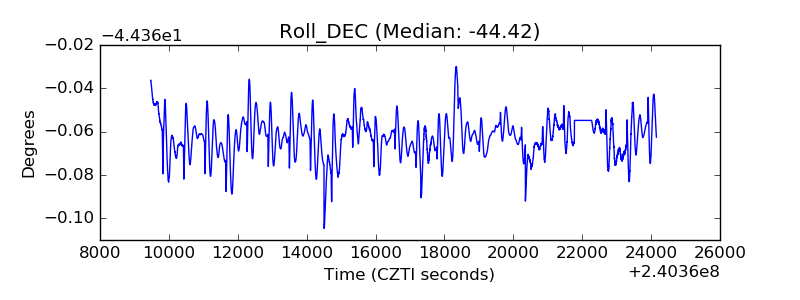 |
| _Roll_RA |  |
| Veto Counter | 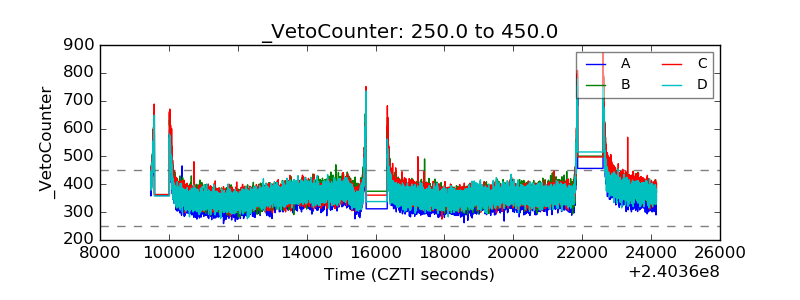 |