| Param | Original file | Final file |
|---|---|---|
| Filename | modeM0/AS1A03_039T01_9000001462_10155cztM0_level2.evt | modeM0/AS1A03_039T01_9000001462_10155cztM0_level2_quad_clean.evt |
| Size (bytes) | 748,869,120 | 59,126,400 |
| Size | 714.2 MB | 56.4 MB |
| Events in quadrant A | 2,845,786 | 402,039 |
| Events in quadrant B | 3,072,761 | 404,987 |
| Events in quadrant C | 2,807,060 | 409,409 |
| Events in quadrant D | 13,532,904 | 138,525 |
| Mode SS | |||
|---|---|---|---|
| Quadrant | BADHDUFLAG | Total packets | Discarded packets |
| A | 0 | 130 | 4 |
| B | 0 | 130 | 4 |
| C | 0 | 129 | 0 |
| D | 0 | 130 | 4 |
| Mode M0 | |||
|---|---|---|---|
| Quadrant | BADHDUFLAG | Total packets | Discarded packets |
| A | 0 | 13128 | 387 |
| B | 0 | 13424 | 195 |
| C | 0 | 12965 | 213 |
| D | 0 | 46289 | 1948 |
| Mode M9 | |||
|---|---|---|---|
| Quadrant | BADHDUFLAG | Total packets | Discarded packets |
| A | 0 | 9 | 0 |
| B | 0 | 9 | 0 |
| C | 0 | 9 | 0 |
| D | 0 | 9 | 0 |
| Quadrant | Total seconds | Saturated seconds | Saturation percentage |
|---|---|---|---|
| A | 6225 | 48 | 0.771084% |
| B | 6252 | 86 | 1.375560% |
| C | 6243 | 41 | 0.656736% |
| D | 6111 | 4890 | 80.019637% |
Noise dominated data is calculated using 1-second bins in cleaned event files. If a bin has >2000 counts, and if more than 50% of those come from <1% of pixels, then it is considered to be noise-dominated and hence unusable.
| Quadrant | # 1 sec bins | Bins with >0 counts | Bins with >2000 counts | High rate bins dominated by noise | Noise dominated (total time) | Noise dominated (detector-on time) | Marked lightcurve |
|---|---|---|---|---|---|---|---|
| A | 7264 | 6288 | 2 | 2 | 0.03% | 0.03% | 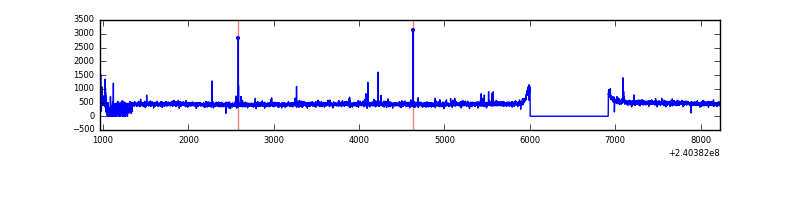 |
| B | 7264 | 6305 | 24 | 24 | 0.33% | 0.38% | 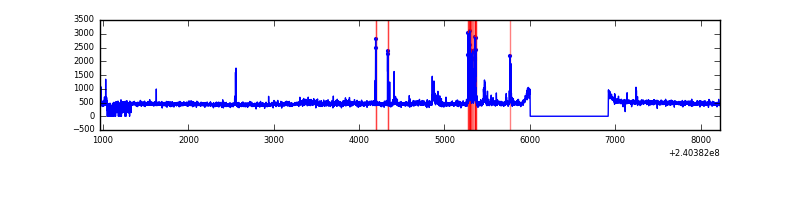 |
| C | 7264 | 6306 | 0 | 0 | 0.00% | 0.00% | 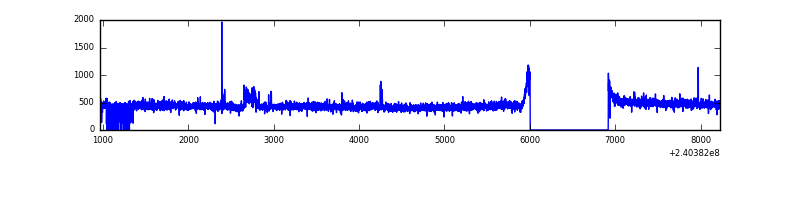 |
| D | 7264 | 6113 | 4806 | 4806 | 66.16% | 78.62% | 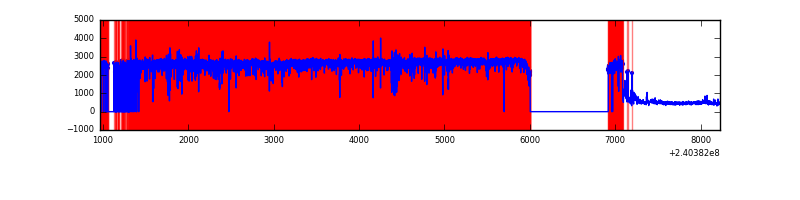 |
Top three noisy pixels from each quadrant. If the there are fewer than three noisy pixels in the level2.evt file, extra rows are filled as -1
| Pixel properties | Quadrant properties | ||||||
|---|---|---|---|---|---|---|---|
| Quadrant | DetID | PixID | Counts | Sigma | Mean | Median | Sigma |
| A | 13 | 251 | 20782 | 136.73 | 721 | 704 | 146.8 |
| A | 15 | 223 | 18478 | 121.04 | 721 | 704 | 146.8 |
| A | 8 | 15 | 11306 | 72.2 | 721 | 704 | 146.8 |
| B | 4 | 239 | 143508 | 1031.0 | 727 | 709 | 138.5 |
| B | 0 | 219 | 42961 | 305.06 | 727 | 709 | 138.5 |
| B | 0 | 214 | 20710 | 144.41 | 727 | 709 | 138.5 |
| C | 14 | 67 | 36940 | 221.13 | 708 | 713 | 163.8 |
| C | 14 | 234 | 8438 | 47.15 | 708 | 713 | 163.8 |
| C | 13 | 61 | 5332 | 28.19 | 708 | 713 | 163.8 |
| D | 1 | 52 | 11700727 | 120831.3 | 402 | 390 | 96.8 |
| D | 8 | 195 | 167118 | 1721.83 | 402 | 390 | 96.8 |
| D | 12 | 233 | 44810 | 458.73 | 402 | 390 | 96.8 |
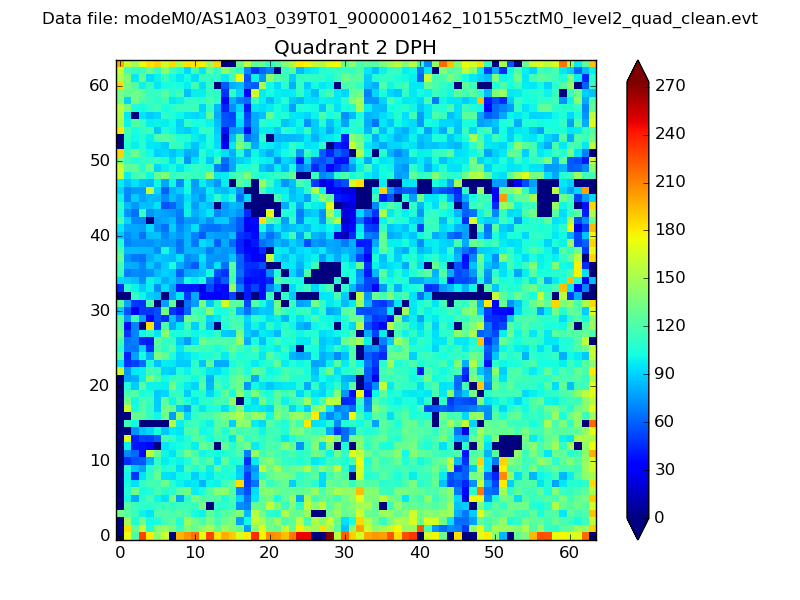
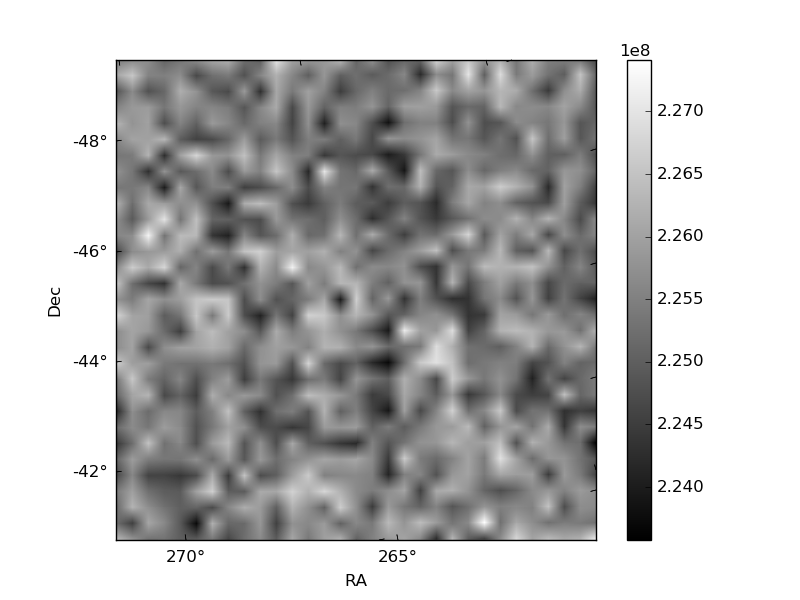
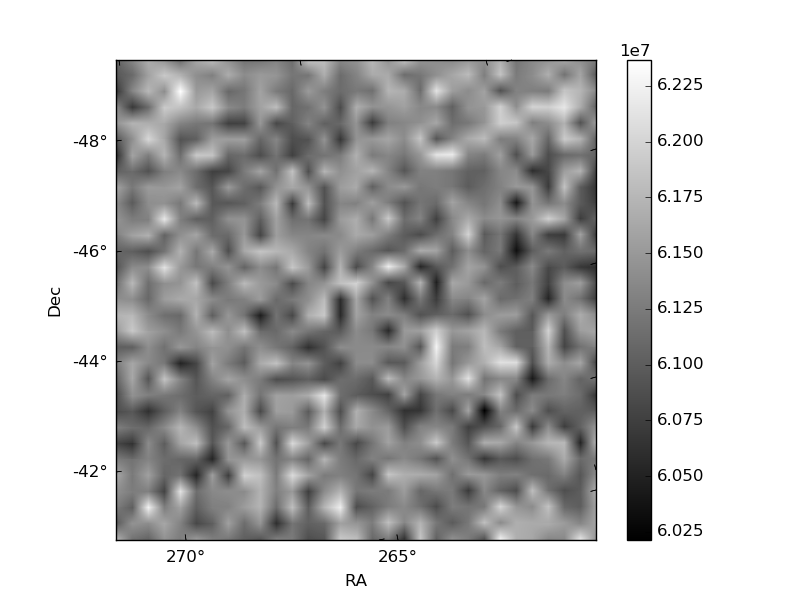
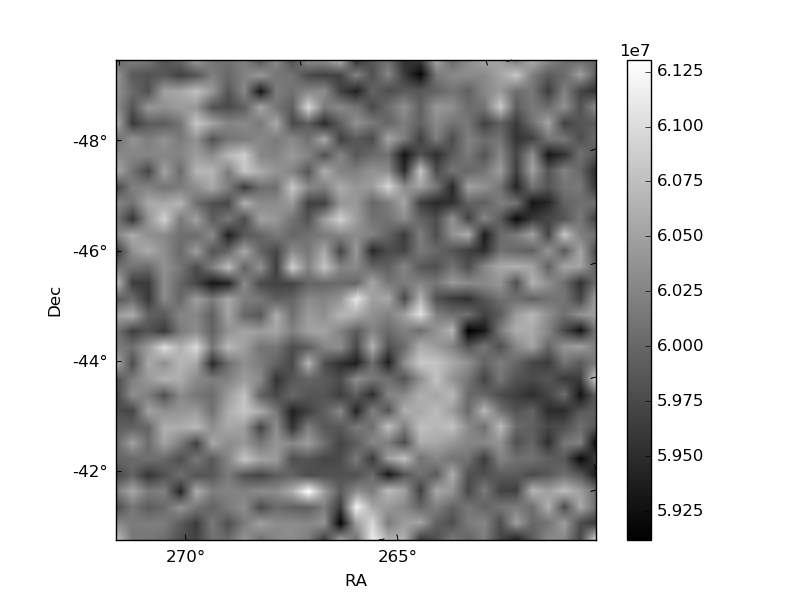
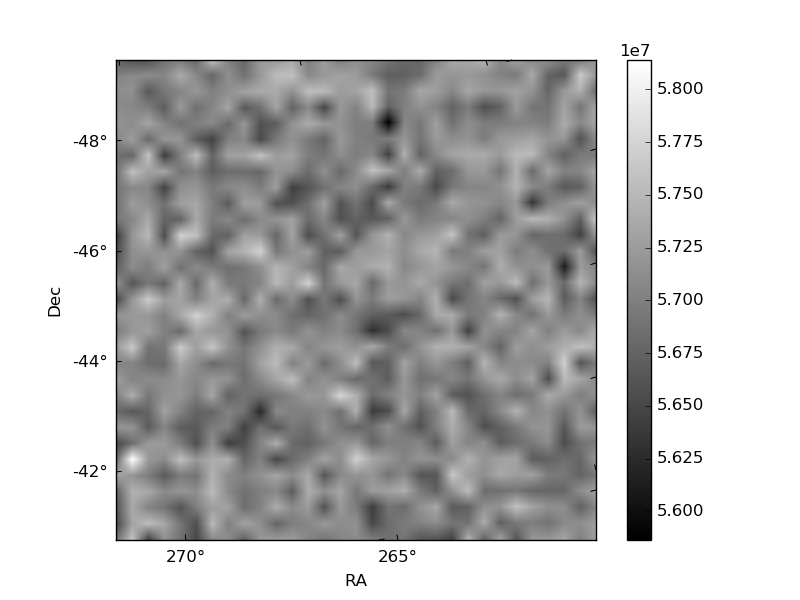
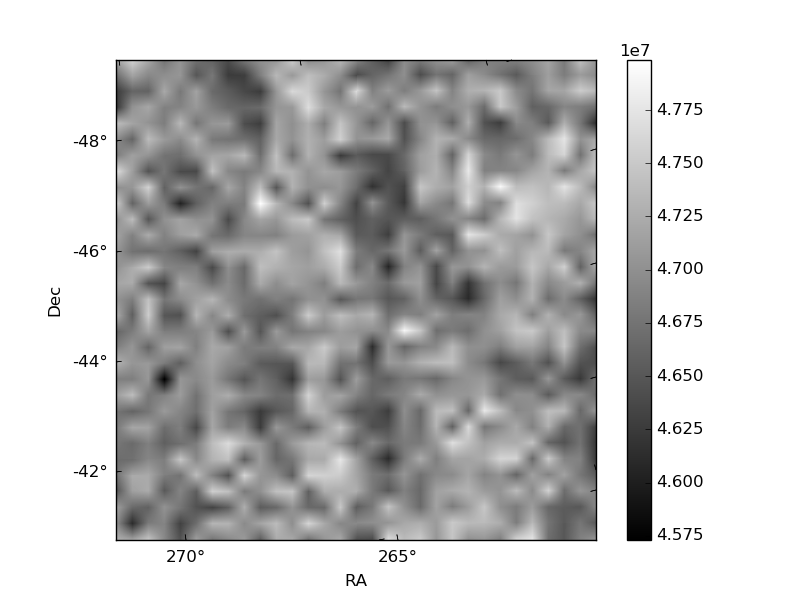
Histogram calculated using DETX and DETY for each event in the final _common_clean file
| Quadrant A | 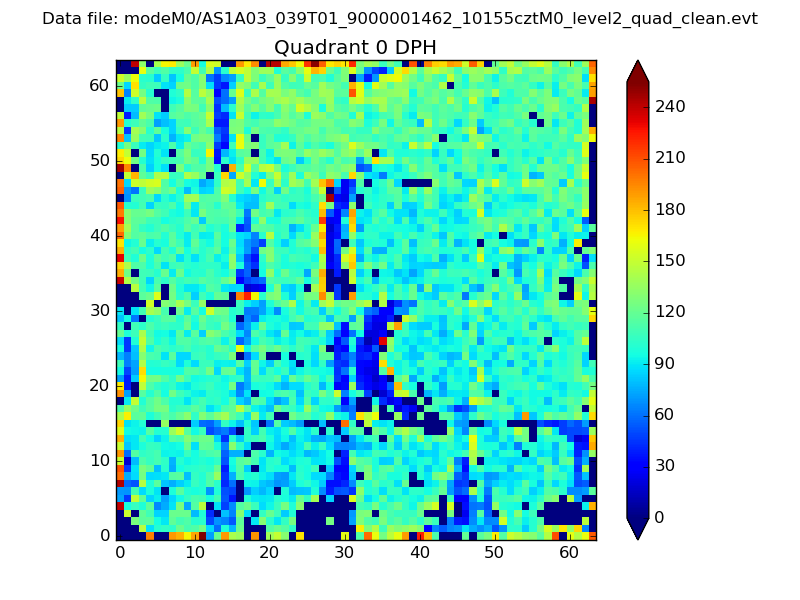 |
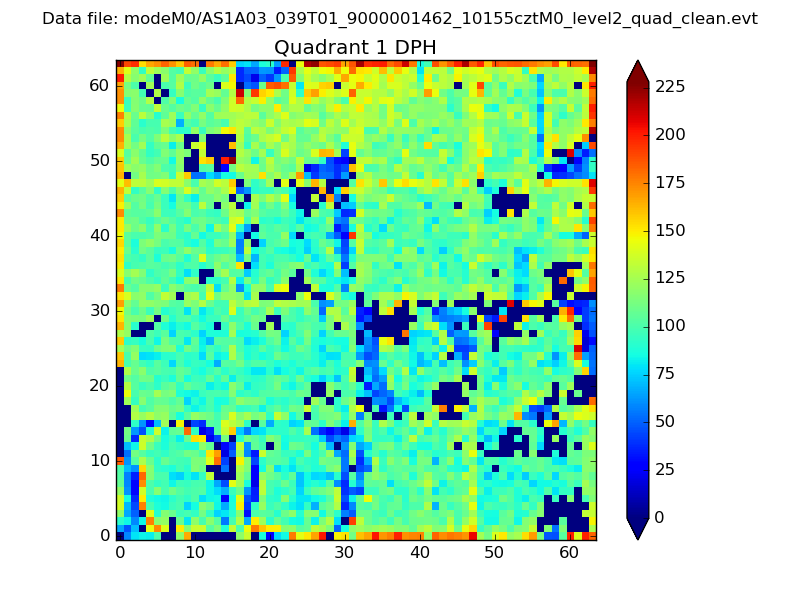 |
Quadrant B |
|---|---|---|---|
| Quadrant D | 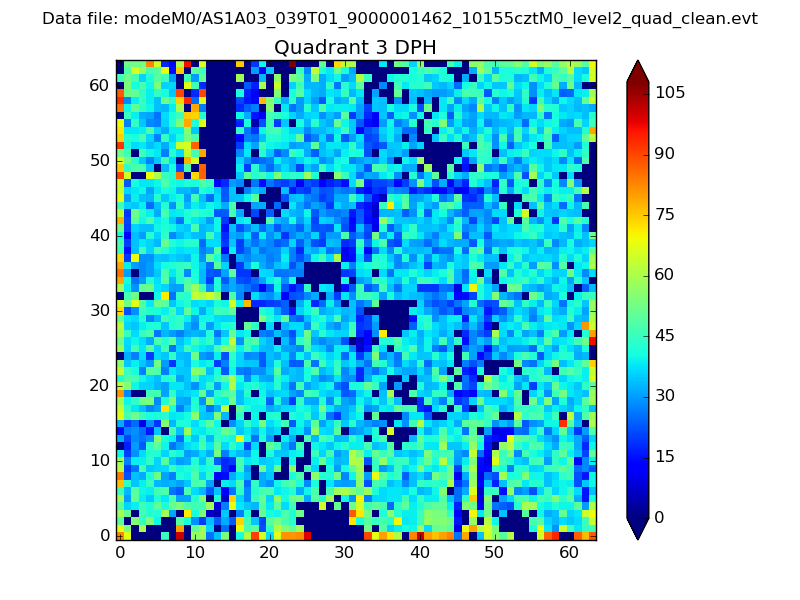 |
 |
Quadrant C |
| Plot type | Count rate plots | Images |
|---|---|---|
| Comparison with Poisson distribution Blue bars denote a histogram of data divided into 1 sec bins. Red curve is a Poisson curve with rate = median count rate of data. |
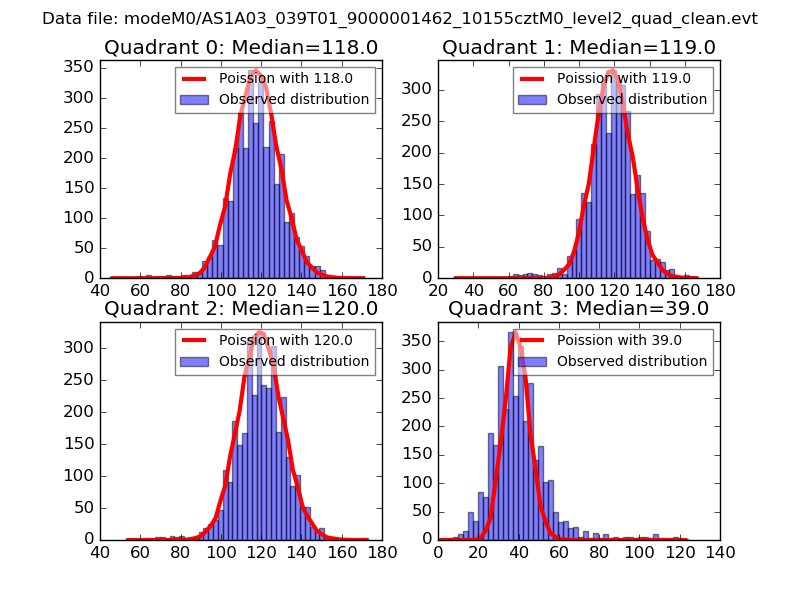 |
 |
| Quadrant-wise count rates Data is divided into 100 sec bins |
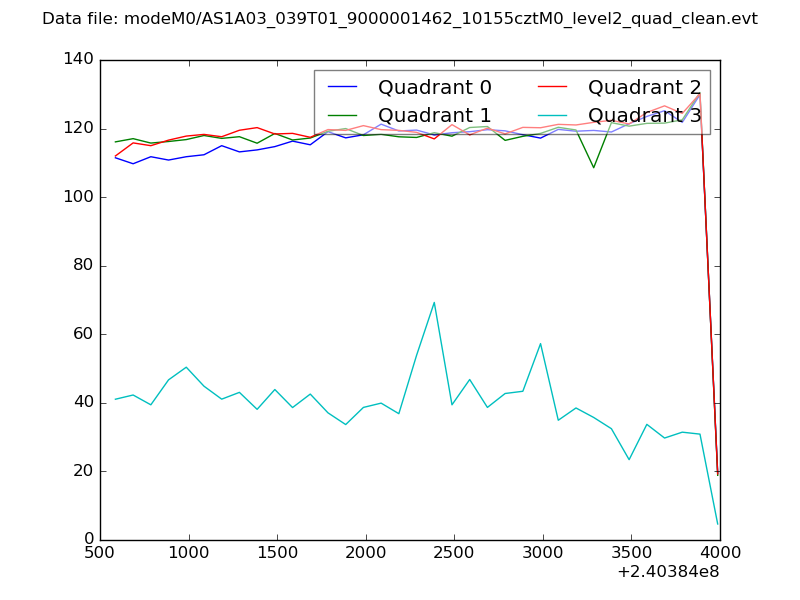 |
|
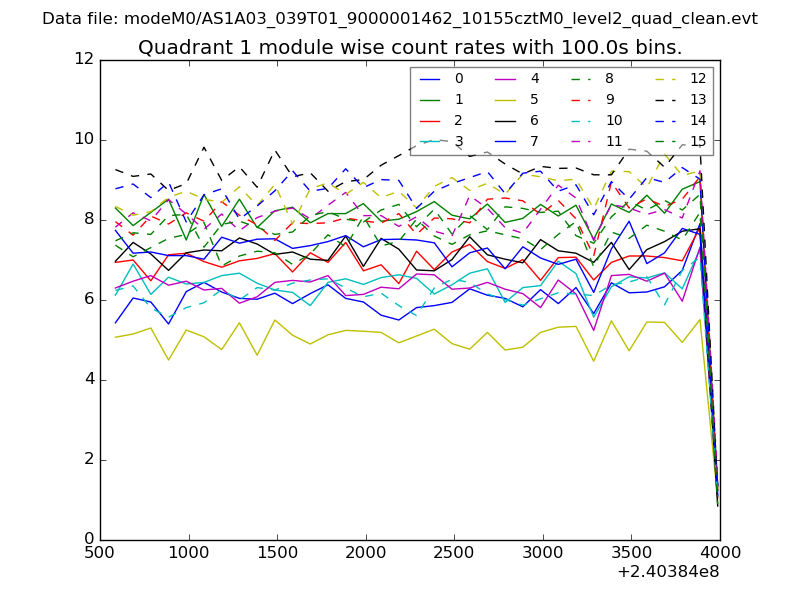
| Module-wise count rates for Quadrant A Data is divided into 100 sec bins |
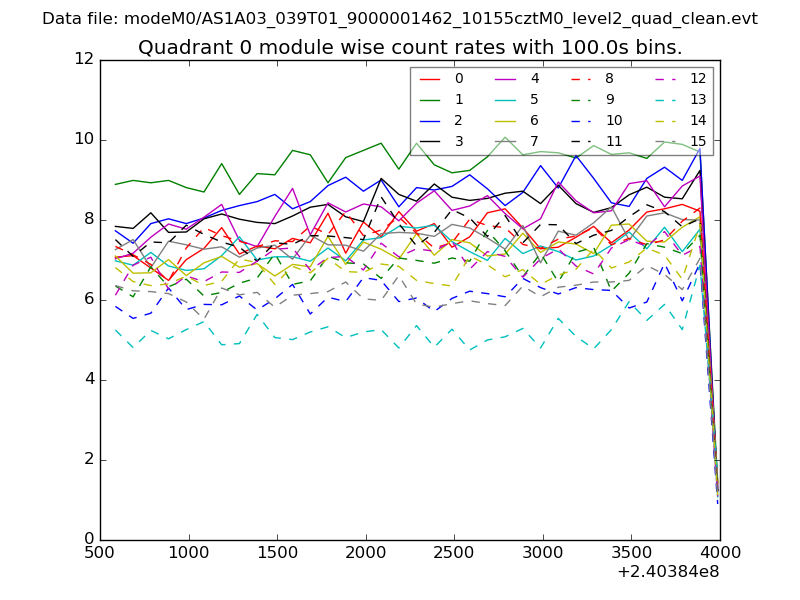 |
 |
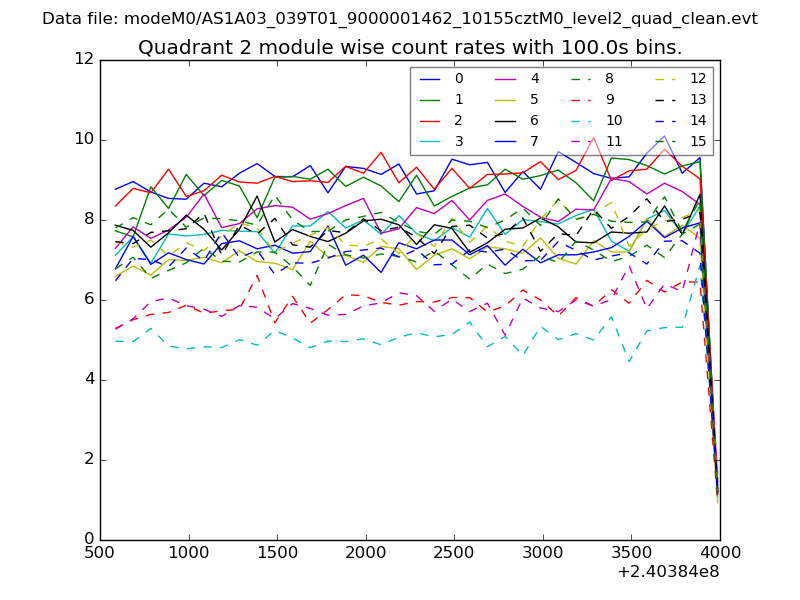
| Module-wise count rates for Quadrant B Data is divided into 100 sec bins |
 |
 |
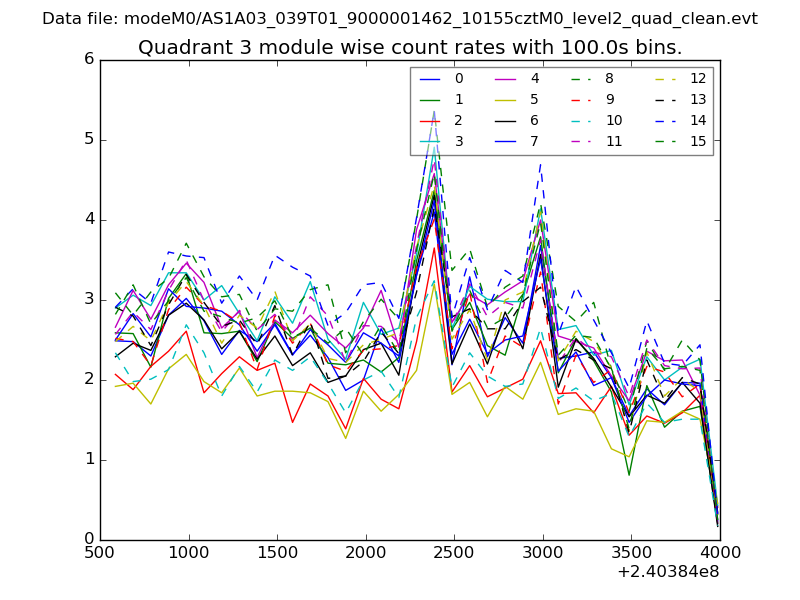
| Module-wise count rates for Quadrant C Data is divided into 100 sec bins |
 |
 |
| Module-wise count rates for Quadrant D Data is divided into 100 sec bins |
 |
 |
| Parameter | Plot |
|---|---|
| CZT HV Monitor | 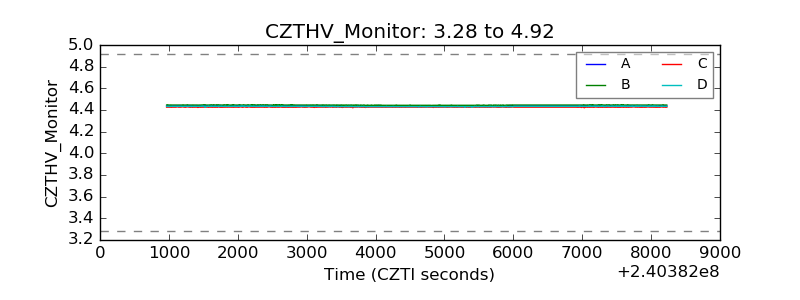 |
| D_VDD | 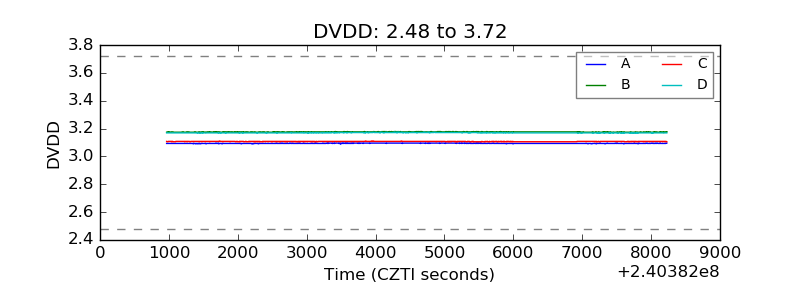 |
| Temperature 1 | 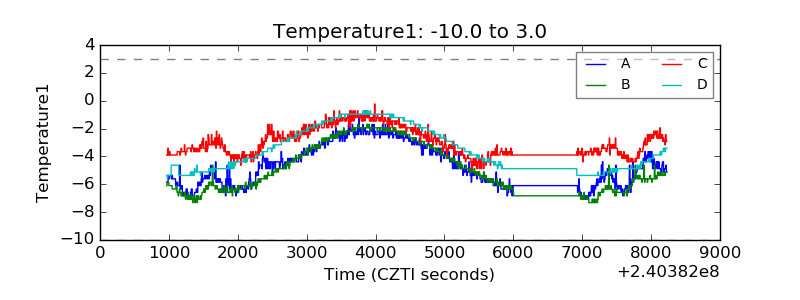 |
| Veto HV Monitor | 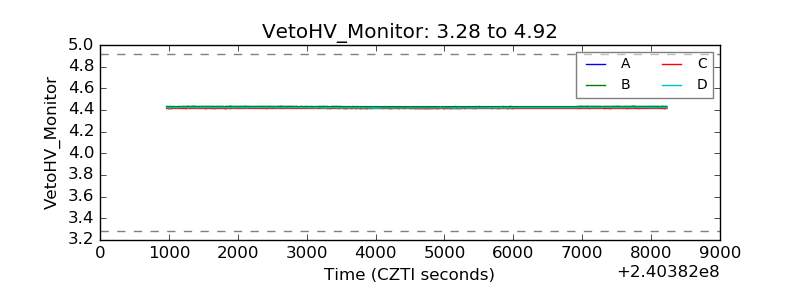 |
| Veto LLD | 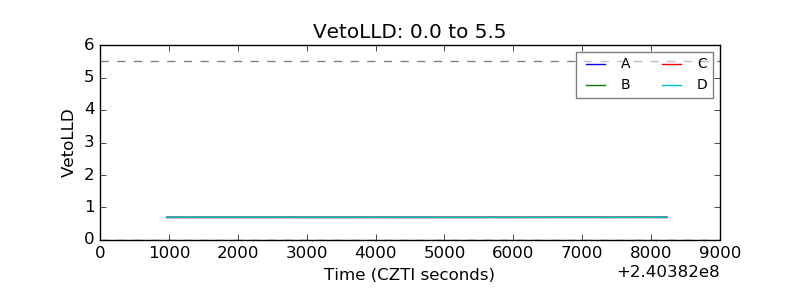 |
| Alpha Counter | 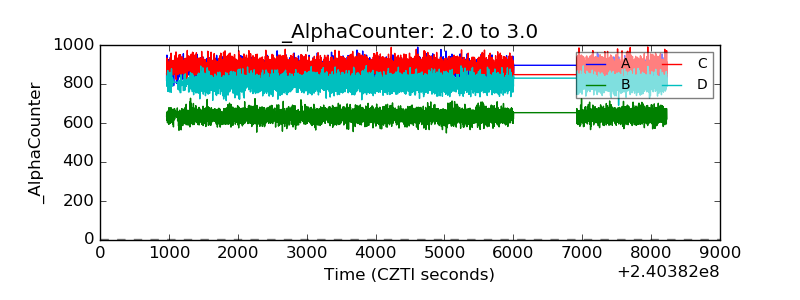 |
| _CPM_Rate | 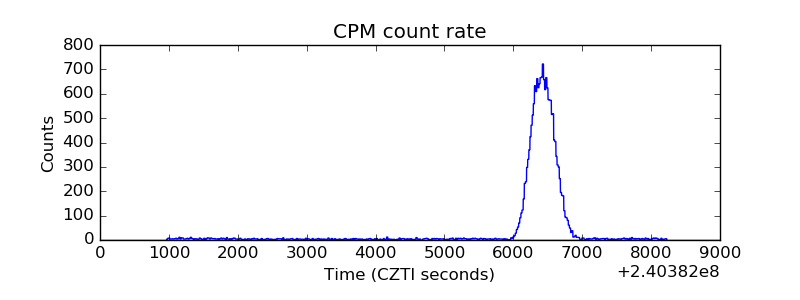 |
| CZT Counter | 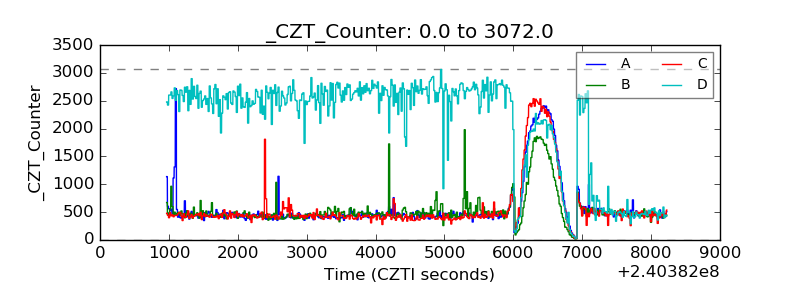 |
| +2.5 Volts monitor | 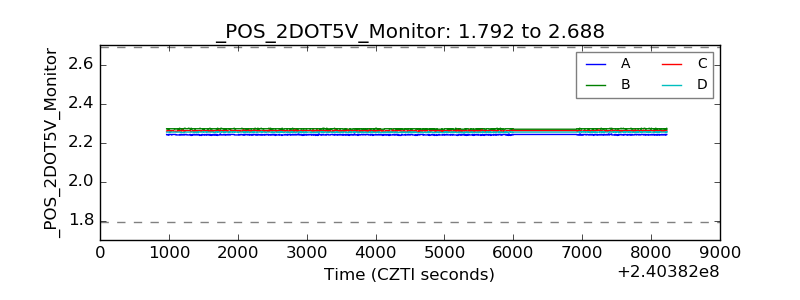 |
| +5 Volts monitor |  |
| _ROLL_ROT | 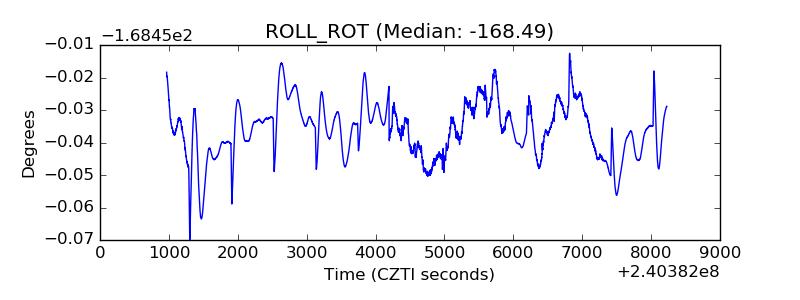 |
| _Roll_DEC | 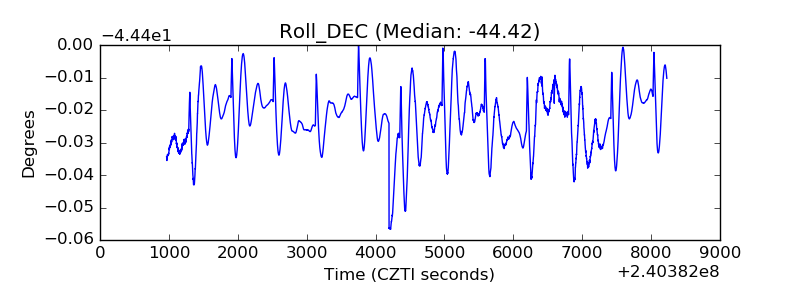 |
| _Roll_RA | 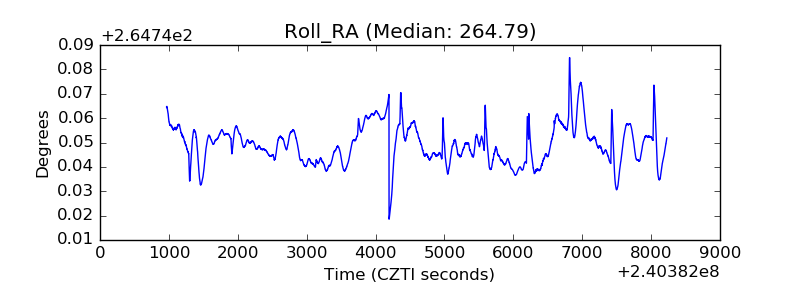 |
| Veto Counter | 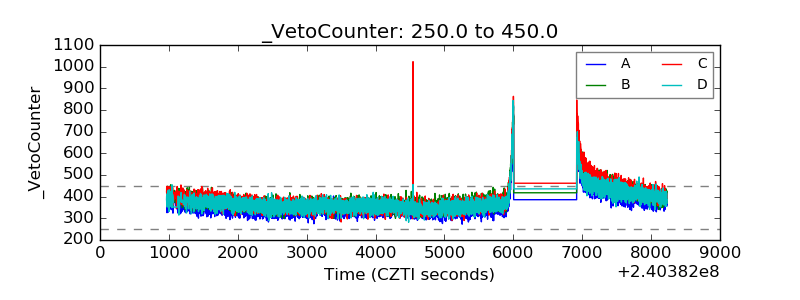 |