| Param | Original file | Final file |
|---|---|---|
| Filename | modeM0/AS1A03_039T01_9000001462_10158cztM0_level2.evt | modeM0/AS1A03_039T01_9000001462_10158cztM0_level2_quad_clean.evt |
| Size (bytes) | 454,858,560 | 92,433,600 |
| Size | 433.8 MB | 88.2 MB |
| Events in quadrant A | 3,155,400 | 590,057 |
| Events in quadrant B | 3,448,568 | 596,138 |
| Events in quadrant C | 3,078,655 | 596,436 |
| Events in quadrant D | 3,656,736 | 568,858 |
| Mode SS | |||
|---|---|---|---|
| Quadrant | BADHDUFLAG | Total packets | Discarded packets |
| A | 0 | 130 | 0 |
| B | 0 | 130 | 0 |
| C | 0 | 130 | 0 |
| D | 0 | 130 | 0 |
| Mode M0 | |||
|---|---|---|---|
| Quadrant | BADHDUFLAG | Total packets | Discarded packets |
| A | 0 | 13523 | 5 |
| B | 0 | 14210 | 2 |
| C | 0 | 13442 | 8 |
| D | 0 | 15007 | 7 |
| Mode M9 | |||
|---|---|---|---|
| Quadrant | BADHDUFLAG | Total packets | Discarded packets |
| A | 0 | 18 | 0 |
| B | 0 | 18 | 0 |
| C | 0 | 18 | 0 |
| D | 0 | 19 | 0 |
| Quadrant | Total seconds | Saturated seconds | Saturation percentage |
|---|---|---|---|
| A | 6419 | 68 | 1.059355% |
| B | 6420 | 97 | 1.510903% |
| C | 6417 | 64 | 0.997351% |
| D | 6418 | 119 | 1.854160% |
Noise dominated data is calculated using 1-second bins in cleaned event files. If a bin has >2000 counts, and if more than 50% of those come from <1% of pixels, then it is considered to be noise-dominated and hence unusable.
| Quadrant | # 1 sec bins | Bins with >0 counts | Bins with >2000 counts | High rate bins dominated by noise | Noise dominated (total time) | Noise dominated (detector-on time) | Marked lightcurve |
|---|---|---|---|---|---|---|---|
| A | 7575 | 6420 | 1 | 1 | 0.01% | 0.02% | 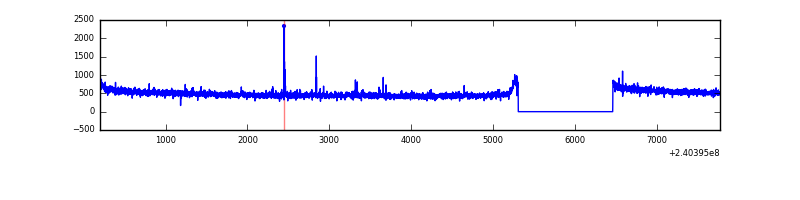 |
| B | 7575 | 6420 | 14 | 14 | 0.18% | 0.22% | 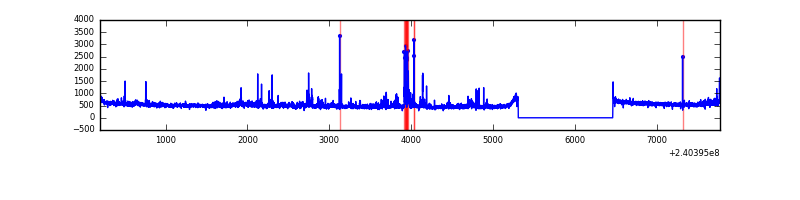 |
| C | 7575 | 6420 | 0 | 0 | 0.00% | 0.00% |  |
| D | 7575 | 6420 | 30 | 30 | 0.40% | 0.47% | 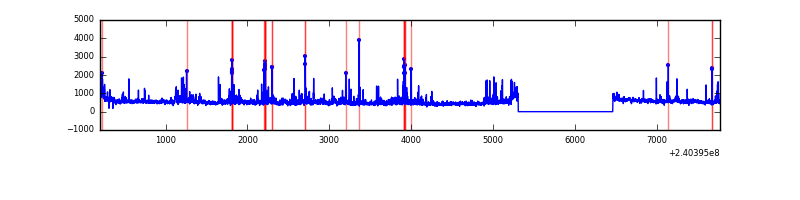 |
Top three noisy pixels from each quadrant. If the there are fewer than three noisy pixels in the level2.evt file, extra rows are filled as -1
| Pixel properties | Quadrant properties | ||||||
|---|---|---|---|---|---|---|---|
| Quadrant | DetID | PixID | Counts | Sigma | Mean | Median | Sigma |
| A | 8 | 15 | 21943 | 130.0 | 808 | 791 | 162.7 |
| A | 15 | 223 | 11080 | 63.23 | 808 | 791 | 162.7 |
| A | 0 | 226 | 7412 | 40.69 | 808 | 791 | 162.7 |
| B | 4 | 239 | 84146 | 553.66 | 806 | 788 | 150.6 |
| B | 4 | 81 | 83423 | 548.86 | 806 | 788 | 150.6 |
| B | 0 | 214 | 76859 | 505.26 | 806 | 788 | 150.6 |
| C | 14 | 67 | 12425 | 64.56 | 785 | 790 | 180.2 |
| C | 14 | 234 | 6586 | 32.16 | 785 | 790 | 180.2 |
| C | 13 | 61 | 6053 | 29.2 | 785 | 790 | 180.2 |
| D | 1 | 52 | 258585 | 1269.34 | 773 | 758 | 203.1 |
| D | 8 | 195 | 118554 | 579.94 | 773 | 758 | 203.1 |
| D | 2 | 16 | 107051 | 523.3 | 773 | 758 | 203.1 |
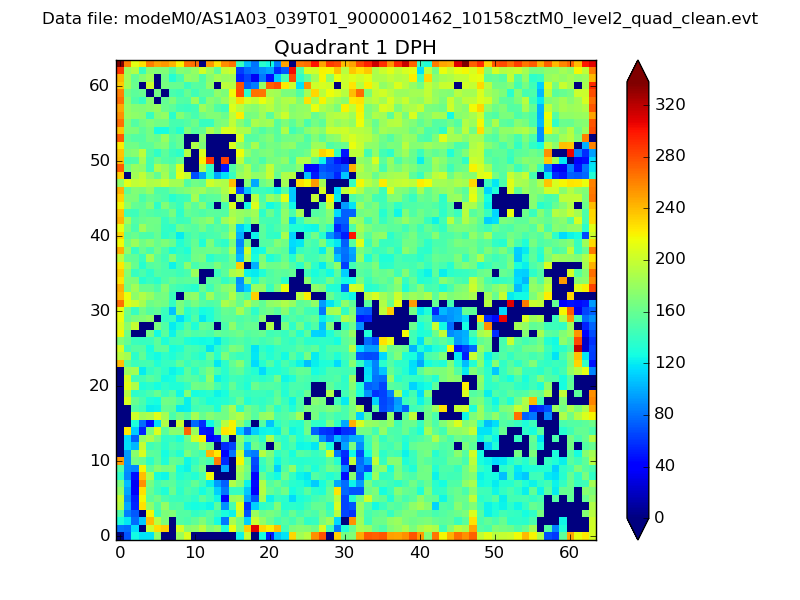
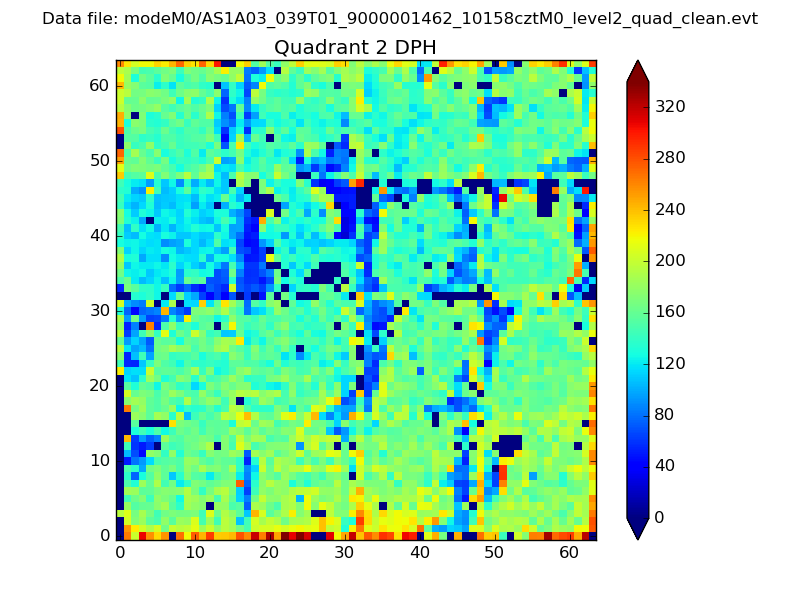
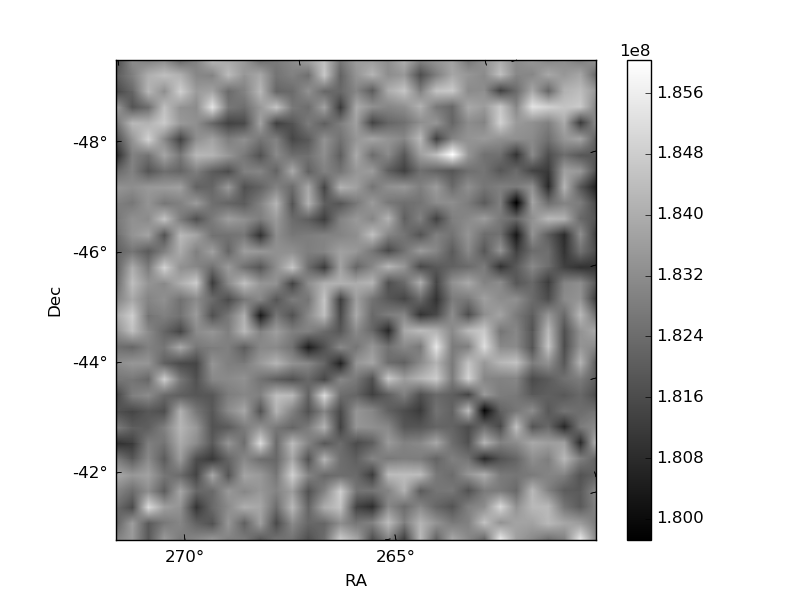
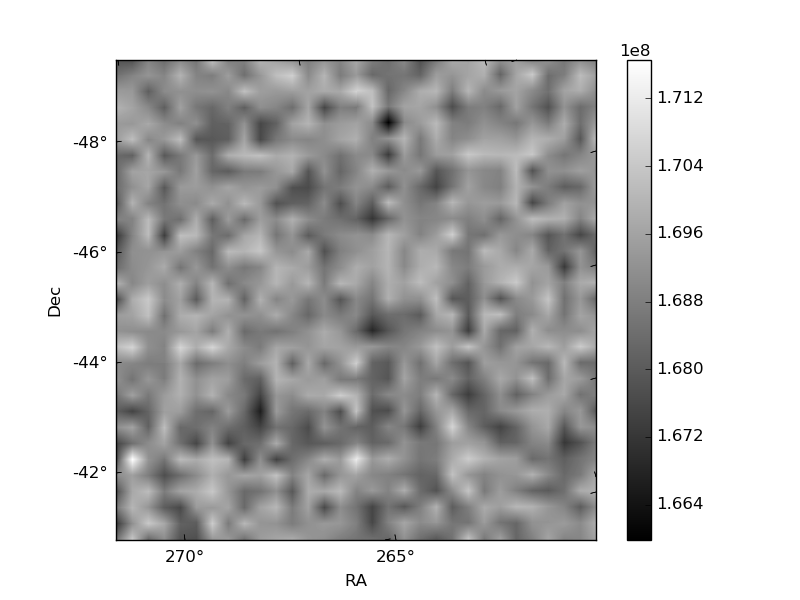
Histogram calculated using DETX and DETY for each event in the final _common_clean file
| Quadrant A |  |
 |
Quadrant B |
|---|---|---|---|
| Quadrant D |  |
 |
Quadrant C |
| Plot type | Count rate plots | Images |
|---|---|---|
| Comparison with Poisson distribution Blue bars denote a histogram of data divided into 1 sec bins. Red curve is a Poisson curve with rate = median count rate of data. |
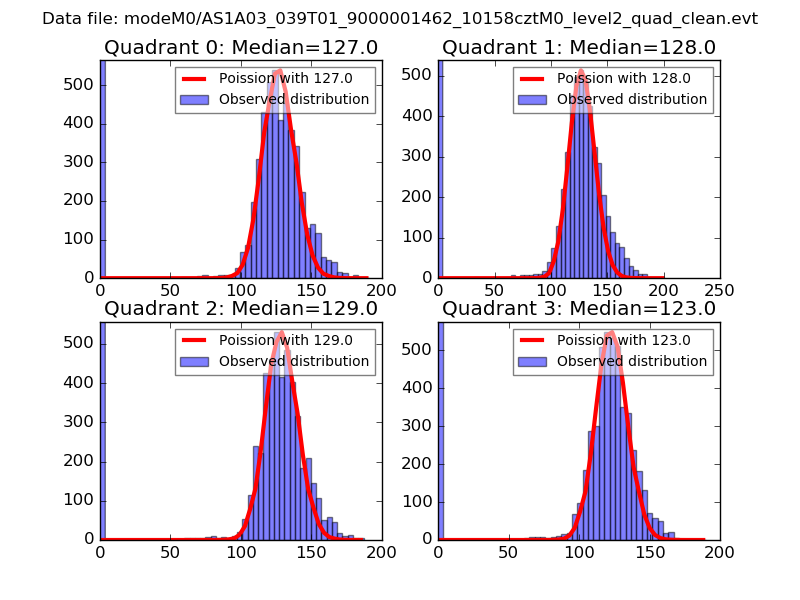 |
 |
| Quadrant-wise count rates Data is divided into 100 sec bins |
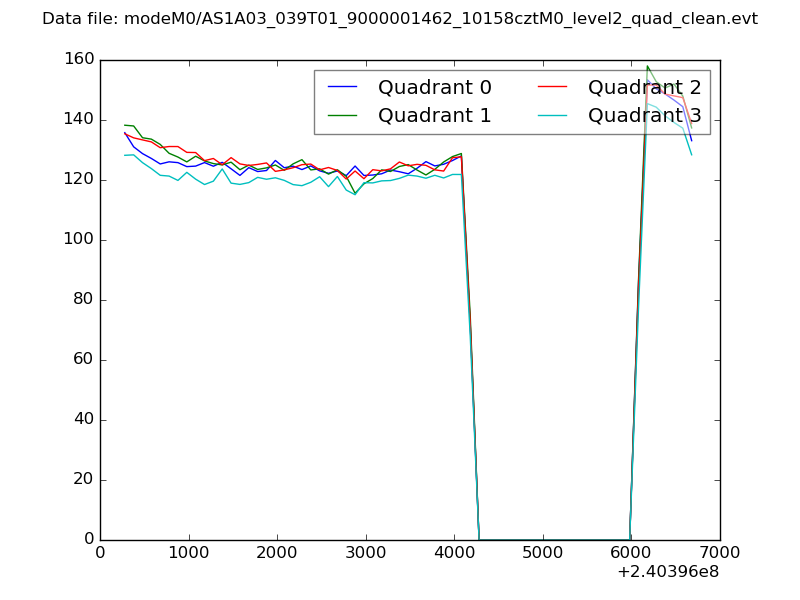 |
|
| Module-wise count rates for Quadrant A Data is divided into 100 sec bins |
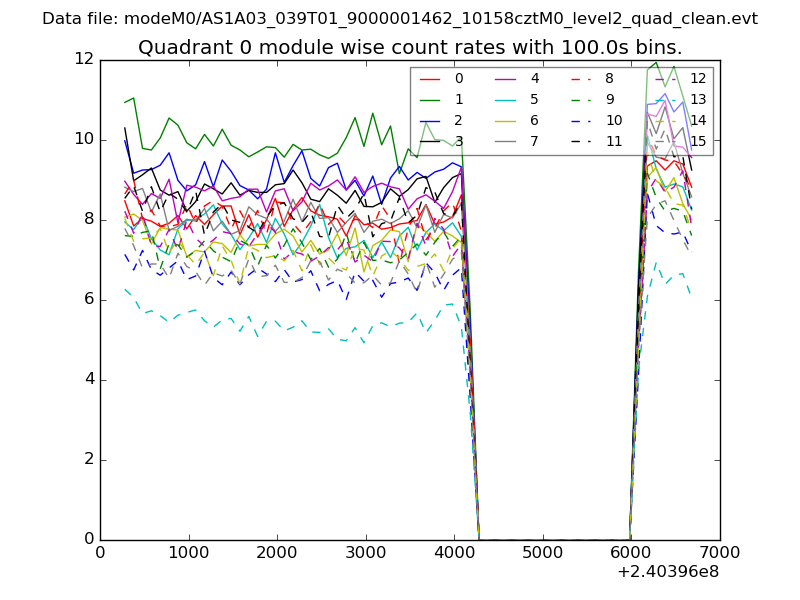 |
 |
| Module-wise count rates for Quadrant B Data is divided into 100 sec bins |
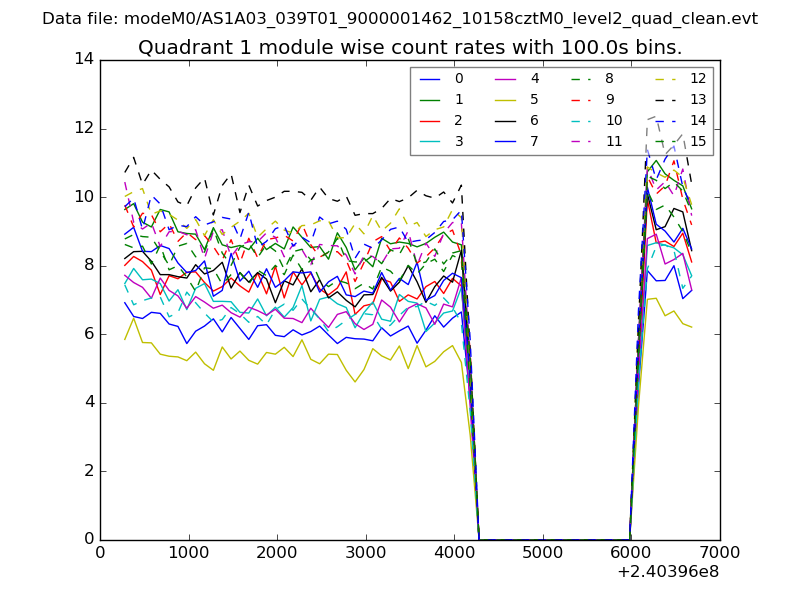 |
 |
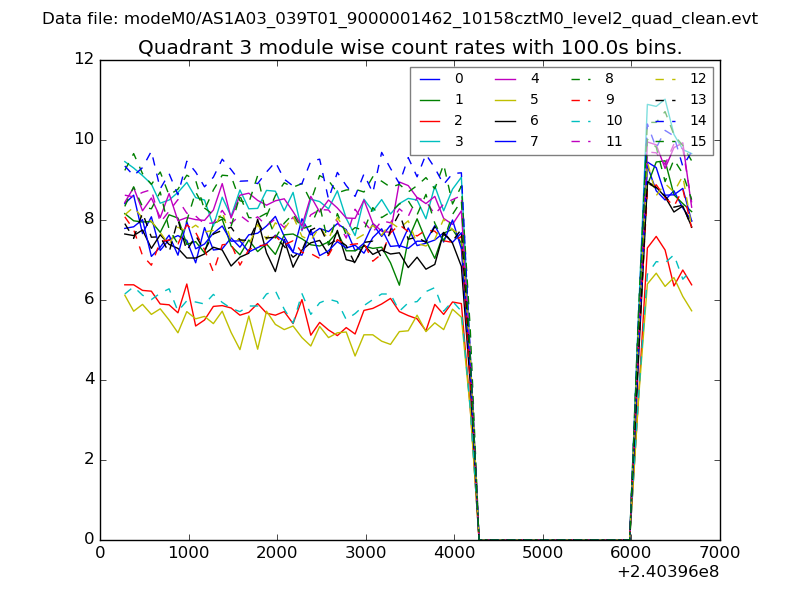
| Module-wise count rates for Quadrant C Data is divided into 100 sec bins |
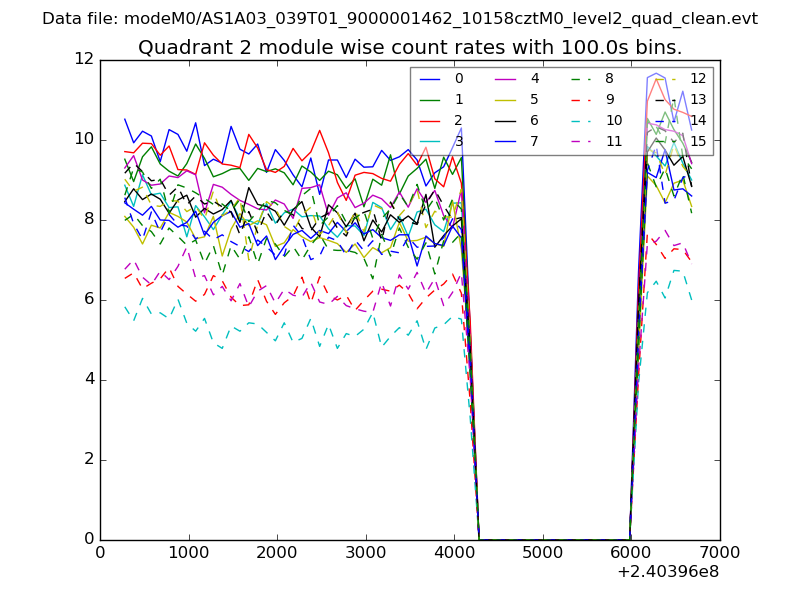 |
 |
| Module-wise count rates for Quadrant D Data is divided into 100 sec bins |
 |
 |
| Parameter | Plot |
|---|---|
| CZT HV Monitor | 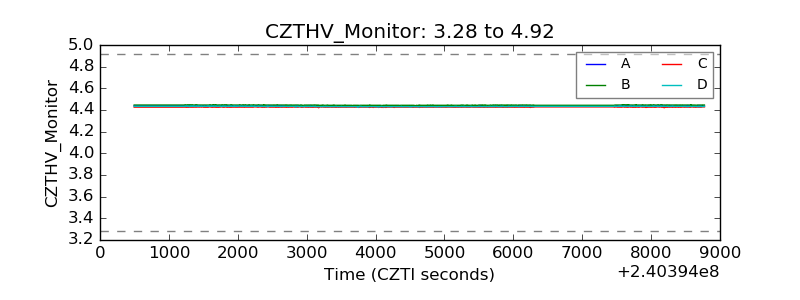 |
| D_VDD | 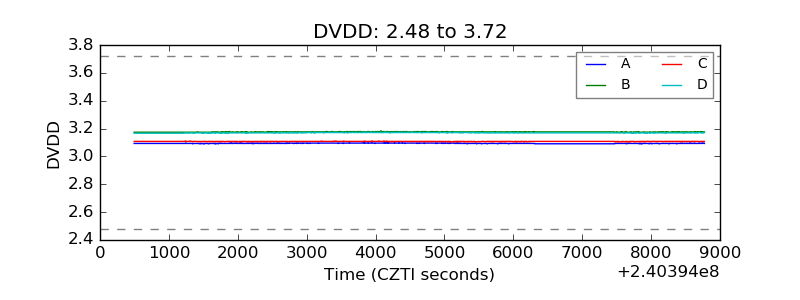 |
| Temperature 1 | 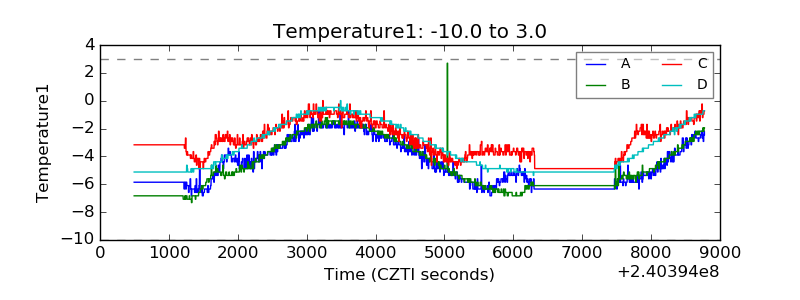 |
| Veto HV Monitor | 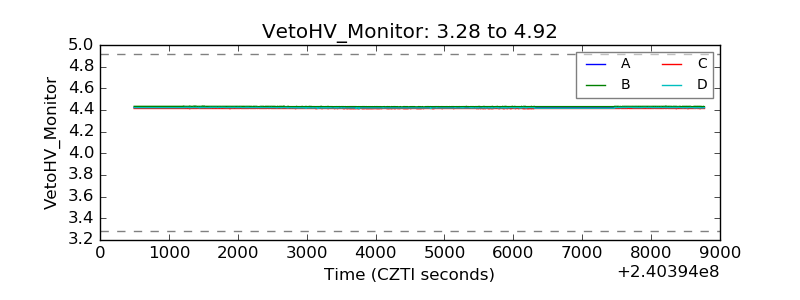 |
| Veto LLD | 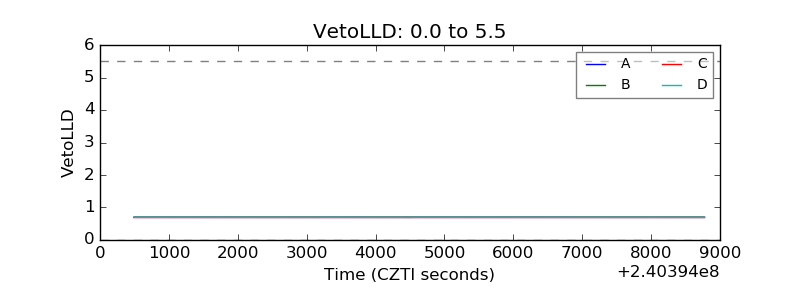 |
| Alpha Counter | 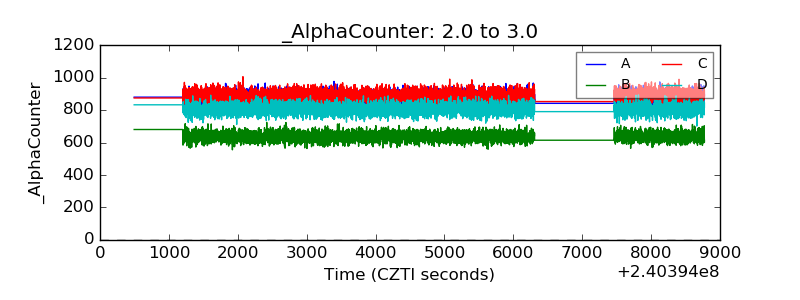 |
| _CPM_Rate | 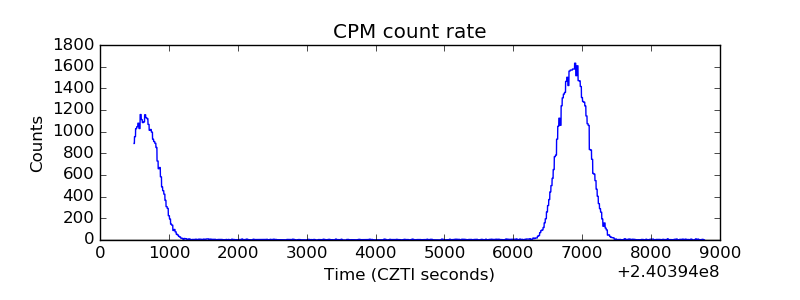 |
| CZT Counter | 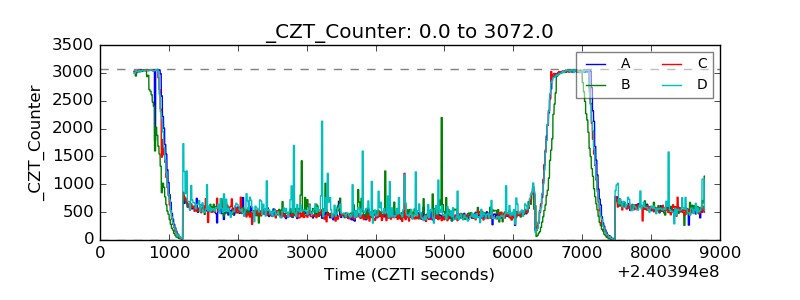 |
| +2.5 Volts monitor |  |
| +5 Volts monitor |  |
| _ROLL_ROT | 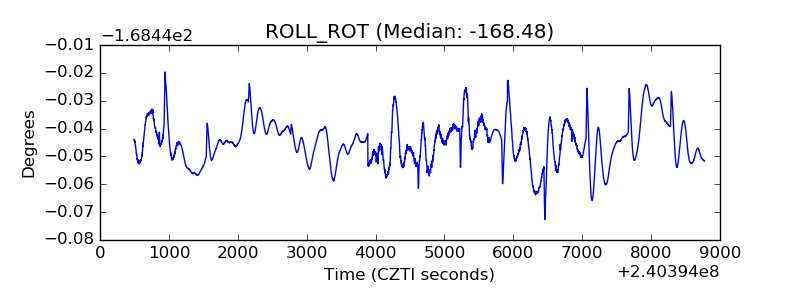 |
| _Roll_DEC | 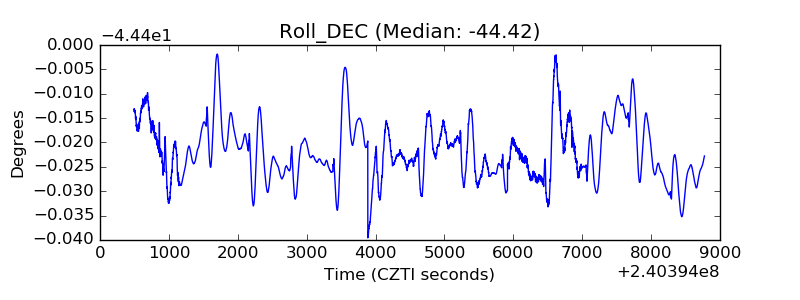 |
| _Roll_RA | 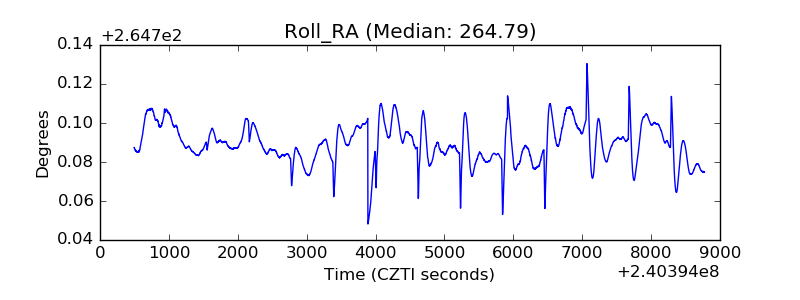 |
| Veto Counter | 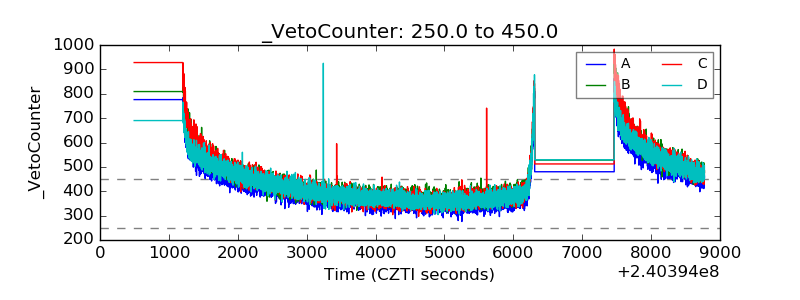 |