| Param | Original file | Final file |
|---|---|---|
| Filename | modeM0/AS1A03_039T01_9000001462_10161cztM0_level2.evt | modeM0/AS1A03_039T01_9000001462_10161cztM0_level2_quad_clean.evt |
| Size (bytes) | 471,430,080 | 109,362,240 |
| Size | 449.6 MB | 104.3 MB |
| Events in quadrant A | 3,172,456 | 729,338 |
| Events in quadrant B | 3,429,117 | 734,521 |
| Events in quadrant C | 2,986,694 | 722,098 |
| Events in quadrant D | 4,259,485 | 684,786 |
| Mode SS | |||
|---|---|---|---|
| Quadrant | BADHDUFLAG | Total packets | Discarded packets |
| A | 0 | 128 | 0 |
| B | 0 | 128 | 0 |
| C | 0 | 128 | 0 |
| D | 0 | 128 | 0 |
| Mode M0 | |||
|---|---|---|---|
| Quadrant | BADHDUFLAG | Total packets | Discarded packets |
| A | 0 | 13554 | 1 |
| B | 0 | 14444 | 0 |
| C | 0 | 13116 | 0 |
| D | 0 | 16919 | 0 |
| Mode M9 | |||
|---|---|---|---|
| Quadrant | BADHDUFLAG | Total packets | Discarded packets |
| A | 0 | 13 | 0 |
| B | 0 | 13 | 0 |
| C | 0 | 13 | 0 |
| D | 0 | 13 | 0 |
| Quadrant | Total seconds | Saturated seconds | Saturation percentage |
|---|---|---|---|
| A | 6328 | 96 | 1.517067% |
| B | 6328 | 103 | 1.627686% |
| C | 6328 | 51 | 0.805942% |
| D | 6328 | 165 | 2.607459% |
Noise dominated data is calculated using 1-second bins in cleaned event files. If a bin has >2000 counts, and if more than 50% of those come from <1% of pixels, then it is considered to be noise-dominated and hence unusable.
| Quadrant | # 1 sec bins | Bins with >0 counts | Bins with >2000 counts | High rate bins dominated by noise | Noise dominated (total time) | Noise dominated (detector-on time) | Marked lightcurve |
|---|---|---|---|---|---|---|---|
| A | 7598 | 6328 | 4 | 4 | 0.05% | 0.06% |  |
| B | 7598 | 6329 | 8 | 8 | 0.11% | 0.13% | 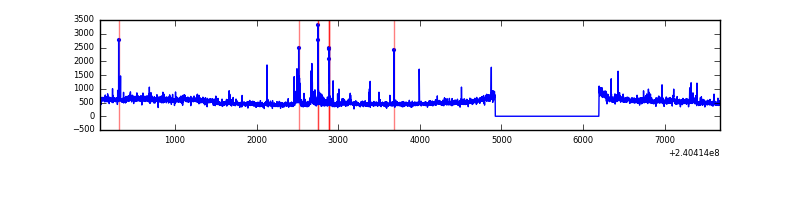 |
| C | 7598 | 6329 | 1 | 1 | 0.01% | 0.02% | 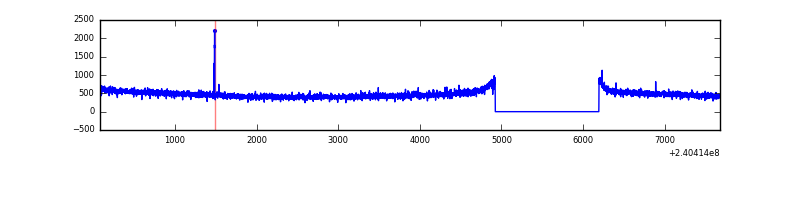 |
| D | 7598 | 6329 | 64 | 64 | 0.84% | 1.01% |  |
Top three noisy pixels from each quadrant. If the there are fewer than three noisy pixels in the level2.evt file, extra rows are filled as -1
| Pixel properties | Quadrant properties | ||||||
|---|---|---|---|---|---|---|---|
| Quadrant | DetID | PixID | Counts | Sigma | Mean | Median | Sigma |
| A | 15 | 223 | 32685 | 198.16 | 800 | 786 | 161.0 |
| A | 8 | 15 | 19453 | 115.96 | 800 | 786 | 161.0 |
| A | 15 | 239 | 13530 | 79.17 | 800 | 786 | 161.0 |
| B | 4 | 239 | 128487 | 860.75 | 793 | 775 | 148.4 |
| B | 0 | 219 | 74830 | 499.11 | 793 | 775 | 148.4 |
| B | 0 | 214 | 59568 | 396.25 | 793 | 775 | 148.4 |
| C | 1 | 3 | 11677 | 62.95 | 760 | 765 | 173.3 |
| C | 14 | 67 | 6840 | 35.05 | 760 | 765 | 173.3 |
| C | 13 | 61 | 5654 | 28.2 | 760 | 765 | 173.3 |
| D | 8 | 195 | 531802 | 2916.31 | 763 | 741 | 182.1 |
| D | 1 | 52 | 234977 | 1286.3 | 763 | 741 | 182.1 |
| D | 2 | 16 | 172167 | 941.38 | 763 | 741 | 182.1 |
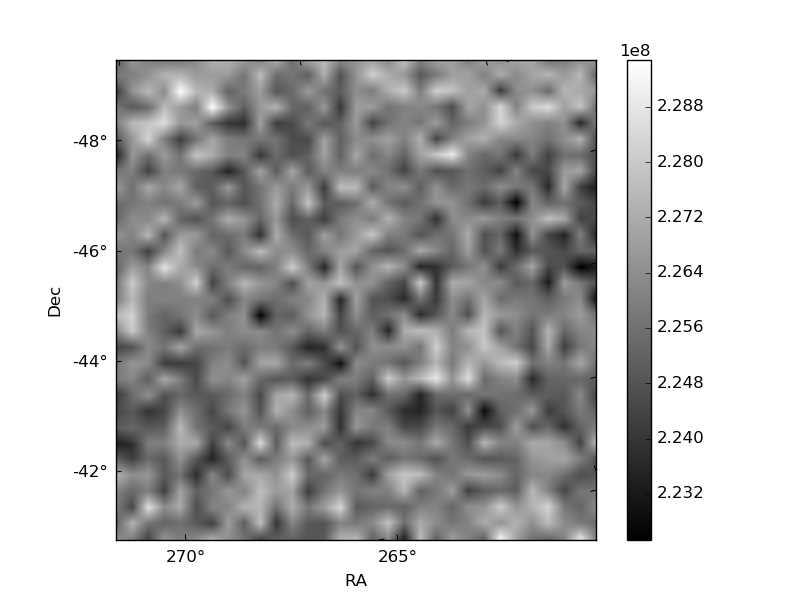
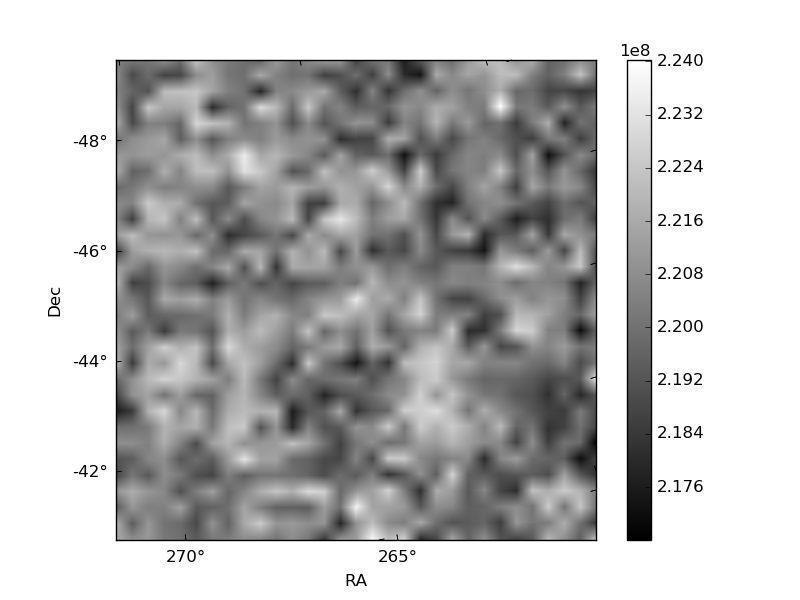
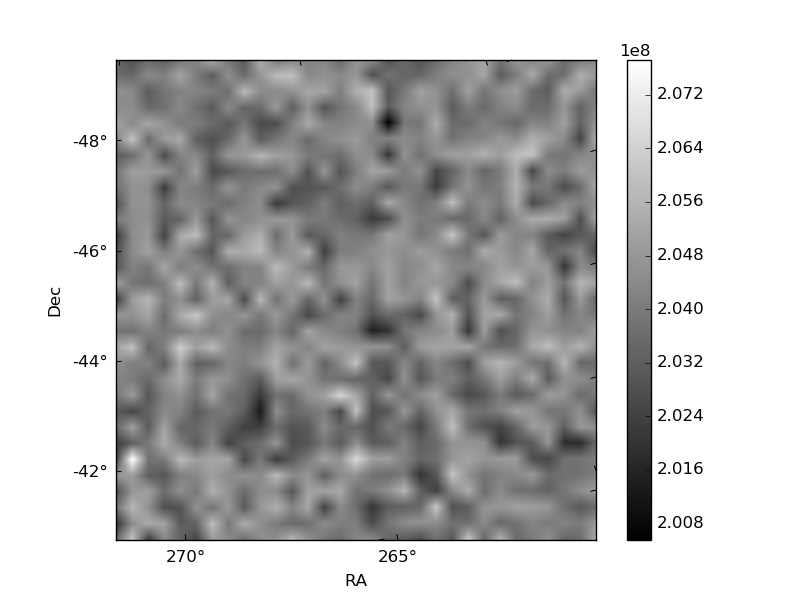
Histogram calculated using DETX and DETY for each event in the final _common_clean file
| Quadrant A | 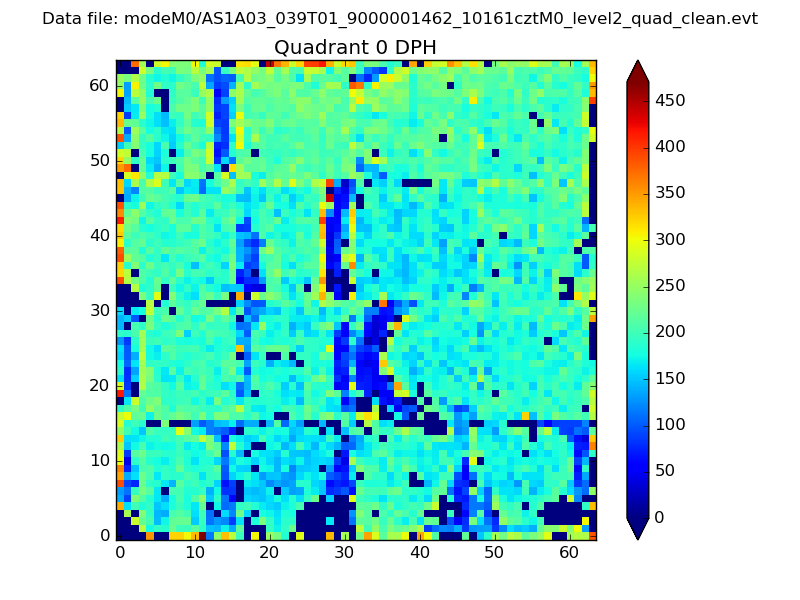 |
 |
Quadrant B |
|---|---|---|---|
| Quadrant D | 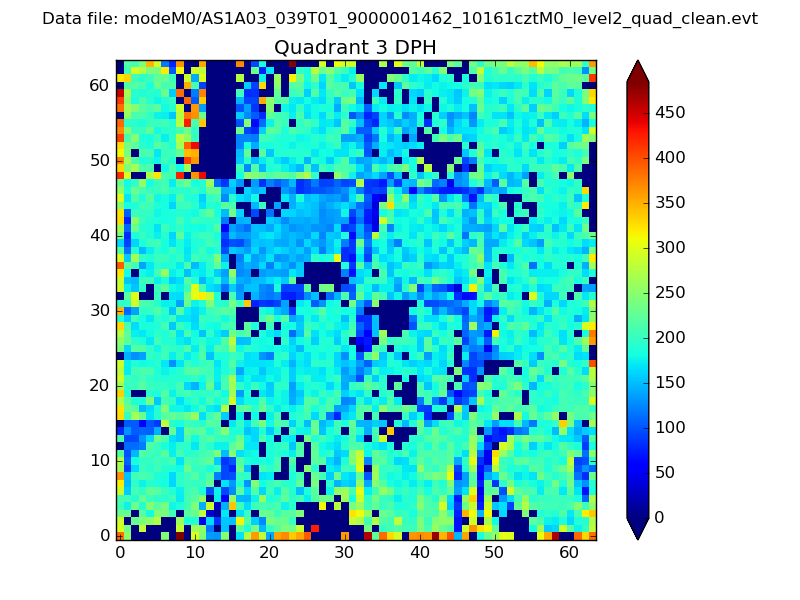 |
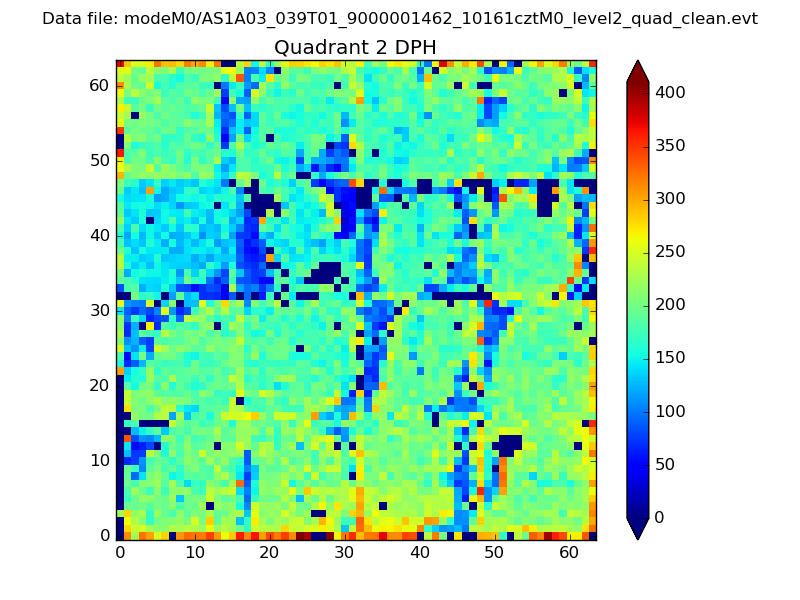 |
Quadrant C |
| Plot type | Count rate plots | Images |
|---|---|---|
| Comparison with Poisson distribution Blue bars denote a histogram of data divided into 1 sec bins. Red curve is a Poisson curve with rate = median count rate of data. |
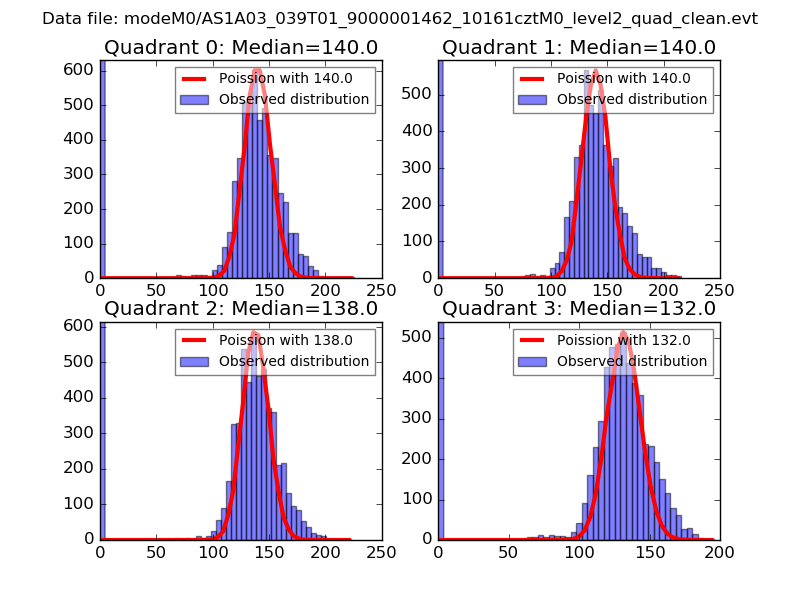 |
 |
| Quadrant-wise count rates Data is divided into 100 sec bins |
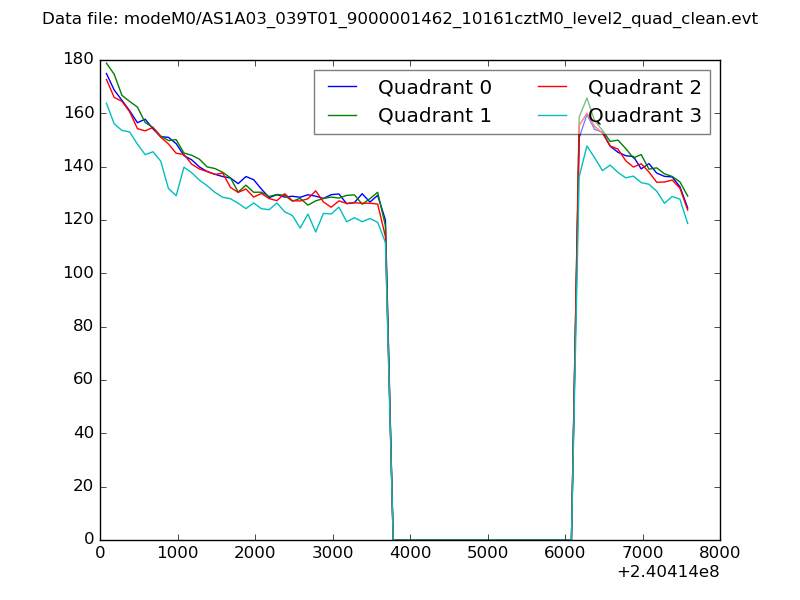 |
|
| Module-wise count rates for Quadrant A Data is divided into 100 sec bins |
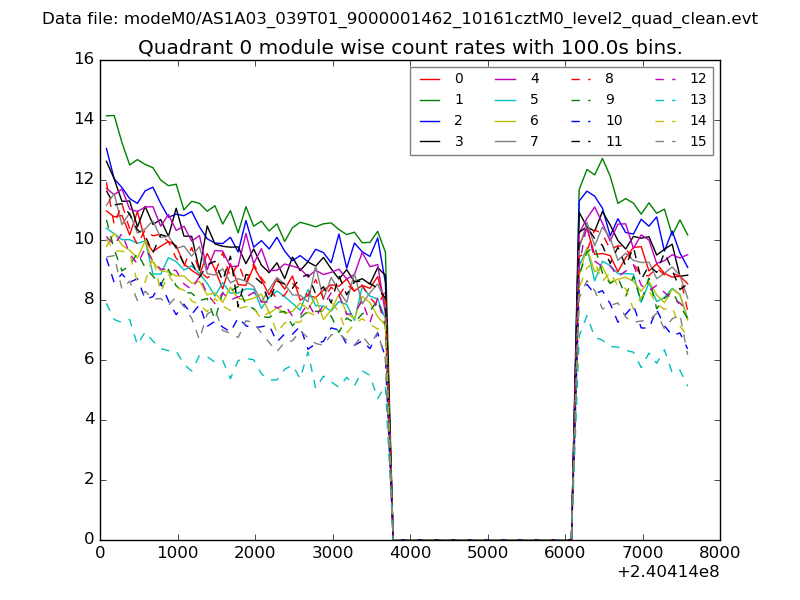 |
 |
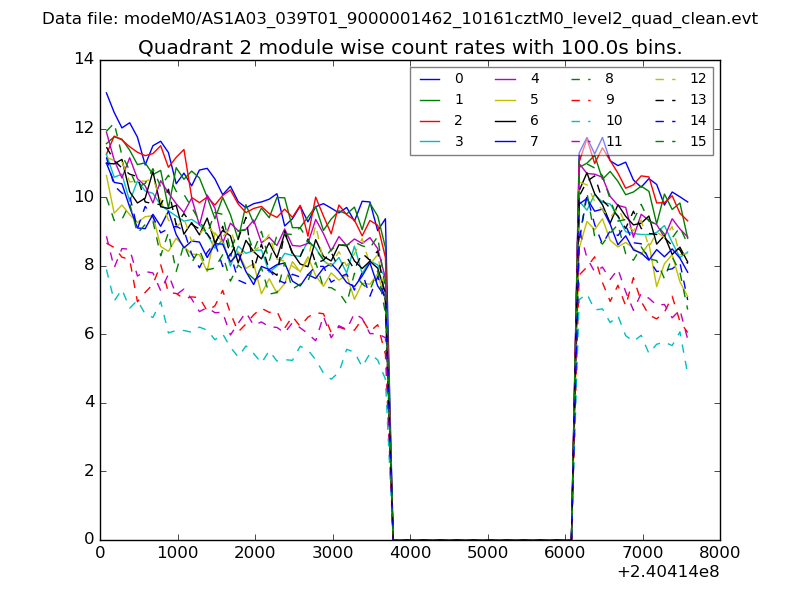
| Module-wise count rates for Quadrant B Data is divided into 100 sec bins |
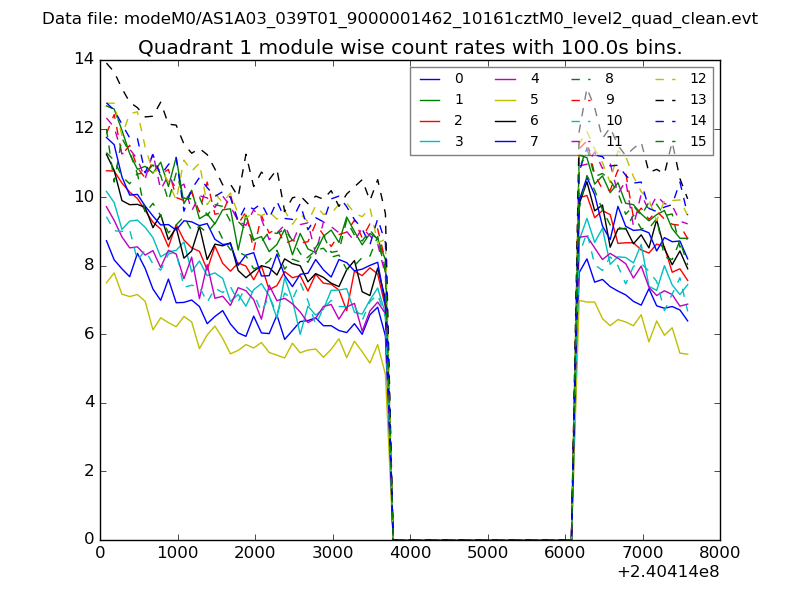 |
 |
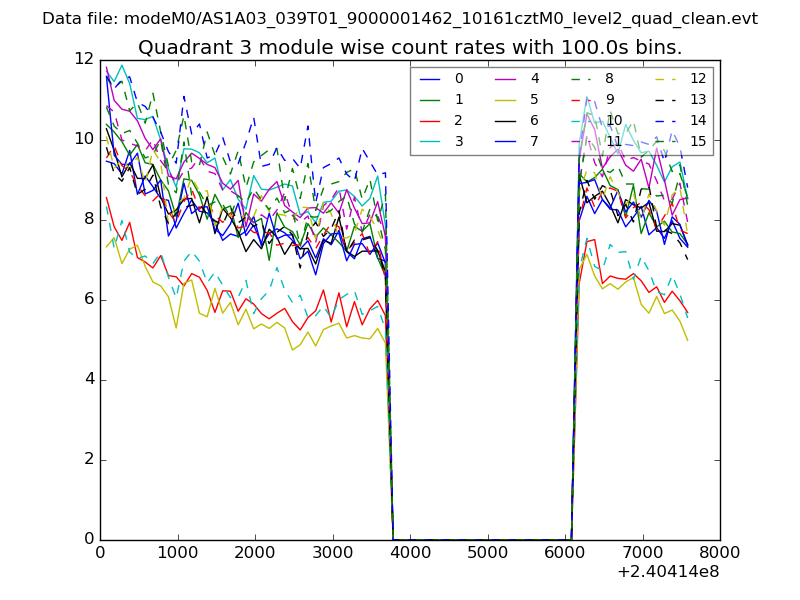
| Module-wise count rates for Quadrant C Data is divided into 100 sec bins |
 |
 |
| Module-wise count rates for Quadrant D Data is divided into 100 sec bins |
 |
 |
| Parameter | Plot |
|---|---|
| CZT HV Monitor | 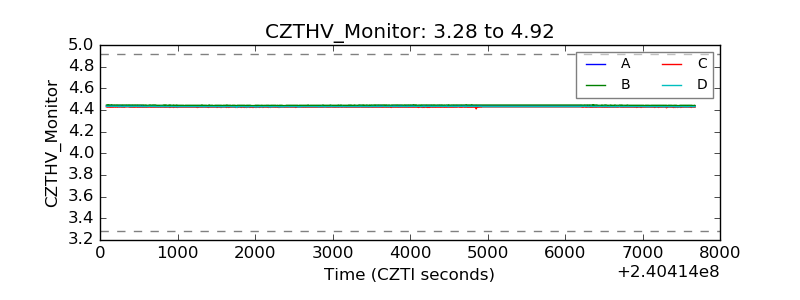 |
| D_VDD | 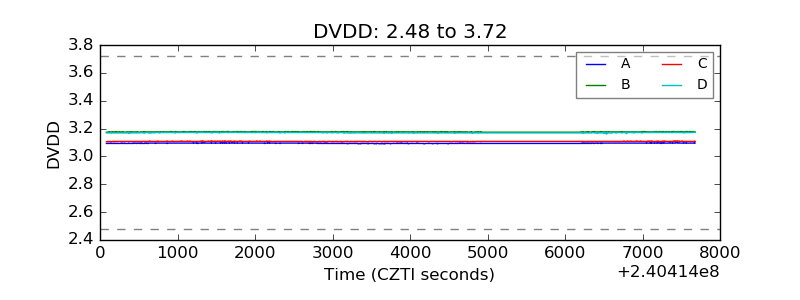 |
| Temperature 1 |  |
| Veto HV Monitor | 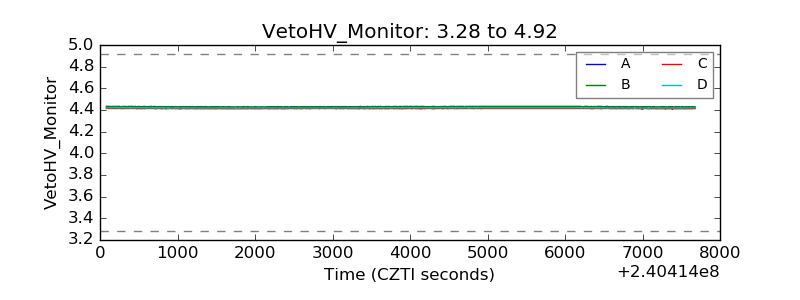 |
| Veto LLD | 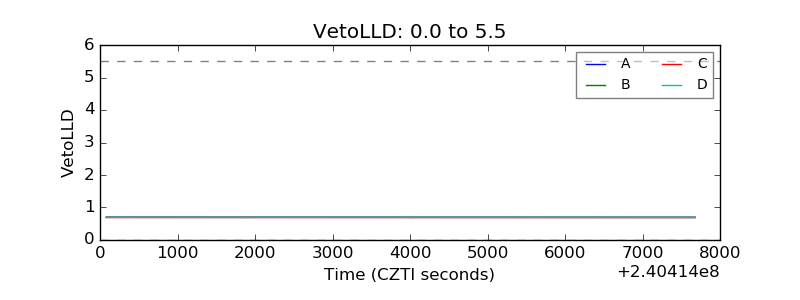 |
| Alpha Counter | 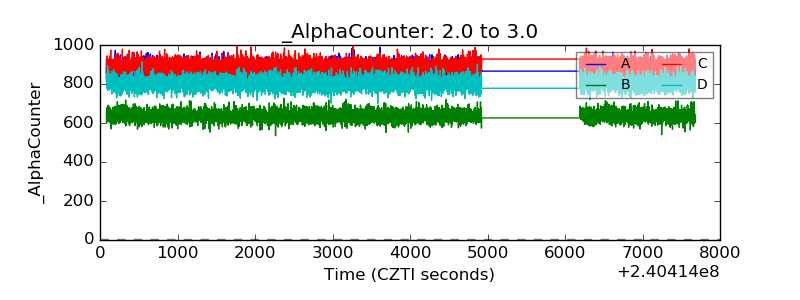 |
| _CPM_Rate | 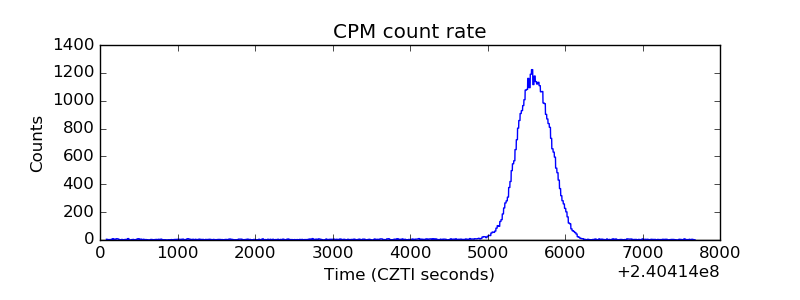 |
| CZT Counter | 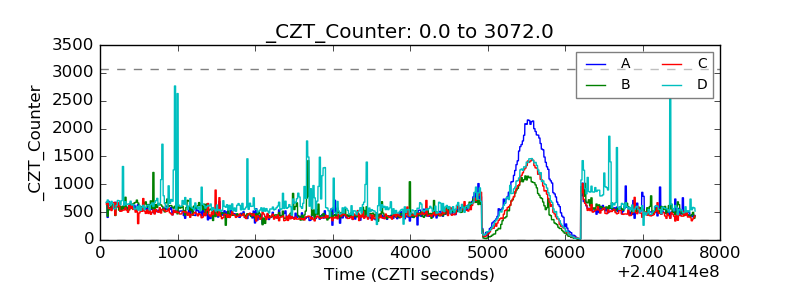 |
| +2.5 Volts monitor |  |
| +5 Volts monitor |  |
| _ROLL_ROT | 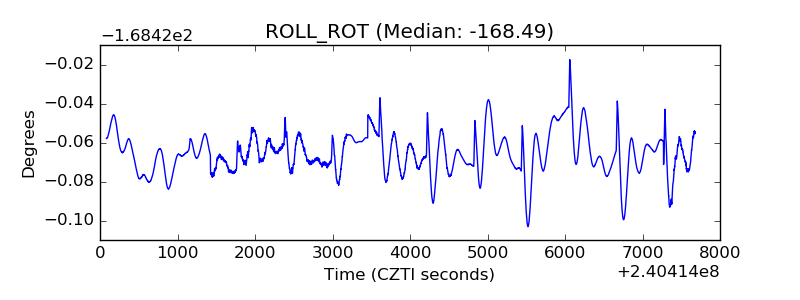 |
| _Roll_DEC | 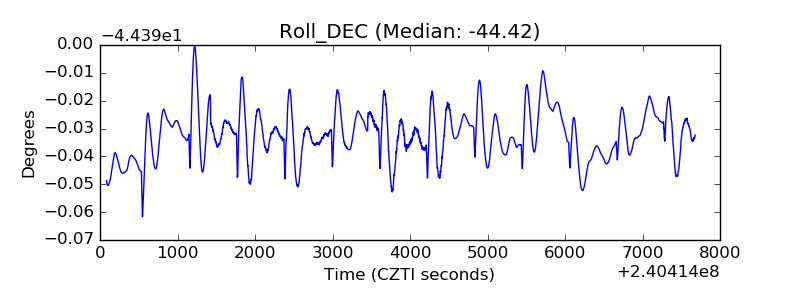 |
| _Roll_RA | 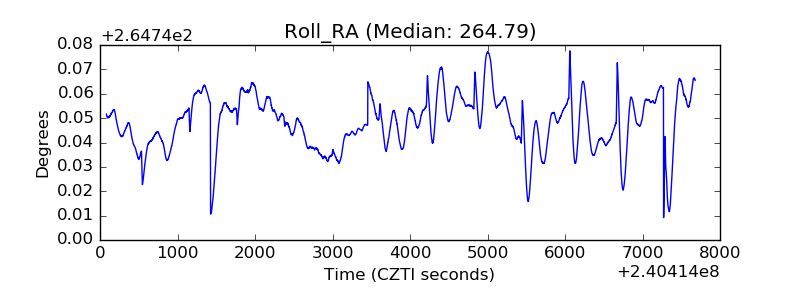 |
| Veto Counter | 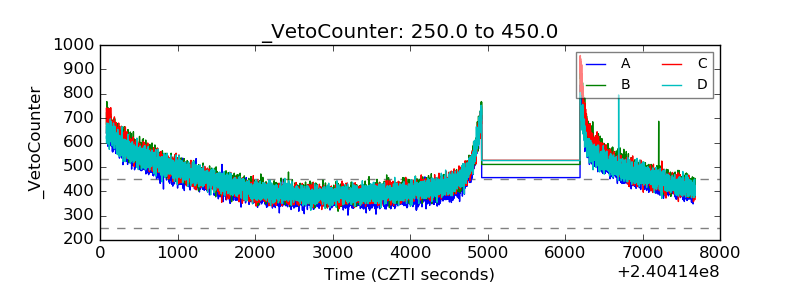 |